-
Paper Information
- Next Paper
- Paper Submission
-
Journal Information
- About This Journal
- Editorial Board
- Current Issue
- Archive
- Author Guidelines
- Contact Us
Marine Science
p-ISSN: 2163-2421 e-ISSN: 2163-243X
2014; 4(1): 10-20
doi:10.5923/j.ms.20140401.02
Benthopelagic Shrimp and Associated Pelagic and Benthopelagic Fauna on a Bowhead Whale Foraging Ground in Disko Bay, West Greenland
 Abstract
 Reference
 Full-Text PDF
 Full-text HTML
Ole Gorm Norden Andersen1, Kristin L. Laidre2, Mads Peter Heide-Jørgensen3
1Department of Bioscience, Aarhus University, Roskilde, 4000, Denmark
2Polar Science Center, APL/University of Washington, Seattle, WA98105-6698, USA
3Greenland Institute of Natural Resources, Nuuk, 3900, Greenland
Correspondence to: Ole Gorm Norden Andersen, Department of Bioscience, Aarhus University, Roskilde, 4000, Denmark.
| Email: |  |
Copyright © 2012 Scientific & Academic Publishing. All Rights Reserved.
Bowhead whales (Balaena mysticetus) congregate annually in Disko Bay, West Greenland prior to and during the spring phytoplankton bloom. We investigated the benthopelagic and associated pelagic fauna at 25 – 200 m depth during the spring of 2008 and 2009 in an area where foraging whales have often been observed. The benthopelagic and associated pelagic fauna > 0.5 mm in greatest body dimension was dominated by Crustacea which comprised 95 % of a total wet weight biomass of 2.1 ± 1.7 g m-3, and included at least 15 species of Caridea ≥ 5 mm (1.6 ± 1.5 g m-3) which comprised almost 100 % of Caridean, 81 % of Crustacean, and 77 % of total wet weight biomass m-3. Three groups of organisms ≥ 5 mm (Caridea, Mysida, and Pisces) made up 94 % of total wet weight biomass. Together, Copepoda, Amphipoda, Caridea, and Mysida made up 96 % of the total abundance of 63 ± 103 specimens m-3. Copepods averaged 42 % of total abundance. There was a general decrease in biomass and abundance with increasing depth, mainly due to Caridea, Mysida, and Amphipoda. Pisces and Copepoda had greatest biomass and were most abundant at intermediate depths (50-100 m). The size of most of the largest and most abundant species of Caridea and Pisces increased with depth. This is among the first detailed examinations of a bowhead whale foraging ground in the Arctic and the first comprehensive description of benthopelagic and associated pelagic fauna in West Greenland.
Keywords: Shrimp, Bowhead whale, West Greenland
Cite this paper: Ole Gorm Norden Andersen, Kristin L. Laidre, Mads Peter Heide-Jørgensen, Benthopelagic Shrimp and Associated Pelagic and Benthopelagic Fauna on a Bowhead Whale Foraging Ground in Disko Bay, West Greenland, Marine Science, Vol. 4 No. 1, 2014, pp. 10-20. doi: 10.5923/j.ms.20140401.02.
Article Outline
1. Introduction
- Every year in late winter and spring (March to May), approximately 1200 bowhead whales (Balaena mysticetus) arrive in Disko Bay, West Greenland (Figure 1) to feed on dense concentrations of copepods which thrive on a massive spring phytoplankton bloom that occurs just after the sea ice breaks up[1][2]. The spring bloom occurs over a 2-3 week period peaking between mid April and late May in the upper 15-40 m of the water column with a maximum peak at 5-10 m[3][4][1]. Although maximum diving depths for bowhead whales in the Disko Bay area exceed 400 m, most whale diving activity targets depths between 50 and 100 m[1]. This suggests some flexibility in bowhead feeding patterns and whales may in fact employ different strategies depending on the copepod cycle and timing of the spring bloom. Bowheads are known to feed close to the bottom in the bay Laksebugten in the northern Disko Bay off the south coast of Disko Island and likely target benthopelagic and associated organisms including dense swarms of lipid-rich copepods that are diapausing near the bottom[5][6]. Later in spring, whales may target copepods that ascend to couple with the spring bloom, requiring shallower dives but perhaps more water filtration.
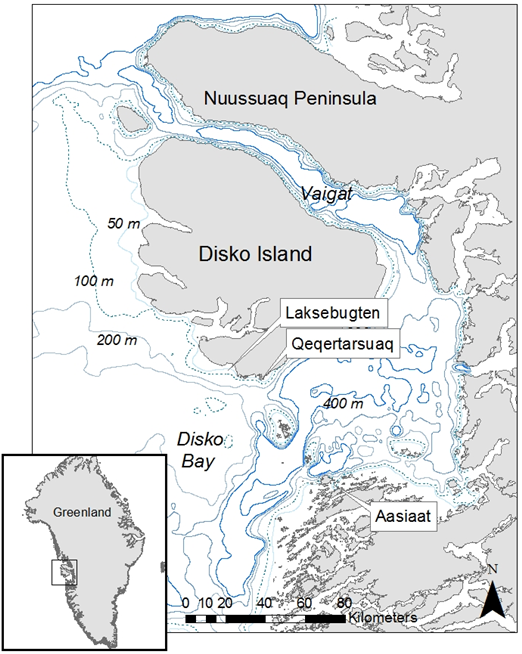 | Figure 1. Bathymetric map of Disko Bay, West Greenland with place names mentioned in the text |
2. Material and Methods
- Bottom-near benthopelagic and pelagic fauna > 0.5 mm was sampled between 18 April and 1 May 2008 and on 27 April 2009 at depths of 25–200 m. Samples were collected in and off the bay Laksebugten in northern Disko Bay off the south coast of Disko Island, West Greenland, in a ~ 100 km2 area centered at ~ 69.27oN, 54oW (Figure 2).
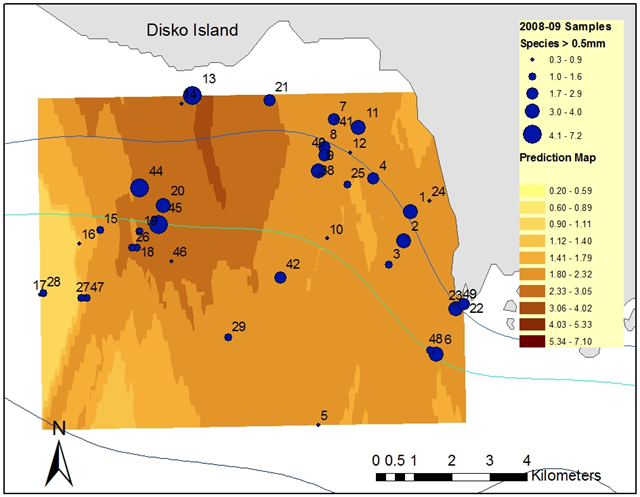 | Figure 2. The sampling area in and off Laksebugten centered at ~ 69.27oN, 54oW with depth contours 50 m, 100 m, and 200 m, and predicted (krigged) distribution of biomass and biomass at each station of benthopelagic and pelagic fauna caught with a 0.5 mm mesh epibenthic sledge (Figure 3) in g m-3 shown |
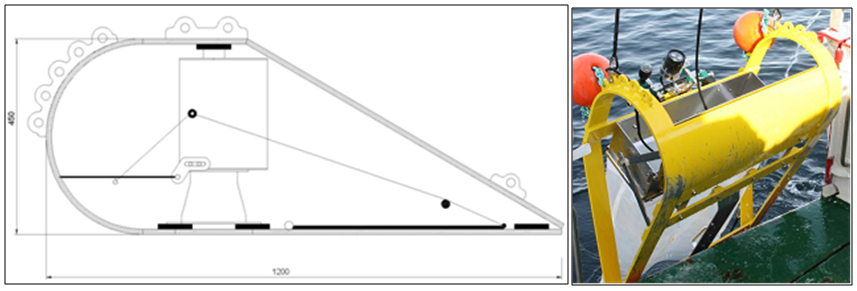 | Figure 3. KC epibenthic sledge, side view diagram without net and in natura being deployed open, as release arm hits deck |
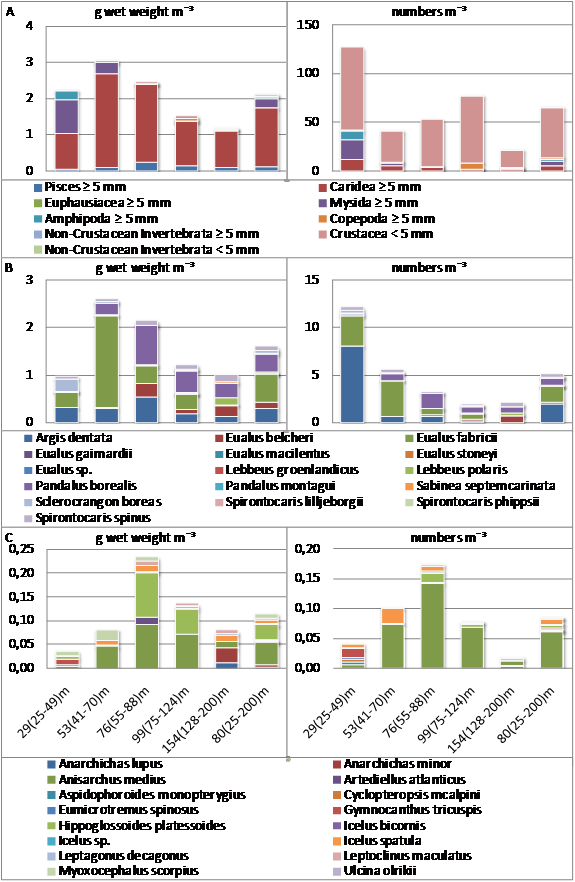 | Figure 4. Five depth-binned densities (by increasing depth) and total mean of faunal entities and size categories in epibenthic sledge samples (N=39) taken in and off the bay Laksebugten, Disko Island, West Greenland 18 April to 1 May 2008 and 27 April 2009 are shown as wet weight biomass in g m-3 (left) and abundance m-3 (right). Eight stations contributed to each of the first four depth bins, 7 to the fifth and all stations contributed to the last. A: All faunal entities (except minor Crustacean groups ≥ 5 mm), B: Caridea ≥ 5 mm, C: Pisces ≥ 5 mm. Mean depth and depth span of each bin is shown below the pillars in C |
3. Results
3.1. Sledge Samples
3.1.1. General
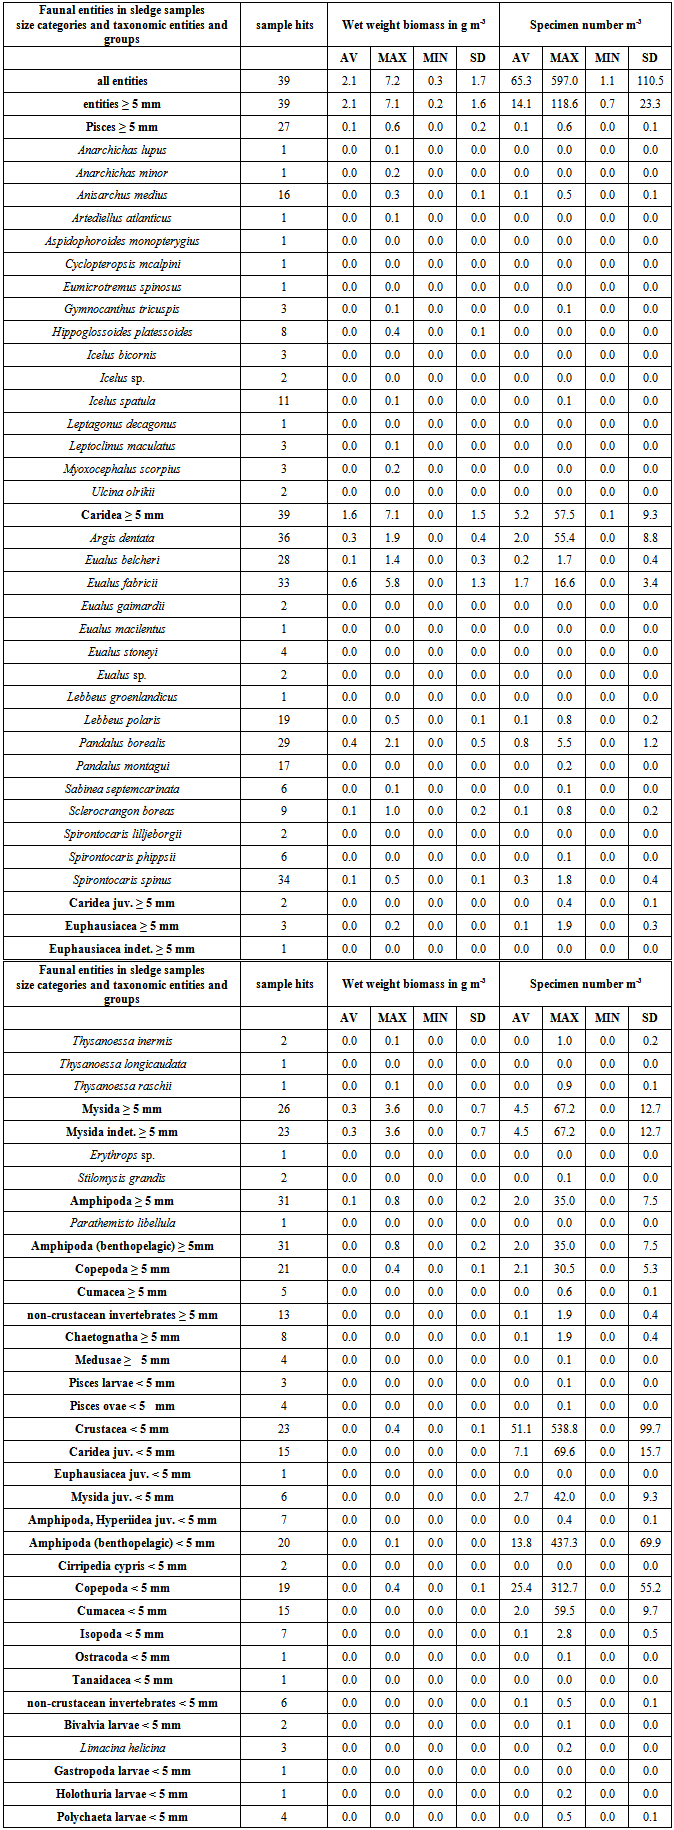
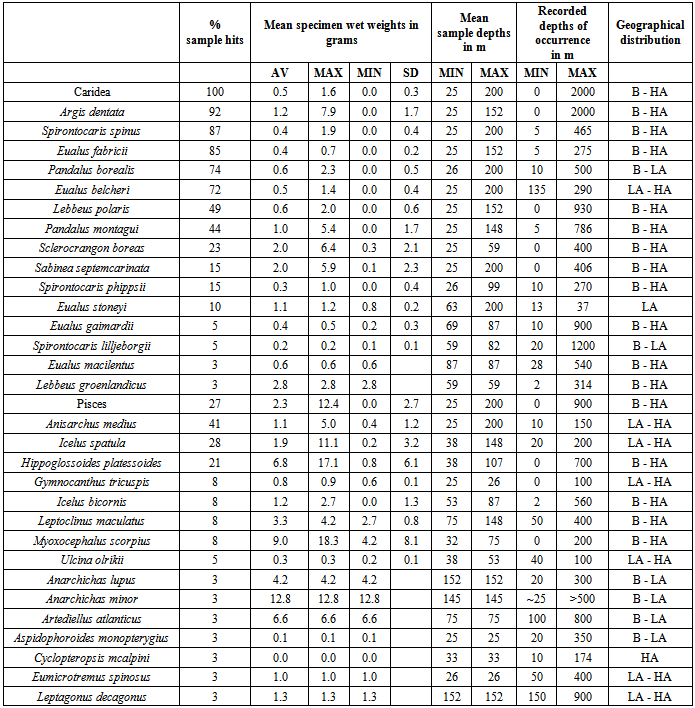
- Average wet weight biomass per station was 2.1 ± 1.7 g m-3 (Table 1). The size category ≥ 5 mm dominated biomass with 98±4% of the mean due almost exclusively to Crustacea contributing 92 ± 11 % and particularly to Crustacea of the infra-order Caridea contributing 77 ± 27% and the order Mysida contributing 12 ± 22% but also to Pisces contributing 5.5 ± 9.7 % to the mean.Average total abundance per station was 65 ± 111 organisms m-3. Organisms < 5 mm dominated with 78 ± 36% of the mean. Crustacea of all sizes dominated with 100 ± 2 % of the mean due primarily to Copepoda, Amphipoda, Caridea, and Mysida which together contributed 96 ± 6 % to the mean (Table 1).Total biomass (coefficient of variation (CV) 78 %) and abundance (CV 59 %), like those of the major taxonomic entities, varied greatly among stations. Total biomass decreased between 25 and 200 m from 2.8 to 0.5 g m-3 (r 0.34, p < 0.05) and from 88 to 11 organisms m-3 (r 0.22, p < 0.001). The total biomass was greatest in the depth range 41-70 m primarily due to Caridea. Total abundance was greatest in the shallowest depth bin (25-49 m) primarily due to Crustacea < 5 mm (Figure 4A). Due to observed avoid-ance in front of the sledge, biomass and abundance of larger organisms such as Pisces, Caridea, and Euphausiacea ≥ 5 mm should be regarded as minimum values.
3.1.2. Crustacea
- Crustacea ≥ 5 mm dominated both total biomass with 92 ± 11 % and Crustacean biomass with 98 ± 5 % in all samples, whereas Crustacea < 5 mm, found in 82 % of samples, dominated total abundance with a mean of 78 ± 36% of total abundance in 56 % of samples and Crustacean abundance with a mean of 79 ± 36 % of crustacean abundance in 59 % of samples (Table 1).
3.1.3. Caridea
- Fifteen species of Caridea ≥ 5 mm and < 9.5 mm long were identified in the sledge samples (Table 1). Most of them are of widespread Boreal to High Arctic occurrence and the depth distributions corresponded to those reported in the literature (Rathbun 1929, Squires 1990), except for Eualus belcheri which was also found at shallower depths and E. stoneyi which was found exclusively at greater depth (Table 2). Caridea were found in all samples and was the third most abundant taxonomic group - excluding Crustacea as a whole. Apart from Crustacea as a whole, Caridea ≥ 5 mm was the only taxonomic group found in all samples. Caridea ≥ 5 mm dominated both total Crustacean (81 ± 28 %) and Caridean (100 ± 0.4 %) biomass greatly. Caridea ≥ 5 mm dominated total biomass in 82 % of samples. In nearly half (44 %) of these they made up over 90 % of biomass and in 90 % of all samples they were the dominant taxonomic entity. Caridea < 5 mm occurred in 39 % of samples only and contributed marginally to total biomass with 0.2 ± 0.3 %. With 58 ± 34 % of Caridean numbers, they were slightly more abundant than Caridea ≥ 5 mm, but contributed little to total abundance (11 ± 22 %) (Table 1).The biomass of Caridea ≥ 5 mm peaked in the second shallowest depth bin (41–70 m), primarily due to E. fabricii, and was lowest in the deepest depth bin (128–200 m) (Figure 4B). The abundance of Caridea decreased from the shallowest depth bin (25-49 m) to the deepest (128-200 m) and linearly from 9.2 organisms m-3 at 25 m to -3.6 organisms m-3 at 200 m (r 0.34, p < 0.05). The mean size of Caridea ≥ 5 mm (Table 2) increased linearly from 0.34 g at 25 m to 0.88 g at 200 m (r 0.41, p < 0.01), with a mid-depth maximum at ~ 120 m (Figure 5).The five most widely distributed species of Caridea ≥ 5 mm within the investigation area (each found in 72 – 87 % of samples (Table 2)) were also the most abundant species and those with greatest total biomass (Table 1). The four species with greatest total biomass dominated total biomass and the biomass of Caridea ≥ 5 mm in up to 21 % of samples, contributing up to 90 % to total sample biomass and up to 91 % to sample biomass of Caridea ≥ 5 mm. No single species dominated total abundance in any single sample.Amongst the three species that dominated biomass and abundance of Caridea ≥ 5 mm the most, the biomass of E. fabricii followed the same depth distribution pattern as all Caridea ≥ 5 mm, peaking at 41–70 m and with lowest values at 128–200 m, whereas P. borealis and A. dentata peaked at 55–88 m and had their lowest values at 25–49 m and 128–200 m respectively (Figure 4B). Amongst the three, A. dentata dominated abundance and especially at 25–49 m, E. fabricii dominated and peaked at 41–70 m, and P. borealis dominated and peaked at 55–88 m (Figure 4B). There was a general increase in size with depth of Caridea ≥ 5 mm and of the two most abundant species E. fabricii and A. dentata, of which only the smallest specimens were found at the shallowest depths (Figure 5).
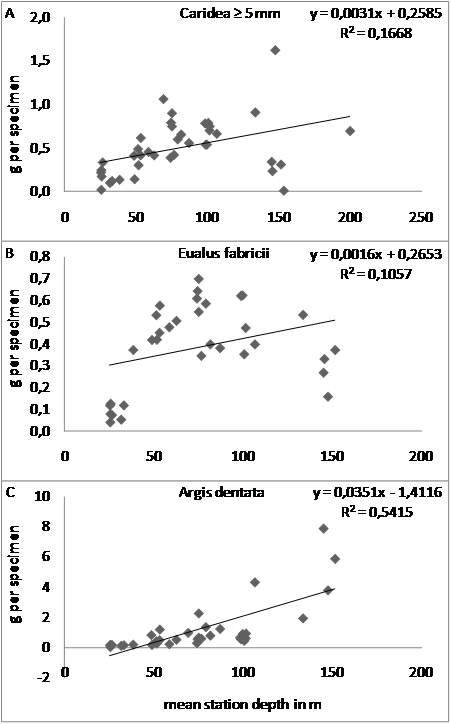 | Figure 5. Mean specimen size in g of A) Caridea ≥ 5 mm (N = 39) and B) and C) the two species also showing a significant (p < 0.001) increase in size with depth (B (N = 33)) (C (N = 34)) at epibenthic sledge stations in and off the bay Laksebugten, Disko Island, West Greenland 18 April to 1 May 2008 and 27 April 2009 |
3.1.4. Mysida
- Mysida were found in 67 % of samples and constituted the fourth most abundant taxonomic group (excluding Crustacea as a whole). They contributed to a minor extent to both total and Crustacean abundance (both 11 ± 23 %). A species and a genus of Mysida ≥ 5 mm were identified (Table 1), but in most samples, these relatively small (< 2 cm long) Crustacea were not determined to species. Mysida ≥ 5 mm, also found in 67 % of samples, constituted the taxonomic group ≥ 5 mm with the second largest mean biomass m-3 (12 ± 22 % of total) and they were more abundant than Mysida < 5 mm (7 ± 19 % compared to 4 ± 9 %). Mean biomass of Mysida < 5 mm, occurring in 15 % of samples, was negligible (0.04 ± 0.1 %). Mysida were caught almost exclusively at depths shallower than 50 m (Figure 4A).
3.1.5. Amphipoda
- Crustacea of the order Amphipoda were found in 87 % of samples and contributed to a minor extent to total biomass (3 ± 7 %) (Table 1). They were the second most abundant taxonomic group after Copepoda (24 ± 16 % of total). Amphipoda ≥ 5 mm were found in 95 % of samples and dominated Amphipodan biomass to a great extent (88 ± 35 %). Amphipoda < 5 mm, found in 74 % of samples, dominated Amphipodan abundance (87 ± 39 %) and contributed substantially to total abundance (21 ± 14 %). The pelagic Amphipoda, Hyperiidea were found in 18 % of samples, and adults ≥ 5 mm (1 species (Table 1)) were only found in one sample. Like Mysida, Amphipoda were caught almost exclusively at depths shallower than 50 m and biomass and abundance declined with increasing depth with a distinct minimum at ~ 125 m (Figure 4A). There were some exceptionally high estimates of biomass and abundance at 25 m, where Amphipoda < 5 mm were particularly abundant (Table 1).
3.1.6. Copepoda
- Crustaceans of the order Copepoda – almost exclusively Calanus species - were found in 82 % of samples. The mean biomass m-3 was slightly less than that of Amphipoda (2.7 ± 8 % of total), whereas mean abundance was almost double that of Amphipoda and the greatest among all taxonomic groups (42 ± 37 % of total) (Table 1). Copepoda ≥ 5 mm occurred in 54 % of samples, whereas Copepoda < 5 mm occurred in 72 % and dominated both Copepodan biomass (63 ± 35 %) and abundance (92 ± 33 %) and contributed substantially to total abundance (39 ± 36 %). Copepoda occurred at all depths (Figure 4A). Their biomass and abundance increased insignificantly with depth, with greatest values of both found at 50-100 m and one exceptionally high value at 100 m (Table 1, Figure 6A).
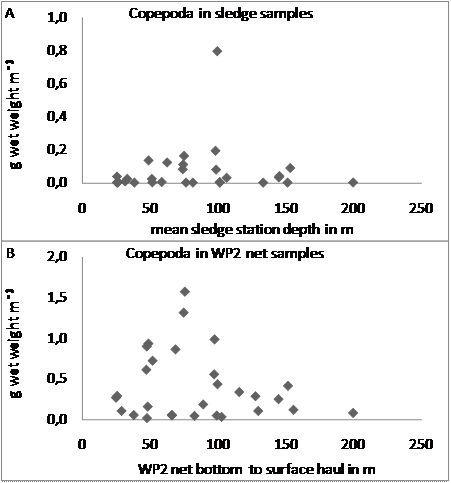 | Figure 6. Wet weight biomass in g m-3 of all Copepoda in A) sledge tows relative to mean station depth and B) WP2 net bottom to surface tows relative to station depth (N = 29) in and off the bay Laksebugten, Disko Bay, West Greenland 18 April to 1 May 2008 |
3.1.7. Euphausiacea
- Crustacea of the order Euphausiacea were found in four sledge samples only, of which three contained adults ≥ 5 mm (three species (Table 1)), contributing 0.3 ± 10 % to mean biomass and 0.08 ± 3 % to mean abundance, whereas the fourth contained only one juvenile < 5 mm.
3.1.8. Pisces
- Fifteen species of Pisces ≥ 5 mm and < 15 cm long were identified in the sledge samples (Table 1). Most of them are of widespread Boreal to High Arctic occurrence and their depth distribution matches those previously recorded[7]. Only the High Arctic Cyclopteropsis mcalpini has not previously been recorded south of Melville Bay. Pisces ≥ 5 mm were found in 69 % of samples, and even though they contributed the third largest biomass of taxonomic groups ≥ 5 mm (5 ± 10 % of total), they were not the dominant group ≥ 5 mm at any station. Mean biomass and abundance of Pisces < 5 mm, occurring in 13 % of samples only, was negligible (biomass 0.002 ± 0.02 % and abundance 0.00005 ± 0.0002 % of total). The two most abundant species, Anisarchus medius and Icelus spatula, were also the most widely distributed, occurring in 41 % and 28 % of samples respectively. Together they made up 81 ± 43% of abundance and 48 ± 46% of biomass of Pisces ≥ 5 mm. Pisces ≥ 5 mm occurred at all depths with a slight overall increase in biomass with depth and highest biomasses at ~ 75-100 m depth (Figure 4C). Abundance decreased slightly overall with increasing depth, with highest abundances at ~ 50–100 m depth (Figure 4C). Changes with depth in biomass and abundance of the two most abundant fish species, A. medius and I. spatula, were quite similar to those of all Pisces ≥ 5 mm. The mean size of Pisces ≥ 5 mm and of A. medius and I. spatula (Table 2) increased with depth (Figure 7).
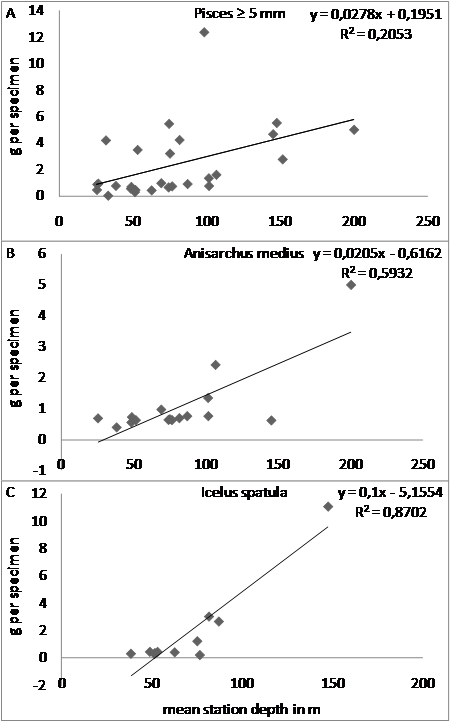 | Figure 7. Mean specimen size in g A) of Pisces ≥ 5 mm (N = 39) and B) and C) of the two Pisces species also showing a significant (p < 0.001) increase in size with depth (B (N = 16), C (N = 11)) at epibenthic sledge stations in and off the bay Laksebugten, Disko Island, West Greenland 18 April to 1 May 2008 and 27 April 2009 |
|
3.2. WP2 Net Samples
- The biomasses m-3 obtained from WP2 net samples in 2008 were much lower than those from the sledge samples. Total biomasses m-3 from the 29 WP2 net samples averaged 0.4 ± 0.4g m-3 while the total biomasses from the sledge samples averaged 2.1 ± 1.7 g m-3. Caridea ≥ 5 mm were found in only one 156 m haul (two P. borealis and one E. belcheri (Table 2)). Only a few Hyperiidea juv. were found (in 15 out of 29 WP2 net samples with a negligible biomass of 0.002 ± 0.003 g m-3) in 25-152 m hauls. Although some Euphausiacea were found in a few sledge samples from 2008, none were found in the WP2 net samples. Copepoda were found in all WP2 net samples - almost exclusively Calanus species and for the most part C. hyperboreus. The largest biomasses were obtained from the 50-100 m hauls and especially from the ~ 75 m hauls where C. hyperboreus was most abundant (Figure 6B). Also the sledge samples from 50-100 m depth yielded the greatest Copepod biomasses m-3. This would seem to indicate that Copepoda were most abundant near the bottom at 50-100 m depth at this point in time. But this was not so, since the sledge samples corresponding to the WP2 net samples yielded, on average, a Copepod biomass m-3 which was 49 % of the WP2 net samples (0-0.8 g compared to 0.015-1.6 g wet weight m-3). Seven out of the 29 sledge samples were virtually without Copepoda and 18 yielded a Copepod biomass m-3 which was 0.3-35 % of the corresponding WP2 net samples. The remaining four sledge samples taken at mean depths of 33-100 m yielded greater (1.5-2.5 times) Copepod biomasses m-3 than the corresponding WP2 net hauls from 48-116 m. But only for the 100 m sledge sample was this biomass overweight due to an exceptionally high Copepod biomass of 0.8 g m-3 (the greatest in any sledge sample and 12 times the mean Copepod biomass m-3 for the 29 sledge samples - but only half of the largest WP2 net sample Copepod biomass m-3). In the remaining three cases the Copepod biomass overweight in the sledge samples was due to a comparatively low Copepod biomass m-3 in the WP2 net samples (3.7-12 % of the WP2 net sample mean compared to 20-71 % of the WP2 net sample mean for the sledge samples).
4. Discussion
- The primary purpose of this study was to quantify the taxonomic groups and entities of the benthopelagic and associated bottom-near pelagic fauna > 0.5 mm in and off the bay Laksebugten off the south coast of Disko Island in the northern part of Disko Bay, West Greenland with respect to size, distribution, density, and biomass. The study focused on sampling animals that were considered potential prey for bowhead whales and efforts were aimed at identifying the taxonomic groups that contribute the most to total biomass in the area. Detailed studies of benthopelagic and associated pelagic fauna in the Arctic are rare and none exist from Greenland. An epibenthic sledge (KC Denmark A/S) was used to sample benthopelagic and associated pelagic animals living close to the bottom. With some exceptions, the sledge performed well and sampled consistently at the depth range 25-200 m. On some occasions, however, large rocks caused the sledge to topple over and end upside down. Benthopelagic and associated pelagic fauna is critical to many food chains in the Arctic and quantification of animal biomass and abundance provides an important insight into the background for distribution and occurrence of several top predators. Both abundance and diversity of benthopelagic and associated pelagic invertebrates suggest that Laksebugten is a highly productive area. This is also supported by high concentrations of schooling fish (capelin Mallotus villosus) in summer, large sea bird colonies (fulmar Fulmarus glacialis, cormorant Phalacrocorax carbo, black guillemot Cepphus grylle, kittiwake Rissa tridactyla), large abundance of bowhead whales in late winter and spring, and the occurrence in summer of several species of other large baleen whales (fin whale Balaenoptera physalus, minke whale Baleanoptera acutorostrata, humpback whale Meganoptera novaeangliae) that generally use West Greenland waters as a summer ground[12] and specifically seek localities such as Disko Bay for feeding. It is interesting to consider why waters in and off Laksebugten, out of thousands of bays and inlets along the coast of West Greenland, could have a particularly high production with a rich benthopelagic and associated pelagic fauna.[13] describes a cyclonal current in Disko Bay receiving water from the West Greenland Current from the south and occasionally, when this current is weak, from the Baffin Current via the Vaigat (a strait to the north between Disko Island and the Nuussuaq Peninsula). Water is extruded northward through the Vaigat and/or westward, south of Disko Island, passing by Laksebugten. Deep, relatively high-saline and warm inflowing water from the West Greenland Current mixes with less saline, locally cooled and diluted intermediate water which in turn mixes with fresher surface water, which is colder and not so diluted in winter and warmer and more diluted in summer. According to[14] much of the water leaving Disko Bay passes along the southern coast of Disko Island as a highly stratified current, especially in spring. Upwelling of nutrient-rich deep West Greenland Current water driven by the melting of icebergs and glaciers is the basis for exceptionally high primary productivity in the north-eastern part of the bay and in the outgoing current, especially in spring when sea ice no longer blocks out sunlight[3]. Later in the year, production intensity tapers off due to surface mixing and surface layers being depleted of nutrients as the current flows out of Disko Bay. Production is generally higher in the northern part of the bay mouth near Disko Island and Qeqertarsuaq than in the southern part near the mainland and Aasiaat. Copepoda, notably Calanus species that diapause in deeper water, are primary prey animals of bowhead whales. Adults and eggs of some Calanus rise to the surface to propagate and hatch during the spring bloom[5][6]. Here they feed into the shallow benthopelagic community in Laksebugten and contribute to the production in this area. Stomach contents from bowhead whales caught in Alaskan waters[15] included 136 faunal entities (family, gender, species), of which 92 were benthic or benthopelagic, including 11 Caridea and 11 Pisces. In this study, 15 species of Caridea and 15 species of Pisces were identified in the sledge samples from Laksebugten and were thus available to bowhead whales. The stomach contents from two bowhead whales caught in Disko Bay in May 2009 included ~ 99 % Copepoda (by both weight and number), similar to the content of several WP2 net samples from the upper 15 m in Disko Bay in 2009. These two whales, therefore, did not target the benthopelagic and associated pelagic fauna in the area.
5. Conclusions
- Although a rich benthopelagic and associated pelagic fauna was found in the foraging area, further studies of bowhead feeding are needed to elucidate to what extent this potential food source in Laksebugten and adjacent areas is included in the late winter and spring diet of bowhead whales in West Greenland.
ACKNOWLEDGEMENTS
- This study was funded by the Commission for Scientific Research in Greenland (IPY funding), by the US National Ocean Partnership Program (Office of Naval Research and US National Science Foundation) and by the Greenland Institute of Natural Resources. The University of Copenhagen kindly provided access to their facilities including r/v Porsild in Qeqertarsuaq.
References
| [1] | Laidre, K. L., Heide-Jørgensen, M. P., and Nielsen, T. G., 2007, Role of the bowhead whale as a predator in West Greenland, Mar Ecol Prog Ser., 346, 285-297. |
| [2] | Heide-Jørgensen, M. P., Laidre, K. L., Borchers, D., Samara, F., and Stern, H., 2007, Increasing abundance of bowhead whales in West Greenland, Biol Lett, 3, 577-580. |
| [3] | Andersen, O. G. N., 1981b, The annual cycle of phytoplankton primary production and hydrography in the Disko Bugt area, West Greenland, Medd Grønl Biosci, 6, 1-65 (Publications from the Danish Arctic Station No. 81). |
| [4] | Nielsen, T. G., and Hansen, B. W., 1995, Plankton community structure and carbon cycling on the western coast of Greenland during and after the sedimentation of a diatom bloom, Mar Ecol Prog Ser 125, 239-257. |
| [5] | Madsen, S. D., Nielsen, T. G., and Hansen, B., W., 2001, Annual population development and production by Calanus finmarchicus, C. glacialis and C. hyperboreus in Disko Bay, western Greenland, Mar Biol, 139, 75-93. |
| [6] | Swalethorp, R., Hansen, S. K., Dünweber, M., Nielsen, T. G., and Hansen, B. W., 2009, Production of Calanus finmarchicus and C. glacialis during the spring in Disko Bay, West Greenland, ASLO Aquat Sci Meet 2009, A cruise through nice waters! Nice, 25.1.2009 - 30.1.2009, Poster. |
| [7] | Muus, B. J., Salomonsen, F., and Vibe, C., Grønlands Fauna, Fisk . Fugle . Pattedyr, Gyldendal, 1981: 1-467. |
| [8] | Rathbun, M. J., 1929, Canadian Atlantic Fauna 10. Arthropoda 10m. Decapoda. Biol Board Canada, Atl Biol Stat St. Andrews N B: 1-38. |
| [9] | Squires, H. J., 1990, Decapoda Crustacea of the Atlantic Coast of Canada, Can Bull Fish Aquat Sci, 221: 1-532. |
| [10] | Mauchline, J., 1971, Euphausiacea: adults. Cons Int Expl Mer, Sheet 134: 1-8. |
| [11] | Dunbar, M. J., 1963, Amphipoda, sub-order: Hyperiidea, Family: Hyperiidae. Cons Int Expl Mer, Sheet 103: 1-4. |
| [12] | Laidre, K. L., Heide-Jørgensen, M.P., Heagerty, P., Cossio, A., Bergstrom, B., and Simon, M. 2010, Spatial associations between large baleen whales and their prey in West Greenland, Mar Ecol Prog Ser 402: 269-284. |
| [13] | Buch, E., 2000, A monograph on the physical oceanography of the Greenland waters, Danish Met Inst Sci Rep, 00-12: 1-405 (Greenland Fish Res Inst Rep, 1990: 1-405). |
| [14] | Andersen, O. G. N., 1981a, The annual cycle of temperature, salinity, currents and water masses in Disko Bugt and adjacent waters, West Greenland, Medd Grønl Biosci, 5: 1-33 (Publications from the Danish Arctic Station No. 80). |
| [15] | Lowry, L. F., Sheffield, G., and George, J. C., 2004, Bowhead whale feeding in the Alaskan Beaufort Sea, based on stomach content analyses, J Cetacean Res Manage, 6(3): 215-223. |