-
Paper Information
- Next Paper
- Paper Submission
-
Journal Information
- About This Journal
- Editorial Board
- Current Issue
- Archive
- Author Guidelines
- Contact Us
Journal of Laboratory Chemical Education
p-ISSN: 2331-7450 e-ISSN: 2331-7469
2018; 6(5): 141-147
doi:10.5923/j.jlce.20180605.01

Kinetic Studies of Fenton Oxidation Reaction by UV-VIS Spectroscopy
 Abstract
 Reference
 Full-Text PDF
 Full-text HTML
Zhongde Dai, Gøril Flatberg, Heinz A. Preisig, Liyuan Deng
Department of Chemical Engineering, Norwegian University of Science and Technology (NTNU), Trondheim, Norway
Correspondence to: Liyuan Deng, Department of Chemical Engineering, Norwegian University of Science and Technology (NTNU), Trondheim, Norway.
| Email: |  |
Copyright © 2018 The Author(s). Published by Scientific & Academic Publishing.
This work is licensed under the Creative Commons Attribution International License (CC BY).
http://creativecommons.org/licenses/by/4.0/

Chemical reaction engineering is one of the core courses for chemical engineering students. Laboratory exercise is an essential part of this course. The goal of this laboratory exercise is to demonstrate the possibility of using an in-situ spectroscopic method (UV-VIS spectroscopy) to investigate reaction kinetics. A solution of naphthol blue black (NBB) is oxidized by H2O2 through a Fenton oxidation process. In this exercise, the concentration of NBB was monitored by the UV-VIS spectroscopy, while the concentrations of H2O2, FeSO4 and different pH levels may be adjusted to enable students to obtain a wide range of reaction kinetic data. The reaction rate constant, kapp, can be estimated with a pseudo-first-order kinetic model. In addition, the reaction temperature was adjusted to investigate the decomposition activation energy (Ea), which exhibited a value of 56.0±7 kJ mol-1.
Keywords: Laboratory Instruction, Dyes /Pigments, Fenton and/or redox Reactions, UV-VIS spectroscopy
Cite this paper: Zhongde Dai, Gøril Flatberg, Heinz A. Preisig, Liyuan Deng, Kinetic Studies of Fenton Oxidation Reaction by UV-VIS Spectroscopy, Journal of Laboratory Chemical Education, Vol. 6 No. 5, 2018, pp. 141-147. doi: 10.5923/j.jlce.20180605.01.
Article Outline
1. Introduction
- Chemical reaction kinetics is the measurement of how quickly reactions occur, which is critical for discovering the mechanism of many reactions [1]. In undergraduate study, chemical reaction kinetics is a central concept in general chemistry as well as chemical reaction engineering. Generally, in chemical reaction kinetics study, typical pedagogical flow of teaching and reasoning in textbooks flows from postulated schemes to predicted results. On the other hand, the experience in the laboratory is opposite: students construct reaction schemes based on experiments data and extract a proper mathematical model to describe the reaction. Therefore, experimental exercise of measuring chemical kinetics is an essential pedagogical practice to enhance the understanding of the knowledge obtained from textbooks. In the past years, different methods have been applied to demonstrate chemical kinetics in the lab, such as stopped-flow methods, chemical relaxation methods and spectrophotometry methods [2-4]. Among these methods, detecting chemical reaction kinetics in diluted aqueous solution using spectrophotometry is most commonly used due to its simplicity and safety. This paper presents the design and practice of the laboratory exercise using UV-VIS spectroscopy to monitor the concentration changes of the reactants. The Fenton oxidation was chosen as example to study the chemical reaction kinetics. The reaction between iodide and peroxydisulfate as well as the decomposition of bezenediazonium ion are commonly used to study reaction kinetics. Compared to the other two processes, Fenton oxidation process is more economical for destructing hazardous pollutants in waste water [5-7]. Fenton oxidation process has been widely used as a powerful method for the degradation of various pollutants in wastewater. Due to the very active radicals produced in Fenton oxidation process, it is quite effective in removing almost any organic contaminant from waste water at near ambient temperature and pressure [8]. Therefore, employing Fenton oxidation as demonstration reaction is not only a good example to study reaction kinetics, but also gives the students an opportunity to learn some basic knowledge about a waste water treatment method. In addition, none of the reactants involved in this reaction are toxic or dangerous to handle, and the reaction condition is moderate. This lab exercise is thus considered easy and safe for the students. No special facilities and protective equipment are needed. Furthermore, UV-VIS spectroscopy is a safe, low cost and simple instrument, which is suitable for undergraduate students with limited laboratory experience [9].
2. Background
2.1. Fenton Oxidation
- In waste water treatment, biodegradation is a predominant process. However, many pollutants are of a non-biodegradable nature. For instance, azo dyes has been widely used in textiles, cosmetics, printing and pharmaceutical industries, represent an important type of contaminants that are not biodegradable, can only be eliminated by the Fenton oxidation process. Fenton oxidation is one of the most advanced oxidation processes (AOPs) used in the waste water treatment, which normally involves a mixture of an iron catalyst and hydrogen peroxide in a aqueous solution [10]. In Fenton oxidation process, highly reactive hydroxyl radicals, which are very effective oxidative species (standard reduction potential of
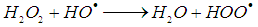
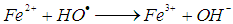
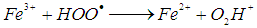
 is 2.8 V), can be produced [11]. The hydroxyl radicals (HO•) are produced due to the reaction of the reaction between hydrogen peroxide and ferrous ions (reaction 1). In a side reaction, ferric ions can further react with H2O2 to give Fe2+ and hydroperoxyl radicals (reaction 2), by which the redox cycle Fe2+-Fe3+ is accomplished. The concentration of the hydroxyl radicals in the reaction mixture can also be lowered by scavengers (reactions 3, 4 and 8). Reaction is usually carried out at low pH in order to avoid formation of ferric oxohydroxide precipitates. The main reactions taking place in Fenton process are listed in (1) - (8) [12]:
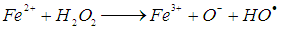 | (1) |
 | (2) |
 | (3) |
 | (4) |
 | (5) |
 | (6) |
 | (7) |
 | (8) |
2.2. Kinetics of Degradation
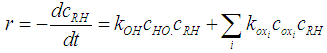
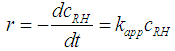
- The oxidation of organic pollutants by the HO• radicals can be described by several reaction mechanisms: HO• radicals react with the organic pollutant by abstracting H from C-H, N-H, or O-H bonds, or by adding to C-C bonds or conjugate aromatic rings. In any case, the large number of involved steps leads to a very complex kinetic model. A general rate law for the reactions with the key organic molecule can be written as follows [13]:
 | (9) |
 | (10) |
 | (11) |
 | (12) |
2.3. The Use of UV-VIS Spectroscopy for Kinetic Measurement
- Spectrophotometry is a commonly used method to experimentally determine the reaction rates [14, 15]. The UV-VIS spectroscopy can measure the change of the concentrations of reactants or products over time. In this study, the UV-VIS spectroscopy was used to monitor the concentration of NBB (chemical structure shown in Figure 1) due to the absorption of the aromatic rings and azo group. Naphthol blue black (NBB) is an important acidic diazo dye in industrial applications, which has been widely used in the textile industry for dyeing wool, nylon, silk and textile printing [16]. On the other hand, NBB also presents a high toxicity to the environment because of the presence of phenolic, anilino, naphthalene and sulfonated groups (as shown in Figure 1). In addition, it has high photo- and thermal-stability [17]. Therefore, removing NBB from wastewater of textile industry is of great importance.
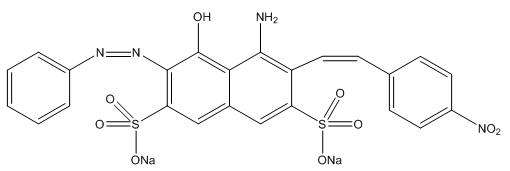 | Figure 1. Chemical structure of Napthol blue black |
 | (13) |
 | (14) |
3. Experimental
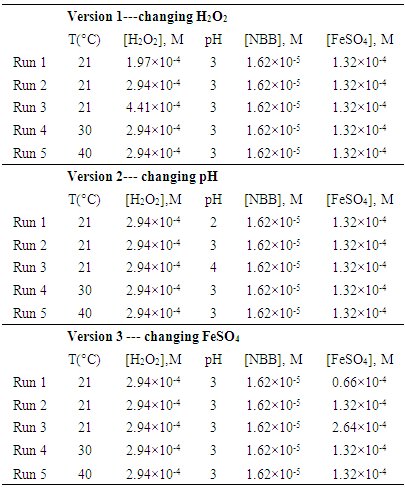
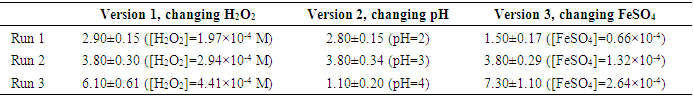
- In the exercise, NBB and FeSO4·7H2O was first mixed in a Erlenmeyer flask wrapped in aluminum foil, then 0.5 M H2SO4 or NaOH solutions were added dropwisely until desired pH was reached (pH meter: METTLER TOLEDO, S220 SevenCompact™ pH/Ion meter). A thermostated water bath was employed to maintain the temperature of the mixture over the experimental period. Once the desired temperature was stabilized, the H2O2 solution was added and simultaneously the UV-VIS spectroscopy (AvaLight-DH-S deuterium-halogen light source and an AvaSpec-2048 fiber optic spectrometer) was used to collect the NBB concentration information. The time started to add H2O2 in the solution was referred as T0 and considered as the starting point of the reaction. In the current exercise, 3 different versions of the experiments are available for the students: The first choice is to investigate the effects of the pH of the solution, while the second and third choices are to investigate the concentrations of H2O2 and FeSO4, respectively. Detailed molarities of all the stock solutions are listed in Table 1.
|
4. Hazards
- Before the students can work in the lab they must go through the Safety Data Sheet (SDS) for all involved chemicals and work through the risk assessment form prepared for the experiment, including the apparatus card being completed by the experiment host. Due to the usage of 30% H2O2 in the exercise, the possibility of causing serious eye damage must be highlighted to warn the students. The use of standard personal protective equipment (laboratory coat, nitrile gloves, and splash goggles) is also required. In this exercise, UV light is employed to detect the NBB concentration in the solution with an in situ probe. As an added precaution, students are instructed to switch off the UV light before removing the aluminum foil from the Erlenmeyer flask. Finally, as the solutions are acidic (pH 2-4) and containing iron (~0.02 mg mL-1), the solutions should be neutralized and diluted prior to disposal.
5. Results and Discussion
5.1. Effect of H2O2 Concentration, pH and FeSO4 Concentration on the kapp
- Figure 2 clearly demonstrates the change of solution color before and after the Fenton oxidation. The experiment does not only demonstrate the efficiency of this Fenton oxidation, but it is also a good example of how the chemistry can be used in a real life application.
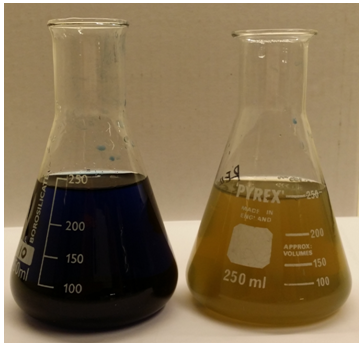 | Figure 2. Optical images of the NBB solution before and after the Fenton oxidation reaction |
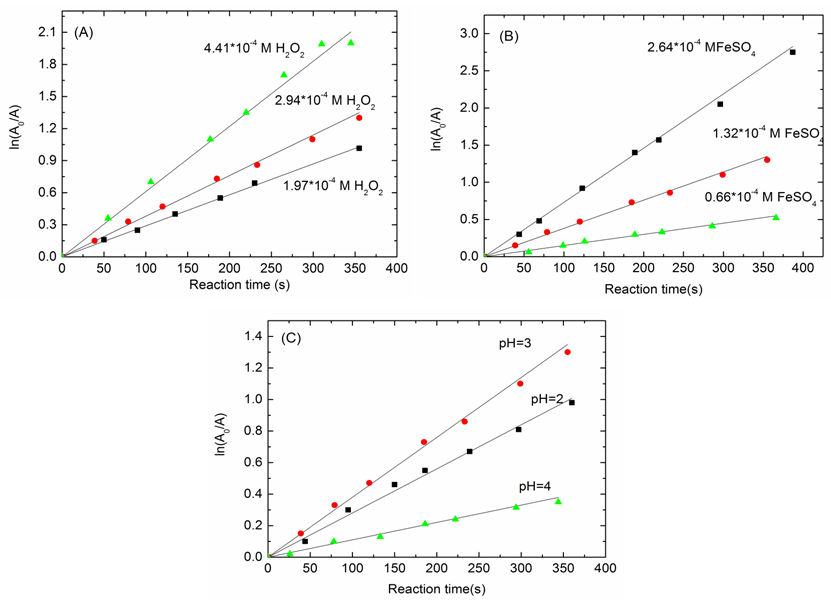 | Figure 3. Illustrative example of the effect of different parameters on the rate constant, (A) H2O2 concentration, [NBB]= 1.62×10⁻⁵, [FeSO4]= 1.32×10⁻⁴ M, pH=3; (B) FeSO4 concentration, [NBB]= 1.62×10⁻⁵, [H2O2]= 2.94×10⁻⁴ M, pH=3; and (C) pH, [H2O2]= 2.94×10⁻⁴ M, [NBB]= 1.62×10⁻⁵, [FeSO4]= 1.32×10⁻⁴ M. Experiment carried out at room temperature |
|
5.2. Comparison of Rate Constant at Different Wavelength
- Figure 4 presents the absorbance of the azo group (618 nm) and the aromatic rings (320 nm) over time. It is obvious that the peak at 618 nm reduces drastically over time, while there is little variation in the peak at 320 nm, which clearly shows that the Fenton oxidation is more effective for oxidation of the azo group (618 nm) than the aromatic rings (320 nm) for NBB.
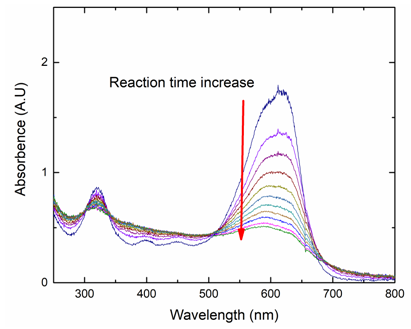 | Figure 4. Absorbance of NBB over reaction time. Reaction condition: [H2O2]= 2.94×10⁻⁴ M, [NBB]= 1.62×10⁻⁵, [FeSO4]= 1.32×10⁻⁴ M, pH=3 at room temperature |
5.3. Activation Energy Calculation
- Figure 5 shows the natural logarithm of kapp plotted against -1/T, which gives the activation energy (based on equation (14)). The slope of the linear regression is multiplied by the universal gas constant, R (R=8.314 J K-1 mol-1), yielding the activation energy (Ea). In our study, an Ea value of 56.0±7 kJ mol-1 was obtained. It is worth mentioning that different compounds have different activation energy in Fenton oxidation process [23, 24]. Therefore, due to the big variety of the activation value, it is difficult to use literature data to validate/confirm their results.
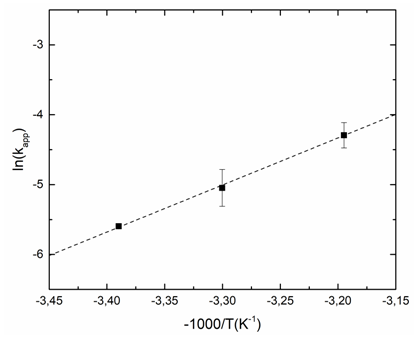 | Figure 5. Illustrative example of the activation energy calculation. Reaction condition: [H2O2]=2.94×10⁻⁴ M, [NBB]=1.62×10⁻⁵, [FeSO4]=1.32×10⁻⁴ M, pH=3. Experiment carried out at room temperature, 30 and 40°C |
6. Conclusions
- The design and implementation of the laboratory exercise using UV-VIS spectroscopy to investigate the chemical reaction kinetics of decomposition of NBB by Fenton oxidation has been successful. This exercise employs relatively small, inexpensive, simple and readily available pieces of equipment and can give the effective and hands-on experimental training to undergraduate students enrolled in different chemistry / chemical engineering courses. According to the results, the chemical kinetics of NBB decomposition by Fenton oxidation reaction can be easily studied in a laboratory period of 2.5 to 3 hours. The rate constant (kapp) and activation energy (Ea) can be investigated under different conditions. Furthermore, by analyzing the data obtained from this lab exercise, additional learning objectives can be introduced to students (e.g. determination of order w.r.t. to each reactant or catalyst).
7. Associated Content
- The supporting information is available, including: 1. List of chemical and reagents; 2. Experiment procedure; 3. Data treatment; 4. Exercise implementation and evaluation; 5. Work Plan Guidelines, 6. Report Guidelines; 7. Grading criteria and 8. Experimental introduction.
ACKNOWLEDGMENTS
- Dr. Mikael Hammer is gratefully acknowledged for reviewing this paper.