Nour Eddine Benaouda1, Lyes Bennamoun2, Abdellah Khellaf1
1Centre de Développement des Energies Renouvelables, CDER, BP 62 Route de l'Observatoire, Bouzaréah, 16340, Alger, Algérie
2Department of Mechanical Engineering, University of New Brunswick, Fredericton, E3B 5A3, Canada
Correspondence to: Lyes Bennamoun, Department of Mechanical Engineering, University of New Brunswick, Fredericton, E3B 5A3, Canada.
| Email: |  |
Copyright © 2014 Scientific & Academic Publishing. All Rights Reserved.
Abstract
In this study, Constant drying rate phase (CDRP) of spearmint and bay leaves are determined during application of forced convective drying. The applied conditions are: 30, 40 and 50°C for the air temperature, the relative humidity and the air velocity vary respectively from 20 to 60% and from 0.5 to 1.5 m/s. Two methods are used to define the CDRP based on the two parameters of external drying conditions; this is the differencebetweenthewet and drybulb temperature of airand the drying air velocity; data empirical and a neural network approach (ANN), the expressions of CDRP are determined and the coefficients characterizing the product are identified with experimental data, an artificial neural network model, trained by levenberg-Marquardt algorithm, is developed to predict the values of the CDRP. The results of the two approached are statistically compared by calculation of the correlation coefficient R2 and the fit standard error (FitStdErr). The artificial neural network model is able to predict the initial drying rate of bay leaves quite well with R2 of 0.92. The fit standard error is obtained as 0.006.
Keywords:
Constant drying rate phase (CDRP), Spearmint, Bay leaves, Neural Network, Thin layer
Cite this paper: Nour Eddine Benaouda, Lyes Bennamoun, Abdellah Khellaf, Empirical and Artificial Neural Network Approach for Determination of Constant Drying Rate Phase of Medicinal and Aromatic Plants, International Journal of Energy Engineering, Vol. 4 No. 2A, 2014, pp. 1-7. doi: 10.5923/j.ijee.201401.01.
1. Introduction
Determination of CDRP during drying has a particular importance as it plays an important role for the design of a solar dryer and simulation of transport phenomena involved in drying of agro-alimentary products. Note also that the normalized drying rate reflects the prominence of the CDRP; it is defined as the quotient of the actual drying rate and the drying rate of the first drying phase and is expressed versus normalized moisture, as shown in equation (1) | (1) |
 | (2) |
f denotes the normalized drying rate, and X* denotes the normalized moisture content. Where X is the moisture content of the dried product; t is the drying time, X0 end Xeq are the initial and equilibrium moisture content. Ahouannou at al. [1] suggests a strategy for determining the normalized drying rate f. They used the following expression: | (3) |
The best value of n, characteristic of the product, can be found by taking the natural logarithm of both sides of equation (3), we deduct for each experimental point a value of nt such that: | (4) |
For experiments performed at different drying conditions, ni is the average value calculated from the expression: | (5) |
Where p is the number of experimentsA brief review of studies on constant drying rate phase determination, In order to determine the drying characteristic curve (C.C.D) of sage leaves, The regression equation is fitted from the experimental data by Belghit et al. [2], the expression of the CDRP is evaluated by using the relation established by Fornell [3]. In a case where initial phase of drying is observable, it is very easy to determined the (CDRP) usually represented by (dX/dt)0. However, almost all research studies [3-7] have supposed that during drying of agricultural products there is no significant constant drying-rate period. It is sometimes stated that a PCDR can only be found when the measurements are performed using low accuracy, the fact being that a phase of slowly decreasing rate holds. However, this seems to miss the initial point too [8].The literature revealed many methods for determination of the CDRP; the following methods proved their efficiency:Correlation method: According to the theory of drying [9], CDRP is expressed as function the external parameters [10] in which the water is taken up, and the expression of CDRP has the following form [2]: | (6) |
Where S0 is the initial surface area of dried product, h0 is air-product heat-transfer coefficient, ms is the weight of dry product, Lv is the latent heat of water vaporization at product surface temperature, ΔT0 = (Ts-Th), represents the difference between dry and wet bulb temperature.Usually, it is also assumed that the resistance to mass transfer is completely in the boundary layer relative to the surrounding air [8]. Thus, | (7) |
Where Y∞: humidity of bulk of airY0: humidity at surface of drying mediumh0: Overall transport coefficientDirect method:It is based on representing experimental date using drying rate time or Krisher’s curve; (-dX/dt)0 as a function of the moisture content of the product (X) or time (t), as shown in Figure 1.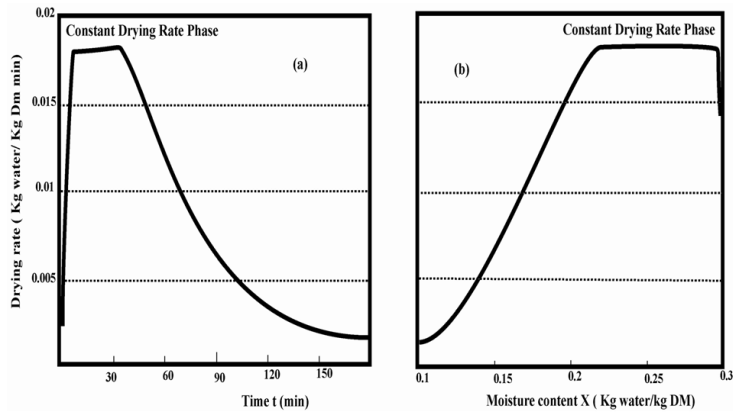 | Figure 1. Determination of the different phases during drying using (a) Drying rate vs. time, (b) Krisher’s curve [11] |
This method assumes CDRP is the maximum value of reached by (dX/dt)0, in this lap the moisture content of the product is greater or equal to the critical moisture content. In fact, for biological products (which undergo deformations and drying shrinkage); any of the two methods listed is really satisfactory.This paper describes two prediction methods based on the experimental data are developed to quantify the CDRP of some medicinal and aromatic plants.
2. Materials and Methods
2.1. The Experimental Facility
Forced convection drying of thin layers of some aromatic and medicinal plants is performed using a laboratory hot air dryer. The main part of dryer system (see Figure 2) consists of an adjustable centrifugal blower (type NICOTRA GEBHARDT) dotted with a maximum flow rate of 3800 m3 h-1, and an auxiliary heating system (finned heating element 4kW and 240V). Air temperature and relative humidity are registered through a digital thermo-hygrometer (Omega, model RH412) PT100A and humidity probes placed at the entrance of the dryer chamber to adjust the drying temperature with an accuracy of ±0.1°C. The drying chamber holds one 50 x 50 cm trays. The wall cavity is insulated with polystyrene insulation of 40 mm thick. Drying air is supplied across a rectangular duct section (20 x 20 mm) and oriented horizontally to the samples. Using a Vane probe anemometer type AN-4090, Inverter controlled blower motors provide adjustability of the velocity of the air with an accuracy of ±0.1 m/s. The dried samples are weighted using an electronic balance having accuracy ±0.01 g and maximum capacity of 2 kg (Guangdong (Mainland), China). The initial weights of the samples are around 50g. Multiple measurements are done by application of different scenarios by the combination of several conditions of relative humidity, air temperature and air velocity. Multiple measurements are done by application of different scenarios by the combination of several conditions of air temperature, relative humidity, and air velocity. Drying tests are performed for the following operational conditions (Table 1):| Table 1. Air drying conditions |
| | Temperature Ts (°C) | Relative humidity RH (%) | Air drying velocity V (m/s) | | 30,40 and 50 | 20-60 | 0.5, 1 and 1.5 |
|
|
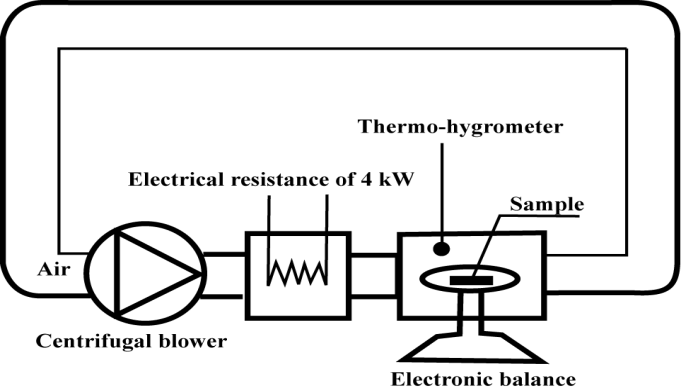 | Figure 2. Scheme of the hot-air dryer |
During the drying process, experiments are running until reaching the moisture content of 0.18 and 0.09 kg water per kg dry matter of spearmint and bay leaves respectively. Before the start of any experiments, the drying system is pre-heated until reaching the steady-state condition. Experiments are replicated three times. To determine the CDRP (-dX/dt)0 under different drying condition. The experimental curves of moisture content versus drying time are plotted using the OriginPro 8 software and calculates the derivative at point X=X0 (initial moisture content) and corresponds to the initial drying period (t=0), by extrapolation with the slopes between the point and its neighbours.
2.2. Material Preparation and Drying Conditions
The fresh plants of spearmint and bay leaves used in this study are stored in a refrigerator under +5°C, until it is use.Generally, samples with uniform size are selected. Leaves and stems were manually separated from the samples. The initial moisture content of the spearmint and bay leaves is determined by the oven drying method. About 50 g fresh sample of each product is placed in a pre-weighed box and was weighed again accurately to give the exact weight of sample. It was kept in hot air oven maintained at 105±1°C until the variations between two weighing intervals mass were within 0.05g. At least five replicates of each experiment are measured. The fresh spearmint and bay leaves used in this investigation have 2.2 and 0.96 kg of water per kg of dry matter respectively.
2.3. Mathematical Fitting of the CDRP
During the CDRP, the course of the process is archived by the external conditions in which the water is taken up and using the analogy between heat and mass transfer across the boundary layer of a completely wetted surface. The rate of drying is determined by the relationship between the drying air velocity and difference between the dry-bulb temperature and wet-bulb temperature established by Fornell [3, 12].  | (8) |
Where X is the moisture content at any time t (kg water per kg dry matter), Ta is the drying air temperature, Th is the dry-bulb temperature, V is the drying air velocity, and ξ and γ are the coefficients characterizing the product.We proceed to fit the experimental data to a mathematical function given by equation (6) and analyzing the accuracy of the fit. Two criteria are used to determine best fit are correlation coefficient (R2), and fit standard error (FitStdErr). (R2) and FitStdErr are calculated using the following equations: | (9) |
 | (10) |
Where yi is the ith experimental CDRP, and  is the ith predicted CDRP and n is the number observations.
2.4. Neural Network Fitting
To achieve the best prediction using a neural network, several different architectures and procedures are evaluated and trained using the experimental data. Different training algorithms were also tested and finally Levenberg- Marquardt is selected. There are two inputs and output parameters in the experimental tests. The two input variables are air velocity (m/s) Ts-Th (K). The one output (-dX/dt)0 (kg water per kg dm). Therefore the input layer consisted of 2 neurons and the output layer had 1 neuron (Figure 3). The best prediction is obtained using a neural network with three hidden layers. Figure 2 shows the configuration of multilayer neural network for predicting CDRP. Various networks with several functions and topologies were examined. Optimum topologies are defined based on the highest R2 and lower fit standard error (FitStdErr) values. The complexity and size of the network is important. Thus the smaller ANN has the priority to be selected [13]. The required codes are developed using MATLAB 2007.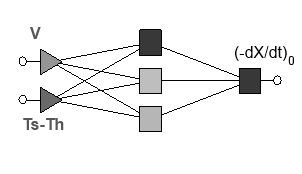 | Figure 3. Configuration of multilayer neural network for predicting (-dx/dt)0 (CDRP) |
Comparison of mathematical fitting and neural network fitting, these methods with the smallest fit standard error (FitStdErr) and the highest value of correlation coefficient (R2) is the best fit for the experimental data. The comparison of statistical results obtained is displayed in Table 2.
3. Results and Discussion
3.1. Experimental CDRP Curves
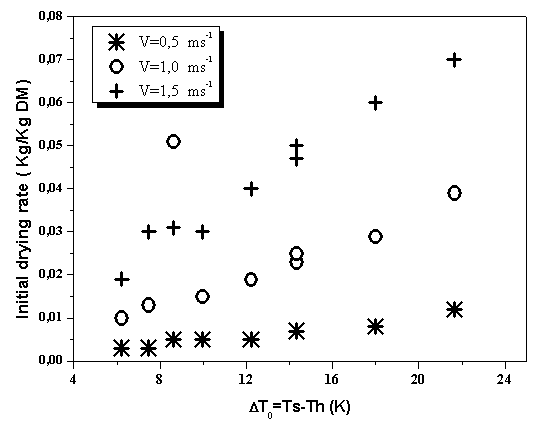
Figure 4 and 5 show CDRP versus difference between the dry-bulb temperature and wet-bulb temperature at constant air velocity of spearmint and bay leaves respectively. It is evident that at high air velocity levels the difference between CDRP is lowest compared to low ΔT. CDRP at 1.5 m/s vary considerably with ΔT. in fact for the experiments performed at 0.5 m/s, the drying rate during initial drying period remains constant with ΔT. In other words, during CDRP, the effect of air velocity compared with ΔT is significant in the CDRP. The drying rate of the initial phase of spearmint leaves is significantly superior to the bay leaves and this is probably due to the physic-chemical properties of the product.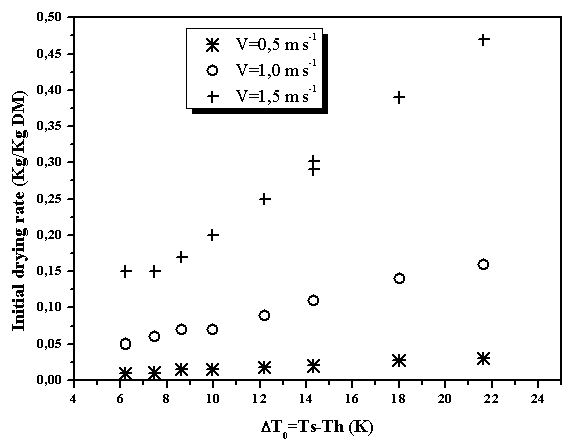 | Figure 4. CDRP versus ΔT at different air velocities of spearmint leaves |
 | Figure 5. CDRP versus ΔT at different air velocities of bay leaves |
3.2. Best Fit Equations of CDRP
To fit such an expression for the relationship between the two variables (V, ΔT) to experimental data we use the Fornell equation, consequently, the following equations are obtained for thin-layer drying of spearmint and bay leaves respectively. The optimal surface fitting, as shown in Figures 6-7, describe the experimental data to the equation 8 and find the values of the constants ξ and γ associated with this expression.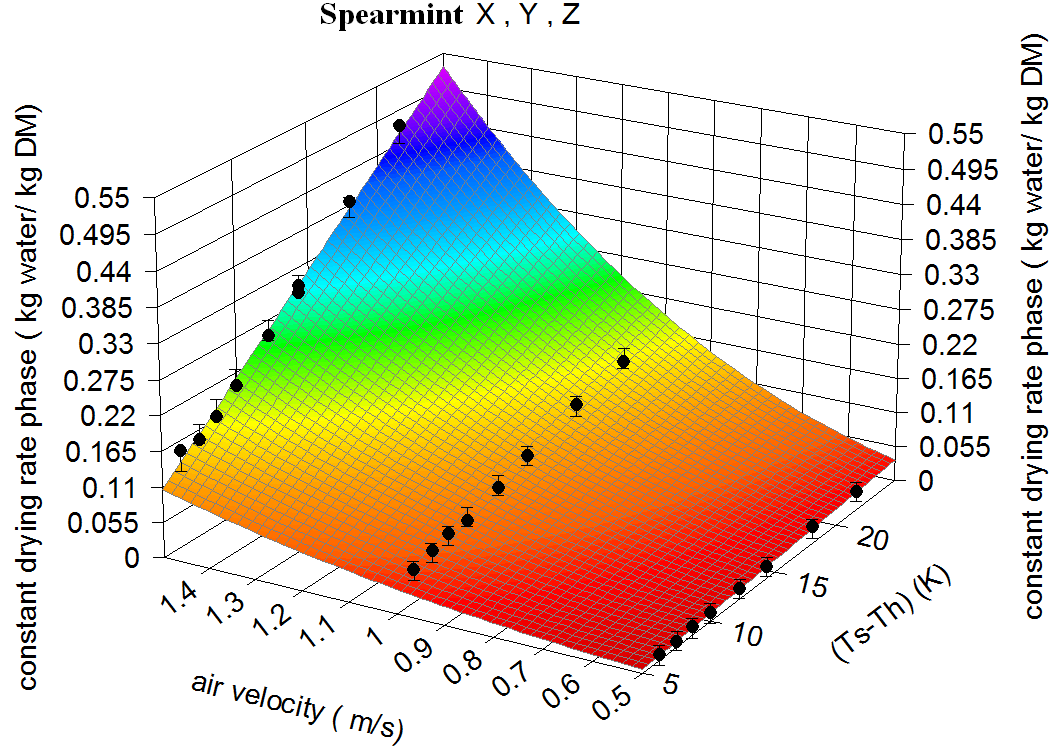 | Figure 6. Predicted CDRP versus ΔT and air velocity of spearmint leaves |
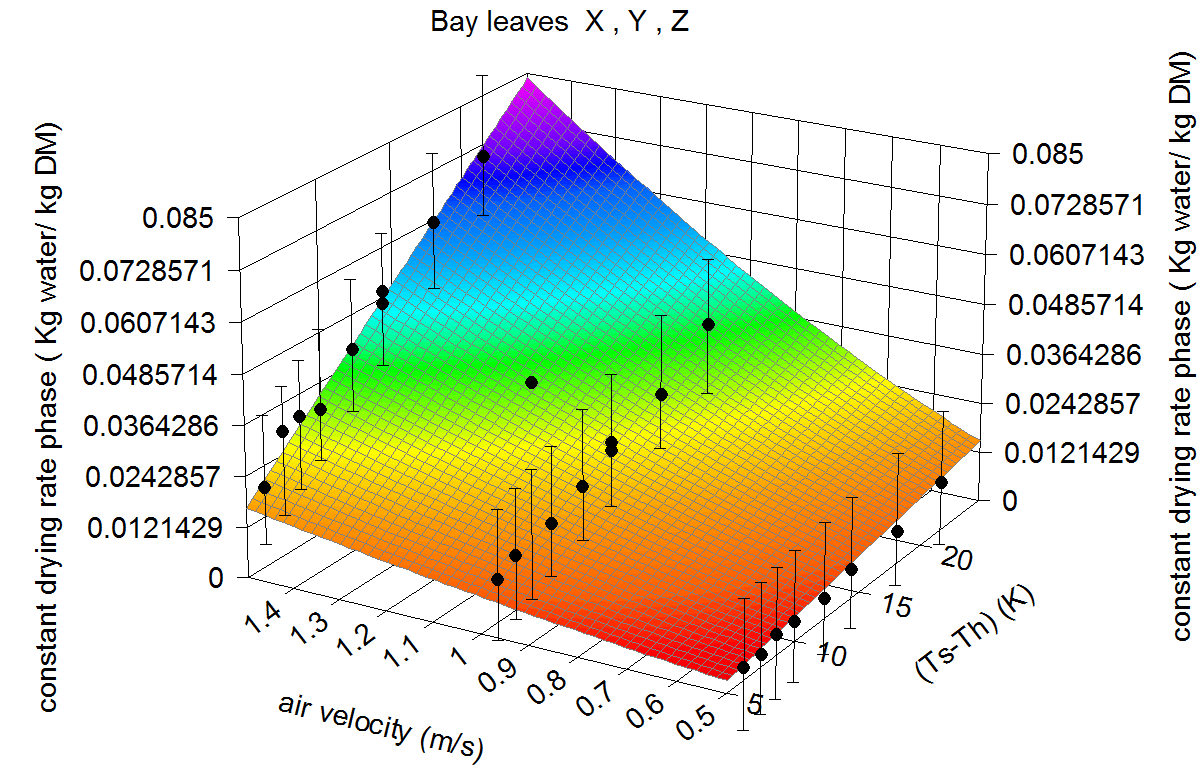 | Figure 7. Predicted CDRP versus ΔT and air velocity of bay leaves |
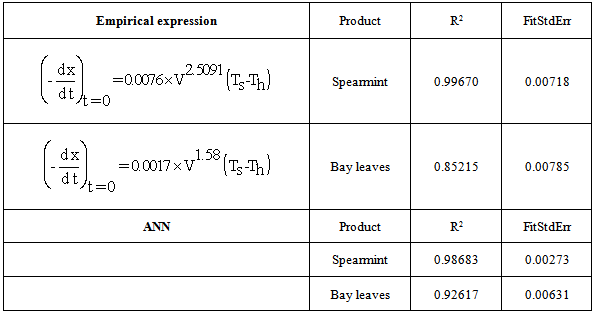
Results achieved in respect of CDRP are analyzed with the computer software Table Curve 3D v 4.0; the best equation for each product is selected on the determination coefficient (R2) and the standard error of estimation (FitStdErr) (Table 2). Table 2. Empirical regression of CDRP and statistical parameters of empirical and ANN approach
 |
| |
|
3.3. Results of Artificial Neural Network Approach
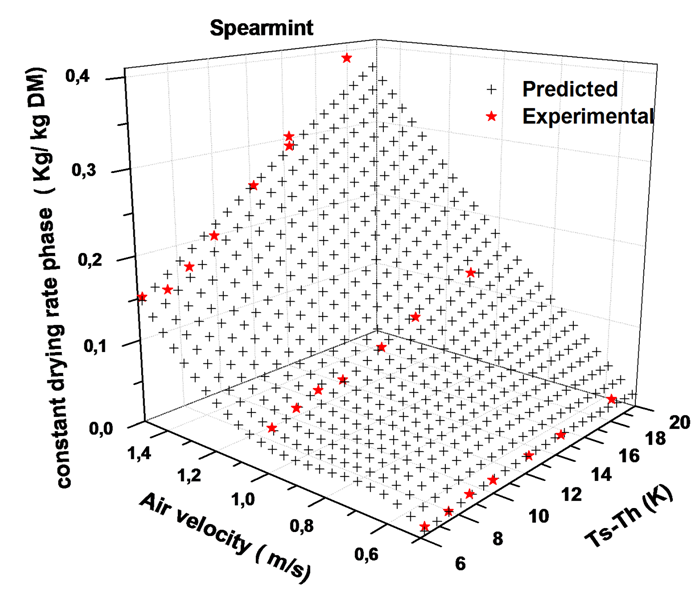
An artificial neural network (ANN) was developed based on the experimental work. Results showed that levenberg- Marquardt algorithm was well suited for prediction of CDRP based on different air velocity and ΔT levels. Predicted versus experimental values for the CDRP are indicated in Figures 8 and 9. As it can be seen, all the investigated prediction models simulate the experiments satisfactorily for CDRP of spearmint and bay leaves respectively. The developed network had a good generalization in predicting the quality of the mushroom slice from the drying rate [13]. Thus, this network model could be used to determine the CDRP of the aromatic and medicinal plants under the drying conditions. Figure 8 and 9 represents the CDRP prediction (-dX/dt)0 where the values supplied by it with experimental values calculated are compared. The fit standard error (FitStdErr) between the values is smaller than 0.007 and the correlation coefficient (R2) is greater than 0.9261 as they are presented in the table 1.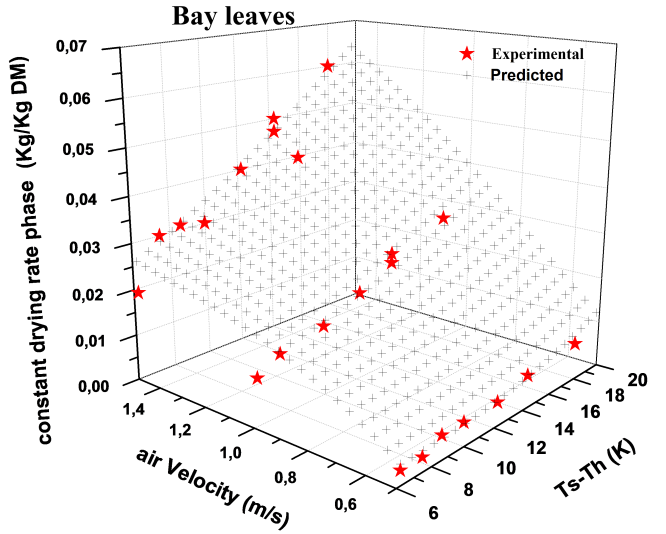 | Figure 8. ANN predicted and experimental CDRP vs. ΔT and air velocity of spearmint |
 | Figure 9. ANN predicted and experimental CDRP vs. ΔT0 and air velocity of bay leaves |
4. Conclusions
The expression of the CDRP is determined empirically from the experimental data. These correlations presented by expressions of the CDRP depending on external drying conditions namely the air velocity and difference between the dry-bulb and wet-bulb temperature. The expression gives reasonable agreement between predicted and experimental results for the drying of spearmint and bay leaves during initial phase drying. The final selected model, 2-3-0-1 (2 neurons in input layer, 3 neuron in hidden layer and 1 neurons in output layer), successfully learned the relationship between input and output parameters. The ANN results are quite satisfactory in a way that R2 values are close to one, while standard errors (FitStdErr) are found to be very low. The determination coefficient is generally the best indicator of the fit quality; we found that the method of neural network is better predicting CDRP as the regression of bay leaves. Compared with the effect of the difference between the dry-bulb and wet-bulb temperature, the effect of air velocity is significant during determination of CDRP for fresh spearmint and bay leaves. On the other hand, by increasing air velocity at constant of difference between the dry-bulb temperature and wet-bulb temperature, the CDRP increased.
References
| [1] | C.AHOUANNOU, Y.JANNOT, B.LIPS, A.LALLEMAND, Caractéristique et modélisation du séchage de trios produits tropicaux: manioc, gingembre et gombo, science Aliments, vol.20(45), pp.413.432, 2000. |
| [2] | Belghit , M. Kouhila, B. C. Boutaleb, Experimental Study of Drying Kinetics of Sage in a Drying Tunnel Working in Forced Convection, Rev. Energ. Ren. Vol.2 pp.17-26,1999. |
| [3] | A. Fornell, Séchage de produits biologiques par l'air chaud, Doct. Ing. thesis, E.N.S.I.A. Massy, 1979. |
| [4] | H. Desmorieux and C. Moyne, Analysis of dryers performance for tropical foodstuffs using characteristic drying curve concept, In Drying 92, ed. A.S. Mujumder, Amsterdam, Elsevier., pp.834-843, 1992. |
| [5] | R.S Rapusas and R.H Driscoll, The thin layer drying characteristics of white onion slices, Drying Technol, vol.13, pp.1905-1931, 1995. |
| [6] | P.J Fosto and D. Lecompte, Convective drying of cacao beans; drying curves for variuos external conditions, IDS-94, in: Drying 94, Gold Coast, Australia, vol.B, pp.937-944, 1994. |
| [7] | C. Ahouannou, Y. Jannot, B. Lips and A. Lallemand, caractérisation et modélisation du séchage de trois produits tropicaux: maniov, gingembre et gombo, sci. Aliments, vol.20, pp.4-5, 2000. |
| [8] | J. Van Brakel, Advances in drying, hemisphere Publ Corp. Washington Dc, chapter seven, mass transfer in convective drying, pp.0272-4790, 1980. |
| [9] | S. Pabis, Theory of Convective Drying Agricultural Crops (in Polish). Panstwowe Wydawnictwo Rolnicze i Lesene, Warszawa, 1982. |
| [10] | J.C.F. Walker, B.G. Butterfield, T.A.G. Langrish,, J.M. Harris and J.M. Uprichard, Primary Wood Processing, Chapman and Hall, London. 595 p, 1993. |
| [11] | Ian.C. Kemp, B.C Fyhr, S. Laurent, M.A. Roques, C.E. Groenewold, E. Tsotsas, A. Sereno, C.B. Bonazzi, J.J Bimbenet and M. Kind, Methods for processing experimental drying kinetics data, Drying technology, vol.19(1),pp15-34, 2001. |
| [12] | M. Kouhila , A. Belghit, M. Kaoua et M. Daguenet Etude Expérimentale du Séchage Convectif de la Menthe dans un Séchoir Modulaire Polyvalent à Chauffage partiellement Solaire, Rev. Energ. Ren. : Physique Energétique, pp. 1 – 5, 1998. |
| [13] | A. Ghaderi, S. Abbasi, A. Motevali, S. Minaei, comparison of mathematical models and artificial neural networks for prediction of drying kinetics of mushroom in microwave – vacuum drier, Chemical Industry & Chemical Engineering Quarterly ,vol.18 (2), pp.283−293, 2012. |
 Abstract
 Reference
 Full-Text PDF
 Full-text HTML