-
Paper Information
- Previous Paper
- Paper Submission
-
Journal Information
- About This Journal
- Editorial Board
- Current Issue
- Archive
- Author Guidelines
- Contact Us
International Journal of Brain and Cognitive Sciences
p-ISSN: 2163-1840 e-ISSN: 2163-1867
2012; 1(4): 30-38
doi: 10.5923/j.ijbcs.20120104.02
Judging the Center of Human Figures: Evidence for Dynamic Perception
 Abstract
 Reference
 Full-Text PDF
 Full-Text HTML
Jay Friedenberg 1, Tedd Keating 2, Bruce Liby 3
1Manhattan College Department of Psychology Riverdale, NY 10471, United States
2Manhattan College Department of Physical EducationRiverdale, NY 10471, United States
3Manhattan College Department of Physics Riverdale, NY 10471, United States
Correspondence to: Jay Friedenberg , Manhattan College Department of Psychology Riverdale, NY 10471, United States.
| Email: |  |
Copyright © 2012 Scientific & Academic Publishing. All Rights Reserved.
In our first experiment we presented outlines of human figures in various poses to a group of undergraduate psychology majors. We asked them to indicate where the perceived centers of the figures were by placing a small dot. The stimuli fell into two major categories. The first group was symmetric, with both arms held in equivalent positions on both sides of the body. The second group was asymmetric where an arm or an arm and a leg were extended to either side at different angles. We calculated accuracy, measured as the distance between the true and the perceived center of mass, as well as orientation, measured as the direction of the response distribution. Accuracy was best in the symmetric conditions where responses were aligned vertically along the body midline. In the asymmetric cases accuracy was lower and responses were shifted in the direction opposite the limb extensions. This occurred even though the true center was always shifted in the same direction as these extensions. The results are replicated in a second experiment with physical education majors who were trained on the concept of center of mass and who had already had experience calculating it. The data support the notion that observers infer where the centers should be in order to rebalance the figure. They anticipate the future motion of the figures in unbalanced poses rather than treat them as static forms. We discuss these results as examples of agency and dynamical perception.
Keywords: Center Of Mass, Centroid, Agency, Implied Motion, Dynamic Perception, Human Figures, Balance
Cite this paper: Jay Friedenberg , Tedd Keating , Bruce Liby , "Judging the Center of Human Figures: Evidence for Dynamic Perception", International Journal of Brain and Cognitive Sciences, Vol. 1 No. 4, 2012, pp. 30-38. doi: 10.5923/j.ijbcs.20120104.02.
Article Outline
1. Experiment 1
1.1. Introduction
- There are a number of terms in physics used to describe the center of an object or objects[1]. The terms centroid and center of gravity describe the point about which an object’s mass is equally distributed. For two-dimensional figures it is the location for which the sum of all distances to each point in the shape is minimal. It can be determined by averaging across the object’s x- and y-coordinates[2]. If the points on the object have equal mass then the term center of mass can be used. As this was the case for the figures in our study, we use this term.Estimating an object’s center is useful in a number of situations. A reference frame may be positioned at an object center to enable pattern recognition[3]. A center of mass can be used to determine the relative location of shapes or other elements[4]. It seems to also allow an observer to keep track of moving objects. Researchers[5] have found that observers fixate upon the center of mass of a group of moving dots during a multiple object-tracking task. Grasping an object at a center additionally allows for a good grip and better manipulation and may guide reaching[6].Most studies of center of mass estimation have used simple constructed shapes such as amoeboid, ovals, triangle’s squares and circles[7]. Other examples include Gaussian blobs, Gabor and texture patches[8]. The current authors have used different numbers of black-filled dots in various configurations[9]. The advantage of using such shapes is that one can maintain tight control over the stimulus, systematically varying different properties like orientation, symmetry and elongation. However, the downside of such figures is that they lack ecological validity. It would be rare to encounter examples of such stimuli in real world environments. Typically the objects we perceive and interact with on an everyday basis are much more complex.It is for this reason that we employ human figures in the current study. Human figures are of reasonable complexity. They contain multiple parts such as arms and legs. These parts are related to each other in specific but variable ways. For instance, hands are connected to arms at a wrist, but the hand can still move. It can translate left and right, up and down, and rotate about an axis. We have also had lots of experience seeing and interacting with such objects and this experience guides our expectation about how they will move.Another important property of biological shapes like human figures is that they are capable of internally generated motion. A square for instance is not usually expected to jump up and down or spin around. A human figure though is fully capable of many different types of movement. When we see a person we thus have preconceptions about the kinds of ways they can move. If a person is standing on one leg we may expect them to fall in a particular direction. If they have raised an arm, we may expect them to lower it. When perceiving familiar animate shapes we may perceive them not as static forms, “frozen” in time, but as dynamic bodies caught in the process of motion.In the current study these two views of perception lead to two very different predictions. If participants perceive human figures as static, then the perceived center of mass in a figure should shift in the direction of a limb extension. If for instance the left arm is held out from the body, the arm’s mass will move the true body’s center a bit closer to it. This would then be a case of veridical perception, as observers would be tracking the real change in the shape’s center accurately.Alternatively, if human figures are viewed as dynamical, then participants may judge the center to be shifted in a direction opposite the limb extension. The perceived center would then correspond to where the centershould be if it were to balance the figure. Judging centers this way implies that an observer is anticipating where the figure will be at a future point in time. As such it qualifies as an instance of inferred motion, but one where the motion is extrapolated based on a still figure rather than on actual moving shapes.
1.2. Method
1.2.1. Participants
- Thirty-one undergraduate psychology majors at Manhattan College participated for extra course credit. There were five males and 26 females. All were naïve to the concept of center of mass. Vision was either normal or corrected to normal.
1.2.2. Stimuli
- A male and female undergraduate research assistant volunteered to model the poses. Both models were of average height and weight for their age and posed for each of the conditions in front of a blank wall. Each human model wore tight fitting and minimal clothing, i.e., shorts and a t-shirt. Each did so with the knowledge that the outline of their figure might be published. All personal identifying information was removed by eliminating internal details such as clothes and facial features. The figures in their final form consisted solely of a contour line showing the outside edge of the model’s body. Figure 1 shows examples of these figures in several poses.
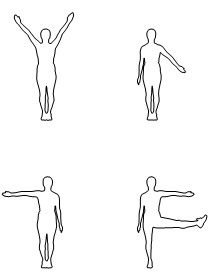 | Figure 1. Examples of figures from four posing conditions. The top left figure is UA-UA-D-D, where UA stands for Up Across (diagonally up) for the left arm, Up Across (diagonally up) for the right arm, D (down) for the left leg and D (down) for the right leg. A similar nomenclature is used for the remaining figure. See Figure 2 for details |
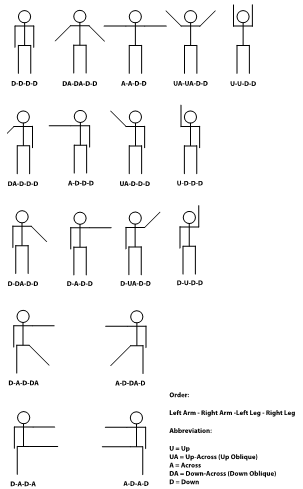 | Figure 2. Iconic representations for each posing condition along with the abbreviations designating their labels |
1.2.3. Procedure
- Digital photos were taken of the models and these were then used to generate the outlines. Figures were printed onto standard size (8.5” X 11” inches) white paper viewed at a landscape orientation. We presented each figure centered at one of the four quadrants of a page. They occupied about eight degrees of visual angle seen at a typical reading distance.Research assistants presented each participant with a paper-and-pencil experiment packet.They were asked tomake their judgements one page at a time. Observers were instructed to view the pages so that they were aligned parallel to their head and body, i.e., so that they were not tilted on the desk in front of them. They were also asked to view the pages from a uniform distance of about 45centimeters, but as these were free-field viewing conditions there was undoubtedly some variance across individuals.Each of the 18 different poses described above was presented in both a male and a female version, resulting in 36 unique figures. Participants viewed these 36 figures in random order within a block of trials. There were three blocks in an experimental session resulting in 108 total figures. There were no breaks or blank pages between blocks and participants could rest at whatever time they wished. Testing was done in a college classroom with all the undergraduate students responding simultaneously. No time limits were imposed and no reaction times were recorded. Completion time averaged about 20 minutes.Observers were asked to judge the centers by drawing a small dot using a pencil. The center was defined as “the position about which the rest of the body is equally distributed”. No mention was made of whether the dot should be placed inside or outside the figure.In their final format each human figure was depicted as a black outline on a white background. The interior of each figure was white. Four figures were presented per page yielding 27 stimulus pages. An experiment packet consisted of these 27 pages plus a consent and instruction form at the beginning and a participant information form and debrief at the end. An entire packet was 31-pages long.
1.3. Results
- Pose with each of the different limb directions was the independent variable. Distance and Direction were the two dependent variables. Distance was the distance between the actual and judged center of mass.It is a measure of accuracy. The unit of measure is centimeters. Direction was the orientation of the response distribution and is measured in degrees. We analyze and discuss each of these separately in the sections that follow.Two research assistants calculated distance manually using a ruler. They worked independently of each other and then compared their work for any discrepancies. Direction values were measured using a protractor and then subject to validation in the same way.
1.3.1. Distance Measure
- Responses greater than three standard deviations above the mean were considered outliers and deleted. They constituted less than one percent of the data. An initial analysis showed that estimates for the crouch condition were very accurate and symmetric with respect to direction about the true center, so this condition was removed from the analysis. The distance measure had a slight negative skew but was close enough to a normal distribution with a skew of zero that the data were not transformed or otherwise manipulated.A one-way analysis of variance (ANOVA) with Pose as the factor was significant (F 1,16 = 16.1, p <.01). Figure 3 shows mean distance values with standard errors for each of the 17 conditions of the Pose variable. Within the asymmetric poses errors were lower for the one arm conditions (M = .49 SE = .01) than for the arm and leg together conditions (M = .55, SE = .01). Two limbs naturally skew the center away from the body midline, so it follows that errors would increase with the number of extended limbs.All possible pair-wise comparisons were performed for each pose condition using a Tukey-Kramer post-hoc test. The minimum mean difference for significance at p = .01 was 0.12. By this standard none of the symmetric poses differed from each other. These results are not surprising. Center of mass estimation is usually better for symmetric objects, probably because the center lies along the object’s midline and is equidistant from both sides[11].Pooled ANOVAs were calculated to examine differences between groups of pose conditions. These tests revealed that symmetric conditions (M =.34, SE = .01 ) were more accurate than asymmetric ones(M = .51, SE = .01), F(1,60) = 188, p < .01. Poses in which limbs were extended to the left were also more accurate then poses in which limbs were extended to the right, F(1, 60) = 143, p < .01.A grouped limb direction variable that separated responses into different categories based on laterality was significant, F(4, 150) = 57.4, p < .01. Post hoc tests for this variable revealed better accuracy when an arm and a leg were to the left (M = .50, SE = .02) than when an arm and a leg were to the right (M = .58, SE = .01). Responses were also more accurate when an arm by itself was to the left (M = .46, SE = .01) than when it was to the right (M = .52, SE = .01). This left-side effect may be due to better right hemisphere dominance in the control of emotional expression[12].All of these “unbalanced” configurations were less accurate when compared to “balanced” poses in which limbs pointed in both directions.
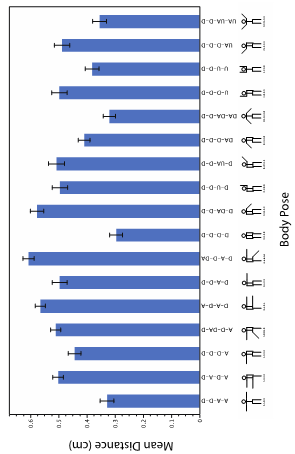 | Figure 3. Errors for each posing condition measured as mean distance between actual and estimated center of mass. Bars indicate one standard error of the mean |
1.3.2. Direction Measure
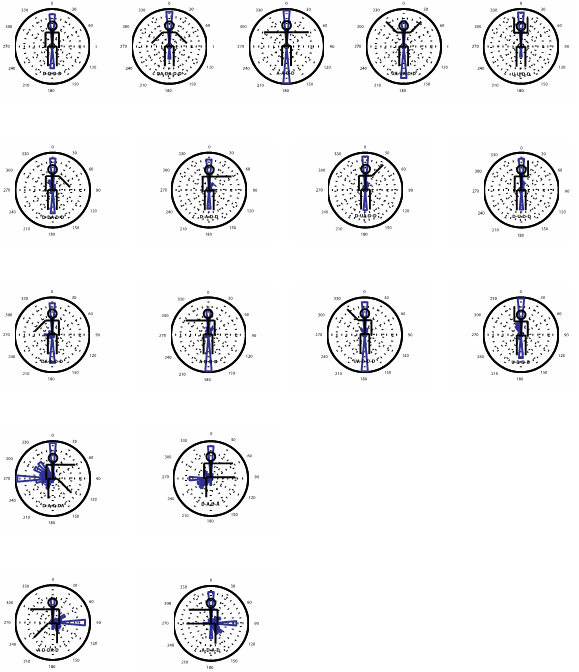
- Error data only tell us how difficult a task is. They do not say much about how a particular task may be performed. For that reason we additionally measured the direction of participant’s responses. This was calculated as the orientation of a line starting at the true center of mass and terminating at the estimated center. Figure 4 shows the response distribution of the direction variable, depicted as a radial histogram superimposed on top of the icons representing each Pose condition. As much of this data is bimodal, we do not calculate statistics or statistical tests. The direction data by themselves provide a powerful qualitative set of results that inform us about how the task is being performed.For the symmetric poses, the distribution of responses is oriented either up at near zero degrees or down near 180 degrees. These are the D-D-D-D, DA-DA-D-D, A-A-D-D, UA-UA-D-D and U-U-D-D conditions. This suggests that observers are placing their responses along the bilateral symmetry axis that runs vertically through the middle of each of the figures in these conditions. An upwards direction was always more frequent than a downward one. Direction did not track movement of the arms. If this were the case we would see a gradual increase in upwards responding as the limbs were extended upwards. These data may therefore reflect a response bias rather than a stimulus driven response.We next turn to the asymmetric responses with one arm. These are the D-DA-D-D, D-A-D-D, D-UA-D-D,D-U-D-D, DA-D-D-D, A-D-D-D, UA-D-D-D and U-D-D-D conditions. An upward and downward trend was present here as well. However, in addition to this responses were oriented away from the extended arm. For the D-DA-D-D condition, the arm is extended at 135 degrees and some of the responses are oriented near 270 degrees. For the D-UA-D-D case, the arm is raised at 45 degrees and a cluster of responses is oriented at 225 degrees in the opposite direction. However, there are also conditions where the reverse is seen and responses are now oriented toward the arm extension. This is seen in DA-D-D-D, where the left arm is pointed at 225 degrees and the responses center at about that same orientation. The responses in these conditions suggest that three factors are at work: an upward-downward bias, and a tendency to respond either toward or away from the direction of the limb extension.
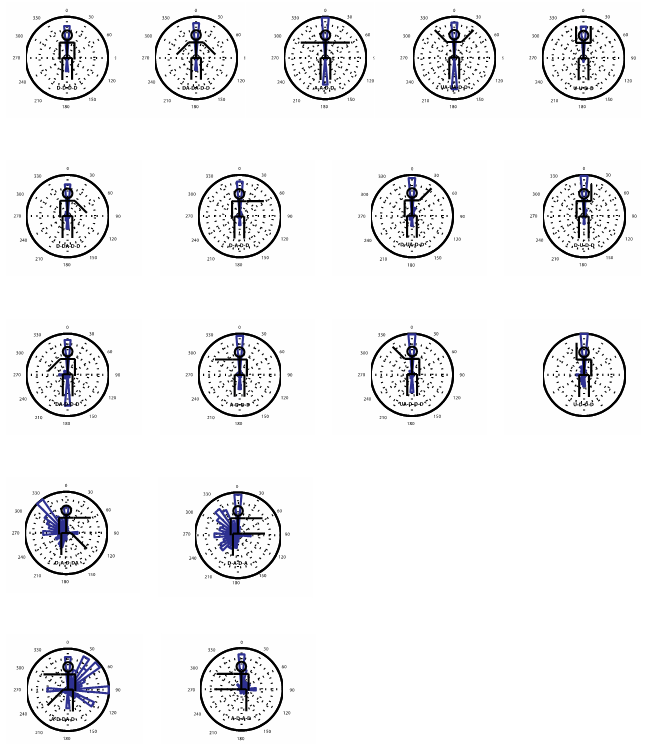 | Figure 4. The distribution of response orientation for each posing condition in Experiment 1 with undergraduate psychology majors. Radial histograms show the direction and frequency of the responses. Direction is measured as angular orientation around each circle. Frequency is the length of bars with the origin at each circle’s center |
1.4. Discussion
- The results from the direction data demonstrate that there are three forces at work influencing how observers judge the center of human figures. The first is symmetry, which produces an upwards/downwards response bias along the midline bisecting the figure. This is the primary finding for the symmetric cases in which limbs are extended equally in opposite directions. The second is a veridical center of mass effect, in which observers judge the body center as having shifted toward a limb extension. This is seen primarily in the single arm conditions. The third finding is when participant’s responses are aligned in a direction opposite that of a single or dual limb extension and is found primarily in those cases.In the symmetric conditions there are no limb extensions. In these cases the body is aligned with a vertical or gravitational axis. It makes sense that in such situations we estimate the center using this axis, especially because the true center of mass is aligned along it. Observers in effect can reduce the amount of lateral error in their response by constraining their estimate to fall along this line.In the case of the asymmetric conditions with one arm extended, we see much greater variability in the data. There is still a tendency to respond upwards or downwards in these cases, but there is also a trend for responses to fall either toward the arm extension or away from it. Judgments toward the extension are easily interpreted. The true center of mass always shifts toward any limb extension as the limb itself has mass. So observers who shift their responding toward the arm are accurately tracking the change in mass distribution that occurs during human movement. This is what we would expect if observers were accurate in their perception and is in fact what we had initially predicted would happen.Why then, is there a shift away from limb extension? If you stick your leg out to the left, it should be perceptually obvious that you are going to lean or fall down in that direction. What observers seem to be doing in such situations is judging not where the center of mass is shifted but where the center of mass should be in order to maintain stability. If you lean left you would need to compensate by shifting right in order to stay upright. If you lean right, a corresponding leftward movement is necessary to prevent falling. We should note that this effect is even more pronounced in the two limb cases in which the majority of the responses were in the opposing direction. If both an arm and a leg are extended in the same direction, then an even larger compensation is needed to maintain balance.The data support a dynamical view of perception. Our participants did not adopt a static or “snapshot” approach based solely on the appearance of the presented figure. They instead seemed to anticipate or predict the figure’s future movement. Inherent in this judgment is an interpretation of stability. In the symmetric case, the figures are stable and no correction is necessary. The non-symmetric cases are unstable and seem to trigger an anticipated motion response. Human center estimation reflects the observer’s view of where the center should be to keep the figure upright, not where it is at the current moment.
2. Experiment 2
- In previous work we have found performance differences between groups of students on the center of mass task. In each of these cases the stimuli consisted of black-filled dots of different sizes presented at different distances. The observers were asked to place a small mark to indicate the location of the perceived center. Physics students who had been instructed on the center of mass concept were more accurate than a group of naïve students[13]. In another study, we found that students with additional training on the task, in this instance by viewing a 15-minute video clip on the concept, were slightly more accurate[14].In this experiment we set out to determine whether training affects estimation for human figures. We chose a new group of observers, students in the department of physical education who had all taken a course in which center of mass was explained. As part of that course, the students were additionally required to calculate the center of a human figure by hand, using a ruler and a calculator. We might expect that this group, with greater knowledge of the concept, would be less likely to succumb to the opposing limb effect. If this were the case accuracy should be greater for this group of students compared to those in experiment 1. We would also expect the direction of responses for trained observers to point toward the limb extension rather than away from it.
2.1. Method
2.1.1. Participants
- There were 22 participants total, 12 females and 10 males. All were undergraduate students majoring in physical education at Manhattan College. They had all taken a course where they learned what a center of mass was and had calculated it for a human figure by hand using a ruler and a calculator.The method they used was identical to the procedure employed to measure the true center in the previous experiment. Student’s vision was normal or corrected to normal. They participated in order to gain extra course credit.All of the participants in this study received the same amount of center or mass training. However, we wanted to assess how familiar they thought they were with the concept. To this end, we asked them to report their self-perceived amount of training. They did this by indication whether they had received none, some, or a lot of training.
2.1.2. Stimulli
- Stimuli were identical to those employed in Experiment 1. At the end of the session, participants were asked to complete a short set of questions.
2.1.3. Procedure
- The procedure was also identical to that of the first experiment.
2.2. Results and Discussion
 | Figure 5. Response orientation results for Experiment 2 with undergraduate physical education majors. The radial histograms depict the direction and frequency of the responses |
2.2.1. Distance Measure
- The distance data was approximately distributed as a normal distribution, with a slight negative skew. Students who reported a lot of training did significantly better at the task than those who had either some or no training. These results are interesting. Although all participants had the same amount of training, only those with a self-perceived familiarity with the concept did better. One can assume that these students were more interested in the topic and therefore understood it better.A one factor ANOVA for distance with Pose as the independent variable was significant (F 1,16 = 62.6, p < .01).Post-hoc Tukey-Kramer tests showed a minimum statistically significant difference of 0.17 for pair-wise means. The D-D-D-D condition was more accurate than the A-A-D-D and the U-U-D-D cases suggesting that the all limbs down pose is more natural and one that we are more familiar with. This familiarity may explain why it was the most accurate condition in both experiments.As was the case as in the first experiment, the symmetric figure conditions overall had the lowest errors (M = .41, SE = .02) compared to the asymmetric conditions (M = 0.53, SE = .02), as revealed by a pooled group ANOVA, F(1,42) = 47.8, p < .01. Errors were also lower for the one arm conditions (M = .52 SE = .02) than for the arm and leg together conditions (M = .60, SE = .02).An ANOVA coding for limb direction revealed the same left-side advantage effect from experiment 1, F(4,84) = 16.3, p < .01.Participants were better able to judge centers when a single arm was held out to the left (M = .50, SE = .02) compared to when it was held out to the right (M = .53, SE = .02). This was also true for the two limb cases where accuracy was better when the arm and leg were both held out to the left (M = .54, SE = .02) compared to the right (M = .62, SE = .02).In this study with physical education majors, males were more accurate overall than females, F(1,42) = 53.4, p < .01, as revealed by a pooled data ANOVA. This difference could not be examined at all in the first study because there were very unequal numbers of each sex. We cannot conclude that this advantage is true only for the physical education majors, since there is no comparable control group against which to judge.
2.2.2. Direction Measure
- Figure 5 shows the distribution of direction responses shown again as radial histograms superimposed upon icons of each pose condition. The results for the physical education students are largely the same as for the psychology students. In the symmetric conditions responses trended up and down along a vertical axis. For the asymmetric one-arm conditions responses were aligned along the vertical and at orientations opposed to the limb extension. This was also true for the arm and leg extension conditions, again demonstrating the “opposing” or balancing effect.In the A-D-D-D and the A-D-A-D condition we see a few responses oriented toward the extended limb. These could be a subset of the physical education students who applied their knowledge to the task. What these results show generally though is that prior training seems to have little influence over center estimation. Students in our group who explicitly understand center of mass concepts and how to compute it failed to apply their knowledge. This runs in contrast to what we have found in our previous work where physics students and participants trained on center of mass concepts demonstrate greater accuracy. Those studies used black dots that don’t seem to have the inferred dynamic properties of a human form.
3. General Discussion
- Our study shows that center estimates of human forms are biased by anticipated motion. In symmetric figures where there is no implied motion to either side, participants are accurate and responses line up along the reflective symmetry axis that bisects the shape. This was the case for several different poses in which the arms were either held downward, angled downward, horizontal, angled upward, or straight up. In these conditions, the limbs are held in corresponding but opposite locations. This balances the figure making it perceptually stable. If the figure is stable then it has little or no inferred motion and there is no need to compensate by moving the center one way or the other to make it balance.We see a very different story for the asymmetric shapes. In these conditions an arm or an arm and a leg are extended to one side only. Observer’s estimates to such figures are now skewed in the direction opposite the extended limb. This pattern of result holds over a number of different body poses in which one arm is down, angled downward, horizontal, angled upward, or vertical. The effect was even stronger when an arm and a leg were both extended in the same direction. This latter effect is to be expected given that two limbs carry more mass than one.This basic pattern of result held for undergraduate psychology students with no formal instruction on center of mass concepts. It was also true for college-level physical education students who had received formal instruction on the concept and had been previously instructed on how to compute centers from a human figure. This latter group of students was seemingly unable to apply what they had learned to the current set of figures. This suggests that the balancing effect we have found here is so powerful that it over-rides prior conceptual knowledge.Due to the number of conditions in this study, the authors have not yet tried another limb extension possibility. This is a condition in which two limbs are extended on one side and a single limb is extended on the other. However, based on the current results we can speculate as to what those results may be like. Imagine a case where a figure has their arm extended at a 45 degree down angle, their right arm extended horizontally, the left leg vertical and their right leg also extended at a 45 degree down angle (DA-A-D-DA in the current coding scheme). In this case the figure is unbalanced, leaning to the right. This should trigger a shift in the perceived center to the left. However, the down angled left limb ought to counter this shift, preventing it from moving too far to the left. It makes sense that an opposing limb used to to maintain balance will also move the perceived center back toward the equilibrium point. We plan to include these conditions in a future study.When judging the center of a dot display, observers take into account the relative mass of two or more objects and place their estimates in accordance with changes in the actual mass distribution. Why then are human figures treated differently? We believe it is because inanimate and animate shapes are perceived in different ways. Inanimate objects such as polygons when presented in isolation are usually incapable of motion unless acted upon by external forces. However, one can create a context in which they might be perceived as moving. For example a ball placed very near the edge of a cliff might cause observers to infer that the ball will roll off of it. Animate objects such as animals or humans on the other hand are perceived as capable of motion even when presented in isolation and in the absence of a biased context. They are considered as agents capable of generating forces internally that can affect either themselves or other nearby objects in the their environment. As a result the perceptual system treats them differently.The perception of animacy has received much attention in recent years. Most of it, however, has been based on actual motion. One author[15] found that animacy ratings of moving particles were affected by many factors including changes in their shape, speed, direction and alignment. It has also been discovered[16] that the human visual system is very sensitive to oriented shapes when they appear to face a moving disc, even when their motion is random. This has been called the “wolfpack effect”. In one study participants reached toward an animate (a robot, yet one that was moving) and an inanimate object (a turtle, one that was not moving) while ERP was recorded[17]. The results showed greater activity in the left infero-frontal region, known to be part of the mirror neuron system that underlies our ability to empathize with others. One study that has looked at perceived animacy of static forms measured motor and premotor neuron activation to pictures of people differing in dynamism and muscular exertion[18]. Activation occurred in these brain areas even to photos in which there was no actual motion present. They refer to the effect as “implicit motion” or “implied motion”. Further research is needed to explore the magnitude of this effect and the factors that govern it.