-
Paper Information
- Next Paper
- Previous Paper
- Paper Submission
-
Journal Information
- About This Journal
- Editorial Board
- Current Issue
- Archive
- Author Guidelines
- Contact Us
American Journal of Biomedical Engineering
p-ISSN: 2163-1050 e-ISSN: 2163-1077
2012; 2(2): 17-22
doi: 10.5923/j.ajbe.20120202.04
A Study of the Potential of EIIP Mapping Method in Exon Prediction Using the Frequency Domain Techniques
 Abstract
 Reference
 Full-Text PDF
 Full-Text HTML
Mai S. Mabrouk
Biomedical Engineering, MUST University, 6 October, Egypt
Correspondence to: Mai S. Mabrouk , Biomedical Engineering, MUST University, 6 October, Egypt.
| Email: |  |
Copyright © 2012 Scientific & Academic Publishing. All Rights Reserved.
Recently, a number of numerical DNA sequence representations have evolved in order to transform the DNA sequence analysis problems from the traditional string processing domain to the discrete signal processing domain. On the other hand, the coding regions (exons) detection problem has received a special attention due to the 3-base periodicity property of exons which can be easily detected using simple discrete signal processing techniques. The 3-base periodicity in the nucleotide arrangement is evidenced as a sharp peak at frequency f =1/3 in the frequency domain power spectrum. In this paper, we exploit the 3-base periodicity property of a set of the Electron-Ion Interaction Pseudopotential (EIIP) coded DNA sequences by employing a frequency domain power spectrum estimation techniques as Short Time Fourier Transform (STFT),Auto Regressive (AR), Singular Vector Decomposition (SVD) and Digital filtering methods. Also, we give a brief comparison of these methods In order to enhance the coding prediction performance as well as the computational complexity. Results provided that both STFT and digital filtering techniques for EIIP coded sequences performs with highest accuracy compared with AR and SVD methods.
Keywords: EIIP, Exons, Frequency Domain, Gene Finding, Intron, Spectrum Estimation
Article Outline
1. Introduction
- With the explosive accumulation of genome sequences, it has become the task of bioinformaticians to annotate a large amount of sequences with a very high degree of accuracy. Annotation includes identification of genes in the genome, assigning putative functions to them and characterizing their boundaries. The algorithms for identification of genes make use of one or more of the several available coding measures. These coding measures incorporate a unique feature or character of the coding sequence, based on which accurate identification of the sequence can be done. Gene prediction analysis and specifically, the computational methods for finding the location of protein-coding regions in uncharacterized genomic DNA sequences, is one of the central issues in bioinformatics. For a given DNA sequence of an organism, in which the genes and other functional structures are not already known, it is very important to have an accurate and reliable tool for automatic annotation of the sequence: the number and location of genes, the location of exons and introns (in eukaryotes), and their exact boundaries. Therefore, along with standard molecular methods, many new methods for finding distinctive features of protein-coding regions have been proposed in the past two decades. These methods are based on different measures for discriminating between protein-coding and non- coding regions.).In eukaryotic DNA, genes generally consist of coding regions (exons) and non-coding regions (introns). Proteins are translated from a copy of the gene where introns have been removed and exons are joined together, a process called splicing. It is therefore of importance to identify reliably the start of a gene, its exons and introns (if present) as well as the end of the gene, whereas in prokaryotes these regions are continuous. A DNA sequence is a string of the four characters A, C, G, and T which represent the four nucleotides. Each of the twenty possible amino acid is coded by three such nucleotides. In the exon, the nucleotides therefore exhibit a periodicity with period- 3 arising from the special bias built into the genetic code. Based on this property in coding regions of DNA, different methods to discriminate between coding and non-coding regions using statistical methods[1], autocorrelation[2], and finally Fourier analysis have been investigated[3]. While the intronic sequences show a rather random pattern, coding sequences show periodicities[4]. Based on this property, in order to differentiate between coding and non-coding regions, The DNA sequence is first encoded into a numeric sequence then, we apply different frequency domain power spectrum estimation techniques for the detection of 3- base periodicity property. The EIIP sequence indicators are used for numerical data representation. Then, power spectrum of these mapped sequences reveals period three peaks for exon regions. Many DSP techniques have been used to automatically distinguish the protein coding regions (exons) from the non- coding regions (introns) in a DNA sequence. In this paper, we investigated the effect of using the EIIP mapping methods on different frequency domain power spectrum estimation methods for the discrimination between coding and non- coding protein regions. A good discrimination between exon areas and non-coding areas of a number of genomes when the sequences are mapped to EIIP indicator sequences and the power spectra of the same are taken in a sliding Kaiser window, compared to the existing method using a rectangular window which utilizes binary indicator sequences. This mapping method has abandoned the four sequences all together and adopted a single ‘EIIP indicator sequence’ which is formed by substituting the electron-ion interaction pseudopotentials (EIIP) of the nucleotides A, G, C and T in the DNA sequence, reducing the computational overhead by 75%[5].
2. Methods
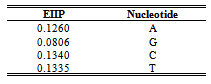
- 1. Numerical Sequence Representation Before computational methods can be applied, it is necessary to convert the A, T(U), G and C character sequences into numeric sequences. Many rules have been proposed for this purpose[6]. In this work we have used the EIIP sequence indicators; the energy of delocalized electrons in amino acids and nucleotides has been calculated as the Electron-ion interaction pseudopotential (EIIP)[5]. The EIIP values for the DNA nucleotides are given below in Table 1. For example, if x[n] =[A A A T G TC A T C A G], then using the values from Table 1, Xe[n] =[0.1260 0.1260 0.1260 0.1335 0.0806 0.1335 0.1340 0.1260 0.1335 0.1340 0.1260 0.0806]. The Kaiser Window function is used with EIIP mapping scheme with a defined size to remove most of extraneous peaks appears when using rectangular windows[5]. Then, the corresponding Discrete Fourier Transform is given by:
 | (1) |
 | (2) |
|
2.1. Sliding Window STFT Method
- The short-time Fourier transform (STFT), or alternatively short-term Fourier transform, is a Fourier-related transform used to determine the sinusoidal frequency and phase content of local sections of a signal as it changes over time. In order to detect probable coding regions in DNA sequences we examine the local signal to noise ratio of the peak within a sliding window and by selecting an appropriate threshold. Simply described, in the continuous-time case, the function to be transformed is multiplied by a window function which is nonzero for only a short period of time. The Fourier transform (a one-dimensional function) of the resulting signal is taken as the window is slid along the time axis, resulting in a two-dimensional representation of the signal. Mathematically, this is written as:
 | (3) |
 | (4) |
 | (5) |
2.2. Auto Regressive (AR)
- The AR technique assumes that the observed data x(n) for n =0,l, ..,N-1 is the output of a recursive digital filter having only poles - there are no zeros in the AR model. In other words:
 | (6) |
 | (7) |
 | (8) |
2.3. Singular value decomposition (SVD)
- The SVD takes a rectangular matrix of data reshaped numeric DNA sequence values (defined as A, where A is k×p matrix). The SVD theorem states that:
 | (9) |
 (i.e. U and V are orthogonal)
 The matrix S (the same dimensions as A) has singular values in decreasing order. The singular values in S are square roots of Eigen values from AAT or ATA. The frames of numeric DNA sequence values can be organized into a rectangular matrix (k×p) before applying to SVD. In order to detect period- 3 behavior, we choose the value of k=3. The linear combination of the highest singular values of all frames of all types can be used for the decision to predict about coding and non coding regions of the DNA sequence[9].
2.4. Digital Filtering Techniques
- The Short Time Fourier Transform method of finding exons as described above may be viewed essentially as a filtering technique. As N corresponds to 2 л, the period 3 components may be isolated by filtering the sequence through a bandpass filter H(z) with the pass band centered on 2л/3. If we give the numerical DNA sequence X[n] as input to H(z),the corresponding outputs y[n] will have peaks at coding regions as the filter has a passband around 2 л /3. Now y[n] plotted against n will reveal peaks in exon regions and such peaks are absent in noncoding regions. So this can be utilized for locating exons in a DNA segment. An advantage of this method is that it is not model dependent. The design and implementation of H (z) as an anti-notch filter and its modifications are discussed in a number of papers[10- 12]. We will describe them briefly as:Consider a second order all pass filter:
 | (10) |
 and zeros at
  Also, consider a filter bank:
 | (11) |
 | (12) |
 | (13) |
 | (14) |
3. Evaluation Criteria
- In this paper, we have used the discrimination measure D to differentiate between coding (exons) and noncoding regions (introns). It is used to compare the performances of different frequency domain power spectrum estimation methods in EIIP coded sequences based on the property of 3- base periodicity. The D measure is given by:
 As D value increases as we have a better discrimination between exons and introns. Also, If D is more than one, all exons are well identified without ambiguity and if D is less than one , this indicates that at least one exon is not having enough strength to be distinguished from non coding areas[5].
4. Experimental Setup
4.1. DNA Sequence Database
- We have applied our work to a set of DNA sequences coded in EIIP indicator sequences. Here a sequence segment with 8000 base pairs in gene F56F11.4 in C-elegans (base number 7021 – 15080 in chromosome III; accession number AF099922) and the gene HUMELAFIN (Acc. No. D13156, homosapiens gene for elafin), were taken as an example. Then, In order to discriminate between coding and non coding DNA regions, the 3- base periodicity property has been detected using different frequency domain power spectrum estimation methods as STFT, AR, SVD and filtering techniques. In this paper, we have checked the power spectrum of several exon segments of eukaryotic genes in a number of organisms using EIIP indicators on two data sets. One is the dataset prepared by Burset and Guigó[13] and the other is HMR195[14] prepared by Sanja Rogic.
4.2. Prediction Setup
- In our experiments, estimates of AR model parameters are computed using the Burg method. The AR model order is varied from 2- 120 and frame size from 51 to 600, we found an order of 90 and frame size of 240 more suitable to our dataset. The STFT window length was adjusted to 351 using a Kaiser Window. In the SVD implementation, a frame size of 81 was used to organize the numeric sequence values into 3 × 27 rectangular matrices. Also, in the anti- notch filtering method the pole radius R was chosen close to unit circle (R=0.992). The DNA coding regions are identified by the peaks of the plots shown below as in Fig 1 which shows the power spectrum of the gene F56F11.4 in C-elegans (base number 7021 – 15080 in chromosome III; accession number AF099922), containing five exons, and Fig 2 which shows the power spectrum of the gene HUMELAFIN (Acc. No. D13156, homosapiens gene for elafin), using EIIP indicator. HUMELAFIN has two exons, one from nucleotide positions 245 to 325, and the other from 1185 to1459.
 | Figure 1. Comparison of different frequency-domain techniques for gene F56F11.4 in C-elegans |
 | Figure 2. Comparison of different frequency-domain techniques for gene HUMELAFIN (Acc. No. D13156, homosapiens gene for elafin) |
5. Comparisons and Evaluation
- According to the discrimination measure D, It is evident that STFT and digital filtering techniques for EIIP coded sequences performs with highest accuracy compared with AR and SVD methods, for all conditions however, the AR spectral estimates for EIIP coded sequences provide the lowest accuracy. This may be due to its modeling spurious detail in the form of spectral peaks. It is very difficult to get the model order p roughly correct for all type of sequences, before starting the analysis. This could be one of the reasons for the very weak results obtained for the AR method in work. It evident from Fig 3 that for all conditions, the difference in the D value for both STFT and digital filtering methods is very small. Also, as shown in Fig1 and Fig 2 exons (first exon) predicted using STFT are not unfortunately dominants and shifted from the actual region in comparison to exons predicted using digital filtering methods i.e. exons appear located in the actual region and more visible in the sense that they dominates spurious peaks when they are detected using the digital filtering methods. Also, the AR technique provides a poor performance when compared to SVD technique; this is also due to the spurious details of spectral peaks.
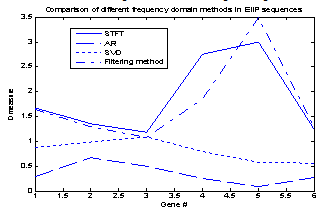 | Figure 3. D- measure for a set of genes for all frequency domain methods |
6. Conclusions
- In this work, we have predicted the locations of exons through the detection of their 3-base periodicity behavior. This was done through a study of the potential of applying the EIIP sequence indicators to frequency domain methods as short-time Fourier transform (STFT), auto regressive model (AR), Singular value decomposition (SVD), and filtering methods. We were able to accomplish high performance of the detection process when the proposed frequency domain power spectrum estimation techniques used in EIIP coded sequences. In conclusion, throughout this work we have found that the EIIP mapping method does provide a rather feasible coding scheme for the detection of the 3-base periodicity property when used with both STFT and digital filtering techniques. On the other hand, we have found that the EIIP provides a poor performance when used with both AR and SVD. So, according to this study and in order to improve the discrimination capability between coding and non-coding regions, the digital filtering method using EIIP mapping scheme can obviously provide a best performance and reduces the computational complexity with some advantages in implementation.