Amir H. Foruzan 1, 2, Yen-Wie Chen 2, Reza A. Zoroofi 3, Masaki Kaibori 4
1Department of Biomedical Engineering, Engineering Faculty, Shahed University, Tehran, Iran
2College of Information Science and Engineering, Ritsumeikan University, Shiga, Japan
3Control and Intelligent Processing Center of Excellence, School of Electrical and Computer Engineering, College of Engineering, University of Tehran, Tehran, Iran
4Department of Surgery, Hirakata Hospital, Kansai Medical University, Osaka, Japan
Correspondence to: Amir H. Foruzan , Department of Biomedical Engineering, Engineering Faculty, Shahed University, Tehran, Iran.
| Email: |  |
Copyright © 2012 Scientific & Academic Publishing. All Rights Reserved.
Abstract
We developed a Computer Assisted Surgery system which prepared a virtual environment for a physician to interact with the liver and decide on the therapy planning. It was composed of three modules: liver segmentation, vessel extraction, and simulator. We proposed a semi-automatic method to segment the liver. Hepatic veins, portal veins, and hepatic arteries were extracted from multi-phase CT datasets. The simulator visualized the segmented objects and provided for a physician a virtual scalpel to cut the liver. Initially, a transparent view of the liver was shown to the physician that revealed the location of the vascular structures. During the surgery, a toggling option made it possible to switch between a transparent and an opaque view. The width, height, and depth of the cut could be changed by user interaction. The proposed system is a framework which can later be extended to a complete system for analysis of hepatic diseases and therapy planning.
Keywords:
Virtual Surgery, Liver Visualization, Vessel Extraction, Liver Segmentation, CAD/CAS Systems
1. Introduction
Computer Assisted Diagnosis/Surgery (CAD/CAS) systems have an indisputable impact on the treatment of hepatic diseases. They are used to evaluate the geometry of the liver and its tumors, to study the vascular structures, and to assess the remnant liver volume after resection[1]. Typical applications include liver resection planning, path planning, thermal ablation design, and tumor grading. In these systems, a set of algorithms including segmentation, skeletonization, classification, 3D measurement, multiphase registration, and visualization are employed.Typical modules of a CAD/CAS system are liver segmentation, vessel extraction, tumor detection and segmentation, visualization of the results, volumetric measurement, and user-interaction[2, 3]. Fong et al. developed an application to read segmented liver slices, extract the surface of the liver, and visualize the liver’s volume in order to give a physician an insight into the patient’s liver[2]. Meinzer et al. prepared a framework to register multi-phase CT datasets, segment livers, extract vessels, calculate the volume of the segmented liver, and visualize the results. They used a web-based system to provide remote access to the results, too[1]. Selle et al. prepared an application to segment the liver, extract the vessels, and split the liver into the left and right lobes[4]. Shevchenkov et al. prepared a treatment planning system for liver surgery that could segment the liver and its vascular structures, perform a risk analysis, and visualize the results[5]. Song et al. developed an application to segment the liver in CT data, extract the surface of the liver, visualize liver’s volume, and perform some 3D measurements[3]. In this paper, we propose a CAS system which segments the liver, extracts the hepatic vessels, visualize the results, and prepare a virtual environment for a physician to perform surgery. The potential applications of this system are planning of the liver resection, risk analysis for the liver surgical operations, liver donor selection, and exploring the hepatic parenchyma for educational goals. Our system extracts the complete structures of the three hepatic vessels including hepatic arteries, hepatic veins, and portal veins. Thus, it reveals the relation between various vessels and gives the physician a better visual perception of the liver and its internal structure. However, some of the researches in this domain did not extract the vessels[2] or extracted only the major branches of one or two of the vessel trees[3, 6]. To compensate for the liver movements during scanning procedures, we employ a registration algorithm. Song et al. used the volume rendering technique for 3-D visualization of the liver and its vessels[7]. for large datasets, user-interactions increase the run-time for volume rendering. By employing surface rendering algorithm, we reduce the time for rendering large datasets. In our algorithm, segmentation of the liver and extraction of the vessels are performed faster compared to other methods[6, 8]. In[6-9], researches used straight paths to cut the liver. Another achievement in our system is employing implicit functions to cut the liver. Thus, they make it possible to extend the cut-path into a curved one too.The outline of this paper is as follows. The next section describes the proposed system. The results are presented in section three. In section four, we discuss the results and section five concludes the paper and describes future works.
2. System Description
The proposed system is composed of the following modules: 1) Liver segmentation and registration, 2) vessel extraction and enhancement, 3) visualization and user interaction (Figure 1).In the liver segmentation and registration module, we find the surfaces of the liver in multi-phase CT datasets. They are used as the liver masks in the vessel extraction and enhancement section. To compensate for patient movements during scanning procedures, the segmentation results of the first and third phases are registered to the surface of the liver in the second phase. The resultant transform matrices are later used for registration of hepatic arteries and hepatic veins too. The surface of the liver corresponding to the second phase is also employed in the visualization and interaction module.In the vessel extraction and enhancement block; hepatic arteries, portal veins, and hepatic veins are extracted from the arterial, portal-venous, and delayed phases respectively. The roots of these vessels are usually outside of the liver masks. In the enhancement section, the roots are segmented by region growing method and then added to their corresponding vessels and the vascular structures are trimmed too.Finally, the surface of the liver and its vessels are visualized by surface rendering algorithm. User-interaction is included in the system in the form of a scalpel that can be used to cut the liver into two parts. The following paragraphs describe theses modules in more details.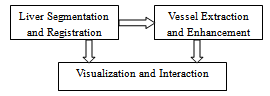 | Figure 1. The main modules of the proposed system. |
2.1. Liver Segmentation and Registration
Preprocessing is the first step of the liver segmentation algorithm. It includes noise reduction, definition of the body’s ROI, elimination of some non-liver tissues, and manual segmentation of the liver in a typical slice. The ROI of the body is defined as the smallest box that only contains the torso (Figure 2). It is used to reduce the size of the dataset and decrease the run-time of our algorithm. The result is an average reduction of 30% in the size of the input data. The intercostal muscles that are located between the ribs have the same intensity range as that of the liver. To remove these muscles, the ribs are segmented and a curve is then fitted to the center of the cross-sections of the ribs. This curve is used as a mask to remove the muscles. The final step of the preprocessing is segmentation of the liver in a typical middle slice. The mask of the liver in this slice is used to estimate the parameters of a Gaussian mixture with two components ( ) which is employed to model the intensity distribution of the liver’s tissue. The parameters of the model are estimated by the Expectation Maximization algorithm.
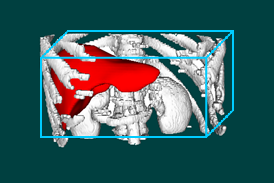 | Figure 2. Defining the ROI of the body (blue box) reduces the size of the dataset. |
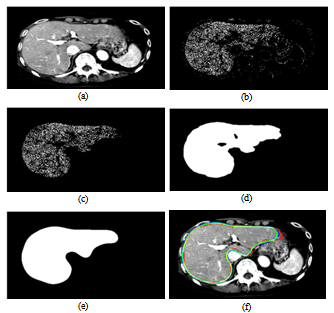 | Figure 3. The steps of the liver segmentation in the proposed “Multi-Mode Narrow-band Thresholding” technique. (a) Original CT slice, (b) “Liver Candidate Pixels”, (c) “Liver Index Pixels”, (d) rough liver border, (e) Initial smoothed liver border, (f) comparison of the true liver boundary (red curve) with the initial (green curve) / final (blue curve) liver border. |
To find the boundary of the liver in a new slice, we proposed a new method which we called it “Multi-Mode Narrow-Band Thresholding”[10]. By “Multi-Mode”, we imply that the intensity of the liver’s tissue is modelled by a Gaussian Mixture with more than one component. By “Narrow-Band Thresholding (NBT)”, we mean that the image is thresholded in a narrow region around the mean of each mode of the model’s components. There is always an overlap between the intensity distributions of non-liver tissues and that of the liver. The NBT technique makes the pixels corresponding to the liver to be seen as dense pixels and those of non-liver tissues as scattered pixels (Figure 3-b). Thus, it makes it possible to delineate the boundary of the liver.As the first step of the NBT technique, the image is thresholded in the range of  where 0<β<1 and
  and
and  are respectively the mean and standard deviation of the ith component of the mixture model. For
  , the result of thresholding is isolated liver pixels which we call them “Liver Candidate Pixels” in this paper (Figure 3-b). The K-means clustering is employed to reject non-liver pixels and remain the “Liver Index Pixels” (Figure 3-c). Then, the original image is thresholded in the whole range of each mode, i.e. in the range
 ), so that more pixels are involved. We assign to the new pixels a probability figure
  in which
  is the Hausdorff distance of the new pixels to the Liver Index Pixels. In this way, we establish the liver probability map and threshold it to find the initial boundary of the liver (Figure 3-d). The initial boundary of liver is smoothed by the Fourier transform. The coordinates of the boundary points are transformed into the Fourier domain and the first 15 components are kept and then transformed back into the spatial domain. The result is a smoothed liver border (Figure 3-e). As the final step of the liver segmentation algorithm, the initial liver surface is used as the input to a 3-D Geodesic Active contour algorithm[11]. A few iterations of the active contour algorithm are needed to find the final result (Figure 3-f). A complete description of our method is given in[10].We employ the surface of the liver from the second phase as a model and register the liver mask of the first and third phases to it. Registration is performed using “Iterative Closest Point” algorithm[12] and the resultant transform matrices are used to register the portal arteries and hepatic veins too. Therefore, we compensate for patient movements during scanning procedures.
Table 1. Eigenvalues correspond to different structures in a 3-D image[13].
 |
| |
|
2.2. Vessel Extraction and Enhancement
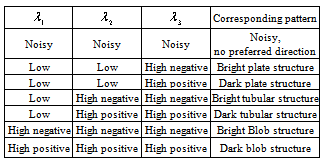
The segmentation results are used as the masks for vessel extraction module. To extract hepatic vessels, we employ the Frangi’s method which is a Hessian-based approach for tubular structures enhancement[13]. The method is built on the basis that the local structures of an image are inherent in the Hessian matrix of the image voxels. Eigenvalues of the Hessian matrix reveal the image structures and eigenvectors show the main directions into which the local second structures of the image can be decomposed. In Table 1, several different 3-D patterns and their corresponding eigenvalues have been listed[13].In Table 1,  is the ith eigenvalue corresponding to a point inside the structure. It is also assumed that
  [13]. Based on the conditions stated in Table 1, if we want to detect a bright tubular structure in a dark background, we have to look for voxels with λ1 nearly equal to zero, and both λ2 and λ3 have high negative values.
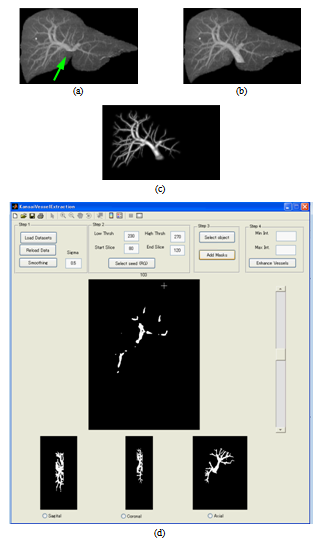 | Figure 4. Enhancing and trimming the vessels. (a) Enhanced portal veins. the root of the vessel (green arrow) is missed. (b) Including the root to the vessel. (c) Extracted vessels. (d) Developed vessel enhancement application. |
Frangi proposed a filter for enhancement of tubular structures that was based on eigenvalues (defined in Eq. 1).  | (1) |
The output of the filter, vo(s), is built by multiplication of three terms. Each term is in the range[0, 1]. The first term is controlled by RA (Eq. 1). Since the ratio of  is nearly equal to one in a linear structure, the first term of Eq. 1 has a high output in these cases. The second term has a low output when
  is nearly equal to
  . This happens when the eigenvalues correspond to a blob structure (Table 1). In this way, the second term lowers the output of the filter in blob structures. In noisy structures, eigenvalues are low. Thus,
  gives a metric of noisy structures and the third term is low when noisy pixels are visited. The products of the terms of RA, RB, and S try to enhance linear structures, weaken blobs, and reduce noise respectively.The roots of the vessels are usually located outside of the liver masks. Therefore, they are missed while applying the vessel enhancement filter (Figure 4-a). We developed an application in MATLAB environment to interactively segment the roots using region growing, include them to the vessels, and trim the vascular structures (Figure 4 b-d).
2.3. Visualization and Interaction
The visualization module exploits surface rendering algorithm to display both the liver and the vessels. It is implemented in C++ environment using the VTK toolkit[14]. The block diagram of this module is shown in Figure 5.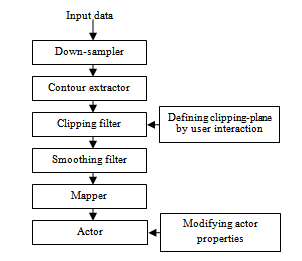 | Figure 5. The blocks of the visualization module |
After reading the input dataset (Figure 5), it is re-sampled to decrease its size by 30% so that the application runs faster. Then, the surface of the liver and its vessels are extracted and smoothed by the Gaussian filter. The clipping filter removes the regions specified by the user interaction. To clip a dataset, an implicit volume is defined as the intersections of six planes which constitute a cub. These planes are defined by a normal vector and a point through which they pass. The normal vectors of the planes are defined with respect to the direction of projection and the view-up in the visualization window. After deciding on the direction of the cut, the normal vectors of the cut planes are determined and are not changed any more. The geometries of the remaining surface points are found by the mapper and are sent to the actor to be displayed in the visualization window. By modifying the height, width, and depth of the cut, the position of the points corresponding to the planes are changed. We implemented a toggling option to switch between an opaque liver and a transparent one.
3. Results
Except for the liver segmentation and vessel trimming modules which were implemented in MATLAB environment, the other parts were coded in C++ using the VTK toolkit. The platform, on which we ran the code, was an Intel® Core™ 2 Duo 3GHz with 3GBytes of RAM.The iso-surface visualizations of the livers corresponding to the arterial and portal-venous phases are shown in Figure 6-a and b respectively. Comparing Figure 6-a and b, it can be clearly seen that the liver in the second (portal-venous) phase (Figure 6-b) has displaced somewhat with respect to the first phase (Figure 6-a). In Figure 6-c, the surfaces of the livers corresponding to these two phases are overlaid. Thus, registration is needed to align one data with the other. In Figure 6-d, the same surfaces are overlaid after registration. In the registration step, the surface of the liver corresponding to the second phase is selected as the reference data and those of the first and the third phases are used as the target data.As the evaluation metrics for the registration, we used RMS error (ErrRMS) and Hausdorff (dH(X,Y)) distance which are defined in Eq. 2 and 3 respectively. | (2) |
 | (3) |
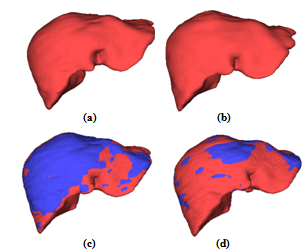 | Figure 6. Surface rendering of the livers corresponding to (a) arterial and (b) portal-venous phases. The surface of the portal-venous phase (red) is overlaid with the surface of the (c) original and (d) registered arterial phase (blue). |
In Eq. 2 and 3, d(x,y) refers to the Euclidean distance between the point x and y, X is the set of surface points in target data, Y is the set of surface points in the reference data, and Nx is the number of the surface points in the target data. Quantitative evaluations for the registration results are shown in Table 2.| Table 2. Evaluation results for the registration of the liver surfaces. |
| | Target Data | RMS error before(after) registration in mm | Hausdorff distance before (after) registration in mm | | Phase01 | 2.04 (1.58) | 11.59 (8.17) | | Phase03 | 3.05 (2.57) | 16.21 (16.20) |
|
|
In Figure 7 a-c, the extracted vessels are shown. Hepatic arteries, portal veins, and hepatic veins are extracted from the first, second, and third phase datasets respectively. In Figure 7-d, the liver and its vascular structures are shown together.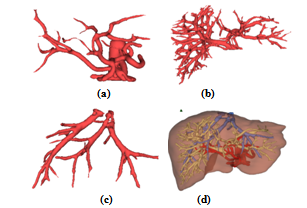 | Figure 7. The liver and its vascular structures are shown by iso-surface visualization: (a) Hepatic artery, (b) Portal vein, (c) Hepatic vein, (d) Liver together with its vascular structures. In (d), hepatic artery, portal vein, and hepatic vein are colored in red, yellow, and blue, respectively. |
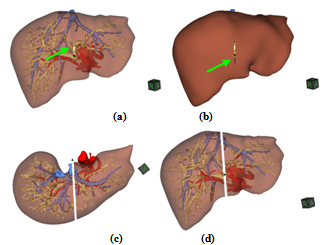 | Figure 8. Initial cut on the surface of the (a) transparent and (b) opaque liver shown by the green arrow. (c) and (d) Two different views of the final surgery. |
In Figure 8, the snapshots of the developed virtual surgery simulator are shown. In Figure 8-a, there is an initial cut on the surface of the liver which is pointed by a green arrow. Based on the location of the vascular structures and the major branches of the vessels, a surgeon decides on the initial position and the direction of clipping-plane. To make the surgery more realistic, the user can switch from a transparent liver to an opaque one (Figure 8-b). In Figure 8-c and d, two views of the final results of the surgery are shown in which liver is approximately divided into its left and right lobes.
4. Discussion
Considering a fixed model for the liver and its vessels is difficult due to the large variations of the organ. CT scanners help us to visualize them as 3D objects and gain information on the geometry and topology of the hepatic tissue. Current 2D images cannot have the same impression for a physician compared to a 3D volume. The proposed system provides us with such a virtual environment and allows a user to interact so as to prepare a complete virtual surgery.The proposed segmentation algorithm was a combination of 2D and 3D approaches. It exploited a priori information of the previously segmented slices, which was inherent in 2D segmentation methods, to tune the liver boundary for a variety of the liver shapes. It also took advantage of the smoothness of 3D approaches introduced by the 3D Active Contour algorithm. We evaluated the proposed segmentation method by 35 CT datasets which had several diversities: 1) The volumes included both normal and abnormal livers, 2) Some volumes were enhanced by contrast agent while some not, 3) The volume dimensions and the liver positions in the datasets substantially varied, 4) The inter-slice resolutions changed from 0.6 mm to 2.5 mm[10]. An improvement in the proposed method is the detection and segmentation of small sections of the liver. Regarding some high-contrast images, leakage occurred only in a single slice. In these cases, we did not consider the intensity range of the vessels so as to prevent leakage to the IVC. However, the vessels were included in the segmentation results when the images were smoothed by the AD filters and the Fourier transform. In some cases, our method missed the vessels too. Segmentation of a dataset including 185-263 slices took 18-22 minutes and required less user-interaction with respect to other methods[1, 8]. We plan to thoroughly implement our method in C++ environment and reduce the run-time to acceptable rates.Since Hessian-based methods for enhancement or extraction of the medial-axes of the tubes were extensively used in the literature, we followed the same approach to extract hepatic vessels. Developing an application to include the roots to the vessels and trim the results improved the vessel extraction algorithm. Our results of vessel extraction were smoother and more branches were extracted compared to the conventional methods like thresholding, connected component labelling, and morphological operations[1, 6, 8-9]. The segmented hepatic and portal veins are usually connected by the minor vessels trees. We plan to refine our method to separate these vessels.Regarding the visualization module, we used implicit functions to define the cut region. Thus, we may employ the functions to include more complex routes and give the user the capability to design curved paths too. To give a physician a deeper insight into the inside of the liver, we visualized all three hepatic vessels. Employing surface rendering instead of volume rendering increased the speed of our algorithm. However, we have to improve the speed of our code more. The proposed system may be used to give insights into the topology and geometry of hepatic tissues and make it possible to decide on the optimum path to cut the liver with minimum damage. It makes more complex liver resections safer. The system can also be used in operating rooms to show the inside of the liver continuously to a surgeon at the surgery time. If the proposed system is integrated with some external markers, it can be used as a guided surgery system as well.
5. Conclusions and Future Works
We presented a system which segmented the liver, extracted its vascular structures, registered dataset corresponding to different phases, visualized them, and prepared a virtual environment for a physician to perform surgical operations on the hepatic parenchyma. The system had the potentials to be used for treatment/surgical planning and even as a guided surgery system. In future, we plan to integrate all the codes in C++ environment, and implement curved cuts. Compared to MATLAB environment, developing a friendly user-interface in C++ is much simpler. There are several nested loops in our algorithm that make the code run slowly. Developing the algorithm in C++ environment improves the run-time of the code. Inclusion of haptic devices to replace mouse interactions is the next step of our work which we have started so far. Adding a tumor extraction module enhances the framework to be utilized in both resection planning and other surgical operations. We plan to evaluate our system in clinical environments for preoperative assessments. Improving the segmentation module is another part of our future work.Regarding organs other than liver, there are potential applications of the proposed system. The segmentation module may be used for other organs too. The vessel extraction and enhancement has prospective uses to enhance and extract other vascular structures inside human body such as the lung airways.
Acknowledgments
This work was supported in part by the Grand-in Aid for Scientific Research from the Japanese Ministry for Education, Science, Culture and Sports under the Grand No. 21300070 and in part by the Research fund from Ritsumeikan Global Innovation Research Organization (R-GIRO).
References
| [1] | H.P. Meinzer, P. Schemmer, M. Schobinger, M. Nolden, T. Heimann, B. Yalcin, et al., ”Computer-based Surgery Planning for Living Liver Donation,” 20th ISPRS Congress, Istanbul 2004, International Archives of Photogrammetry and Remote Sensing, vol. 35, no. 5, pp. 291-295. |
| [2] | J.S. Fong and H. Ibrahim, “Software Technology and Engineering” (ICSTE), 2010 2nd International Conference on, 2010, pp. V1 41-45. |
| [3] | X. Song and M. Cheng, B. Wang, S. Huang, and X. Huang, “Computer-aided Preoperative Planning for liver Surgery based on CT Images”, Procedia Engineering 24, 2011, pp. 133-137. |
| [4] | D. Selle, B. Preim, A. Schenk, and H. Peitgen, "Analysis of Vasculature for Liver Surgical Planning", IEEE Trans. Med. Imag., pp.1344-1357, 2002,. |
| [5] | N. Shevchenko, B. Seidl, J. Schwaiger, M. Markert, and T.C. Lueth, “MiMed liver: A planning system for liver surgery Engineering”, in Medicine and Biology Society (EMBC), 2010 Annual International Conference of the IEEE, 11 Nov. 2010, 1882-1885. |
| [6] | K. Numminen, O. Sipila, and H. Makisalo, “Preoperative hepatic 3D models: Virtual liver resection using three-dimensional imaging technique,” European J. Radiology, vol. 56, pp.179-184, 2005. |
| [7] | L. M. Song, J. Luo, and Y. H. Wen, “Three-dimensional Virtual Surgery Based on CT Images,” Bioinformatics and Biomedical Engineering, 2009. ICBBE 2009. 3rd International Conference on, pp. 1-4. |
| [8] | G. Glombitza, W. Lamade, A. M. Demiris, et al. “Virtual planning of liver resections: image processing, visualization and volumetric evaluation,” International Journal of Medical Informatics, vol. 53, pp. 225-237, 1999. |
| [9] | H. K. Hahn, B. Preim, D. Selle, and H. O. Peitgen, “Visualization and Interaction Techniques for the Exploration of Vascular Structures,” In IEEE Visualization (San Diego, Oktober), 2001, pp. 395-402. |
| [10] | A.H. Foruzan, Y.W. Chen, R.A. Zoroofi, A. Furukawa, Y. Sato, and M. Hori, “Multi-mode Narrow-band Thresholding with Application in Liver Segmentation from Low-contrast CT Images”, IIHMSP 2009, Japan. |
| [11] | V. Caselles, R. Kimmel, and G. Sapiro. “Geodesic active contours,” International Journal on Computer Vision, vol. 22, no. 1, pp. 61–97, 1997. |
| [12] | Z. Zhang, “Iterative point matching for registration of free-form curves,” Research Report 1658, INRIA Sophia-Antipolis, March 1992. |
| [13] | A.F. Frangi, W.J. Niessen, K.L. Vincken, and M.A. Viergever. “Multiscale vessel enhancement filtering,” In Proc. 1st MICCAI, 1998, pp. 130-137. |
| [14] | Visualization toolkit, http://www.vtk.org/, accessed: 20 March, 2012. |
 Abstract
 Reference
 Full-Text PDF
 Full-Text HTML