-
Paper Information
- Next Paper
- Previous Paper
- Paper Submission
-
Journal Information
- About This Journal
- Editorial Board
- Current Issue
- Archive
- Author Guidelines
- Contact Us
American Journal of Tourism Management
p-ISSN: 2326-0637 e-ISSN: 2326-0645
2013; 2(A): 26-33
doi:10.5923/s.tourism.201304.03
Tourist Satisfaction with Hotel Services in Cape Coast and Elmina, Ghana
 Abstract
 Reference
 Full-Text PDF
 Full-text HTML
Eunice Fay Amissah
Department of Hospitality and Tourism Management, University of Cape Coast, Ghana
Correspondence to: Eunice Fay Amissah, Department of Hospitality and Tourism Management, University of Cape Coast, Ghana.
| Email: |  |
Copyright © 2012 Scientific & Academic Publishing. All Rights Reserved.
The tourism industry is an integrated industry made up of a number of sectors such as accommodation, catering, transportation, visitor attractions, entertainment, travel intermediaries, retailing and tourism-related public agencies. Tourists’ satisfaction with each component invariably affects their overall satisfaction with the destination. One of the challenges that face small and medium tourism enterprises globally especially those in developing countries is customer satisfaction. Although, hotels are expanding globally, offering competitive services and restructuring their services in order to satisfy the changing needs of customers, much has not been done to assess tourists’ satisfaction with hotel services in peripheral areas such as Cape Coast and Elmina in Ghana. This study assessed the factors that influence overall tourist satisfaction with hotels and also examined the relationship between service quality, tourists’ levels of satisfaction and revisit intentions in the hotel industry using the gap model. The study was conducted in Cape Coast and Elmina, two of the most popular tourist destinations in Ghana. The results revealed four main factors which influence tourists’ satisfaction with hotel services. Also, there was a significant relationship between satisfaction and revisit intentions. It is recommended that management of these hotels should put in place strategies to improve employee confidence, prompt delivery of service and materials associated with service.
Keywords: Tourist, Satisfaction, Service quality, Expectation, Perception
Cite this paper: Eunice Fay Amissah, Tourist Satisfaction with Hotel Services in Cape Coast and Elmina, Ghana, American Journal of Tourism Management, Vol. 2 No. A, 2013, pp. 26-33. doi: 10.5923/s.tourism.201304.03.
Article Outline
1. Introduction
- Tourism has become the largest industry and most important export sector in the world. Expenditure on tourism has risen fivefold, corresponding to an annual growth rate of about 8% and that it accounts for 12 % of the world’s Gross National Product ([1]). Ghana is one of several Sub-Saharan African countries where tourism has moved to the centre stage of government policy and the industry is being promoted for socio-economic development at district, national and international levels. Since 1989, tourism has received a great deal of attention in government’s policy initiatives, including the 15-year National Tourism Development Plan among others. As a result the country is said to have attracted the highest number of business travellers to Africa. Ghana as a country possesses a number of tourist attractions such as pristine beaches, rich traditional culture, castles and the national Parks. Tourist arrivals increased from 53,000 in 2002 to 803,000 in 2010 ([2]). Globally, there is an increasing demand for better quality products and services including hotel services. Hotelcustomers are becoming much more discerning and demanding, making the delivery of quality service one of the challenges facing the tourism industry especially the hotel sub-sector. As such tourist satisfaction is a key ingredient for the survival and success of the hotel industry. Therefore, hotels need to differentiate their service offerings by meeting the needs of their customers better, improving customer satisfaction and delivering service quality that is higher than that provided by competitors ([3][4]). Customer satisfaction and service quality have received much attention from practitioners and researchers. However, studies have been concentrated on developed countries with limited empirical studies in peripheral areas like Ghana. A number of studies have identified a positive relationship between customer satisfaction and customer loyalty ([5][6][7][8]) as well as between customer satisfaction and positive word-of-mouth[9]. Consequently, one of the key strategies for customer-focused firms is to measure and monitor service quality and customer satisfaction. In measuring service quality and tourist satisfaction, it is important to understand the different issues involved in service quality, tourist satisfaction and revisits intentions and the interactions of these issues[10]. Also, to provide customer satisfaction, organizations must identify customers’ needs, desires and expectations[11]. This paper seeks to fill the gap in service quality and satisfaction studies in a developing country and also provide useful knowledge for hotel managers to improve their services. The aim of the study was to evaluate the factors that influence overall satisfaction of tourists in hotels and to examine the relationship between overall service quality, tourists’ level of satisfaction and revisit intentions in the hotel industry.
2. A Literature Review
2.1. Guest Satisfaction
- Guest satisfaction has been a popular topic in marketing practice and research since[12] initial study of customer effort, expectation and satisfaction. Despite many attempts to measure and explain customer satisfaction, a consensus has still not emerged regarding its definition[13]. It is the result of an evaluative process that contrasts pre-purchase expectations with perceptions of performance during and after the consumption experience[14].Customer satisfaction is a psychological concept that involves the feeling of well being and a pleasure that results from obtaining what one hopes for and expects from an appealing product and or service[6]. Customer satisfaction is typically defined as a post-consumption evaluativejudgment concerning a specific product or service[15]. According to[16] customer satisfaction can also be defined as, “a satisfaction based on an outcome or process”. The most widely accepted conceptualization of customer satisfaction is the expectancy disconfirmation theory[17]. The theory was developed by[14] who proposed that satisfaction level is a result of the difference between expected and perceived performance. Satisfaction (positive disconfirmation) occurs when products or services are better than expected. On the other hand, a performance worse than expected result is dissatisfaction; (negative disconfirmation). It therefore measures how well a company’s product or services meet or exceed customer expectation. Customer expectation is the perceived-value customers seek from the purchase of a good or serviceThere are several ways to access the quality of services and customer satisfaction through subjective measures of quality, which focuses on perception and attitude of the customer, rather than more concrete objective criteria of facilities available. According to[18], a customer satisfaction measurement program must be incorporated into an organization’s corporate culture. Knowledge of customer expectations and requirements are essential as it provides understanding of how the customer defines quality of service and products and furthermore it facilitates the development of customer satisfaction.Studies show that customer satisfaction may have direct and indirect impact on business results.[19] concluded that customer satisfaction positively affects business profitability. Most studies have investigated the relationship between customer satisfaction and behaviour pattern ([5][10][6][7]). According to these findings, customer satisfaction increases customer loyalty, influences repurchase intentions and leads to positive word-of-mouth.In today’s competitive environment, one of the most important goals of corporate culture is retaining and satisfying current and past customers. Experience has shown that only “customer oriented” corporations can achieve their goals. These organizations focus on the needs and desires of specific target groups and then work hard to maximize satisfaction with the product or service being offered[16]. Instead of waiting for customers to complain, a “consumer oriented” corporate culture seeks continuous feedback from customers through repeated customer satisfaction measurements.[20] suggest that satisfaction with a service is a function of satisfaction with two independent elements. The functional element, that is the food and beverage in a hotel restaurant, and the performance-delivery element which is the service. To prove the independence of the two elements from each other, the authors claim that hotel restaurant clients are quite capable of having response to each other.[21] divided the service encounter into two elements namely direct and indirect service. For example, direct service may be the actual check-in or check-out process in a hotel, while the indirect service include the provision of parking facilities, concierge, public telephone for guest’s use and all other service. According to[22] there are two service attribute groups, namely core and secondary. In a restaurant situation found in a hotel, Lovelock’s core will be composed of food and beverage while his secondary will be composed of everything else, including service environment and all other elements.[23] too classifies the service encounters attributes in two groups, namely essential and subsidiary.
2.2. Determinants of Tourist Satisfaction
- Given the critical role of customer satisfaction it is not surprising that a number of studies have been devoted to investigating the determinants of satisfaction. Satisfaction can be influenced by subjective (e.g. customer needs and emotions) and objective factors (e.g. product and service features). Applying this to the hospitality industry, there have been numerous studies that examine attributes that travellers find important regarding customer satisfaction.[24] found out that cleanliness, security, value for money and courtesy of staff determine customer satisfaction.[25] revealed that room cleanliness and comfort, convenience and location, prompt service safety and security and friendliness of employee are important to guests.[26] stated that employee attitude, location and rooms are likely to influence travellers’ satisfaction. A survey conducted by[27] indicated that the primary determinants of hotel guest satisfaction are the behaviour of employees, cleanliness and timeliness. Customer loyalty measures the degree of commitment based on obligation or consumer preferences, and degree of satisfaction. It is the tendency of a customer to choose one business or product over another for a particular need[28]. [30] concluded that staff quality, room qualities and value are the top three hotel factors that determine travellers’ satisfaction.[29] found three dimensions relating to employees (behaviour and appearance), tangibles and reliability but the best predictor of overall service quality is the employee dimension.[31] revealed that price and communication were important. A study by[32] indicated that satisfaction is mainly derived from the reliability factor while[33] found empathy to be the most important dimension in predicting hotel customers' satisfaction.[34] also revealed that tangibles and intangibles exert a significant positive effect on customer satisfaction.[8] Identified reliability, empathy and competence of staff, accessibility and ‘tangibles’ as the key factors influencing satisfaction. A study conducted by[35] revealed that business travelers had the highest expectations for the dimension of ‘‘convenience’’ followed by ‘‘assurance’’, ‘‘tangibles’’, adequacy in service supply’’, and ‘‘understanding and caring’’.
2.3. Predictors of Overall Service Quality and Customer Satisfaction
- [29] found out that the best predictor of overall service quality is the dimensions referred to as “employees”. According to[36], in order of importance, staff quality, room qualities and value were the three most influential factors in determining travellers’ overall satisfaction levels and their likelihood of returning to the same hotels.[32] studied international tourists’ perceptions of hotels in Mauritius by using a modified SERVQUAL approach. Results from a regression analysis suggested that the overall level of service quality is primarily derived from the ‘reliability’ factor while [33] came out that empathy is the most important dimension in predicting hotel customers' overall service quality evaluation.[34] revealed that tangibles and intangibles exert a significant positive effect on customer satisfaction while[8] found that reliability, empathy and competence of staff, ‘accessibility’ and ‘tangibles’ are the key factors that best explained customers’ expectations of hotel service quality.
2.4. The Relationship between Service Quality, Satisfaction and Revisit Intentions
- Customer satisfaction is determined by defining the customer perception of quality, expectations and preferences [37] Studies have shown that there is a relationship between service quality and customer satisfaction ([38][40][39]) and between satisfaction and revisit intentions ([39][30]).[41] revealed a positive relationship between customers’ satisfaction and revisit intention while[42] proposed an integrated framework of service quality, customer satisfaction and perceived value and indicated that customer satisfaction and perceived value have significant influence on customers’ repurchase intentions.
2.5. Gap Analysis of Expectations and Perceptions of Service Quality
- Expectations can be described as the desires or wants. Customers’ expectations are, in most cases different from what the customer gets[43] while perceptions are defined as the end results of a number of observations by a customer. Several studies have pointed out that customers’ expectations are generally higher than their perceptions of service quality. For example, a study by[44] revealed that expectations of customers were higher than their perceptions in all the five dimensions of service quality.[45] study in Chitral hotels in Pakistan indicated that the perceived service quality was lower than the expected service quality.[32] also found out that guests expectations of service quality in hotels in Mauritius were far below guests' expectations. However, a study by[46] to assess customers’ satisfaction towards service quality in hotels in Pattaya showed a positive gap between expectations and perceptions indicating that expectations were rather lower than perceptions of service quality.
2.6. Research Methodology
- The target population of the study was all international tourists who visited and lodged in the selected hotels in Cape Coast and Elmina. A pilot study involving 30 non- tourist guests was conducted in Takoradi, a nearby city on the 4th and 5th of February, 2013. The response led to the re-wording of some items on the scale to enhance the validity of the instrument. Permission was then sought from the selected hotels and data collected (11th- 28th February, 2013) on the premises of the hotels that confirmed their participation in the survey. Tourists were sampled using the convenience sampling method. A self-administered questionnaire was used and the SERVQUAL scale developed by[38] was employed in this study. The questionnaire consisted of four main sections; the first section was designed to measure service quality expectations of tourists lodging in the selected hotels at the time of the study and the second section measures the perceptions of the tourists. The third section had items measuring the overall service quality level of the hotels, overall satisfaction level, the recommendation of the hotel to others and repeat visits. The concluding section of the questionnaire included questions pertaining to demographic data (nationality, gender, age etc.) about respondents. Researchers ([47][48][33]) pointed out that five point scale work better and increase response rate and response quality. As such a five point scale (l=very low and, 5=very high) was preferred for data collection, not the seven point scale on SERVQUAL.A total of 300 questionnaires were given out and 257 were returned, yielding a response rate of 76%. Of the 257 questionnaires returned, 228 of them were found to be useful for analysis. The Statistical Product and Service Solution (SPSS) version seventeen (17) was used to analyze the data. The data were coded and entered into the SPSS software for analysis. The data were carefully edited (cleaned) to remove all outliers or extreme values which could have affected the validity of the results. Descriptive statistics such as averages and frequencies were employed to present background and travel characteristics of respondents among others. Inferential statistical measures like paired sampled t-test and the Pearson moment correlation were used to test the significant differences in the means of expectations and perceptions and the relationships between overall service quality, levels of satisfaction and revisit intension. The factor analysis model (a data reduction technique) was used to determine the main components or factors that explained tourists’ satisfaction with hotel services.
2.7. Profile of Respondents
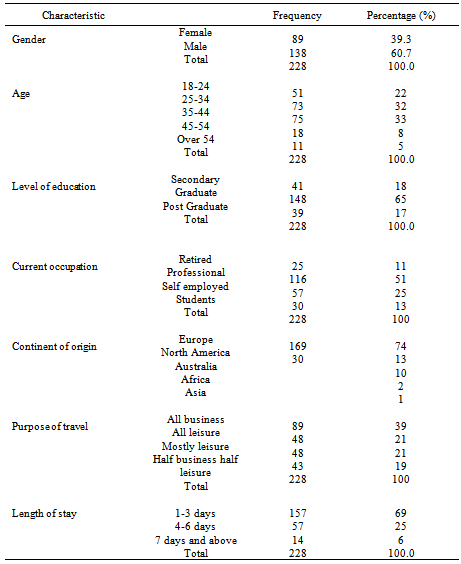
- Table 1 shows the results of the profile of the respondents. There were more males (61%) than females (39%). In terms of age, 33 percent of the respondents were between 35-44 age category followed by those between 25-34 age group (32%). Majority (65%) had a graduate degree and about 51% were professionals (executives, doctors, teachers etc.). About 40% indicated that the purpose of the visit was all business. The majority (69%) stayed between 1-3 days. With respect to the continent of origin, the majority (74%) was from Europe followed by North America (13%).
2.8. Analysis of Data
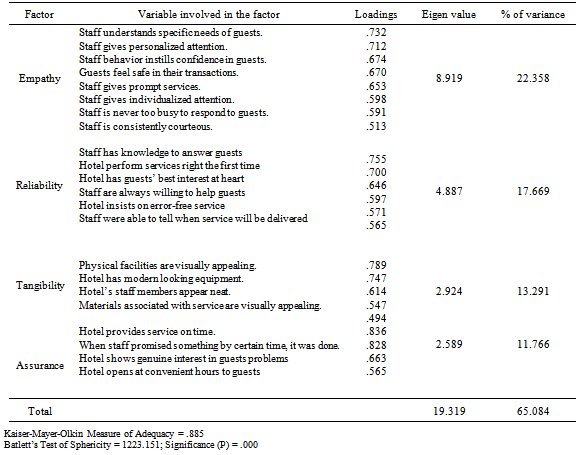
- An exploratory factor analysis was performed in order to assess the dimensions of service quality. The principal component analysis with Varimax rotation was employed. In ensuring the factorability of the data, the Bartlett’s test of sphericity and the Kaiser-Meyer-Olkin (KMO) measures of sampling adequacy were examined. To[49], the Bartlett’s test of sphericity should be significant (p<0.05) in the Factor analysis to be considered appropriate while the KMO index ranges from 0-1, with 0.6 recommended as the minimum value for a good Factor analysis. For this study, the Bartlett’s test of sphericity was found to be very significant (p=0. 00) while the KMO index of 0.885 confirmed the suitability of the data for Factor analysis.
|
|
2.9. Best Predictors of Overall Satisfaction
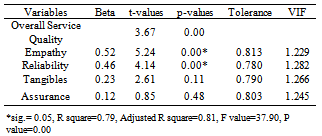
- A Standard Multiple Regression was used to examine the predictive effect of the four dimensions (independent variables) from the factor analysis on overall service quality (dependent variable). This is presented in Table 3. Results from Table 3 indicates that only empathy and reliability were significant in predicting overall service quality. The four factors explained 79% of the variance in overall service quality. Individually, empathy (B=0.52, p=0.00) made the strongest prediction followed by reliability (B=0.46, p=0.00), tangibles (B=0.23, p=0.11) and assurance (B=0.12, p=0.48). The result corroborate the findings by[32] and[33]
2.10. Overall Service Quality, Satisfaction and Revisit Intention
|
2.11. Gap Analysis of Expectations and Perceptions (Satisfaction levels)
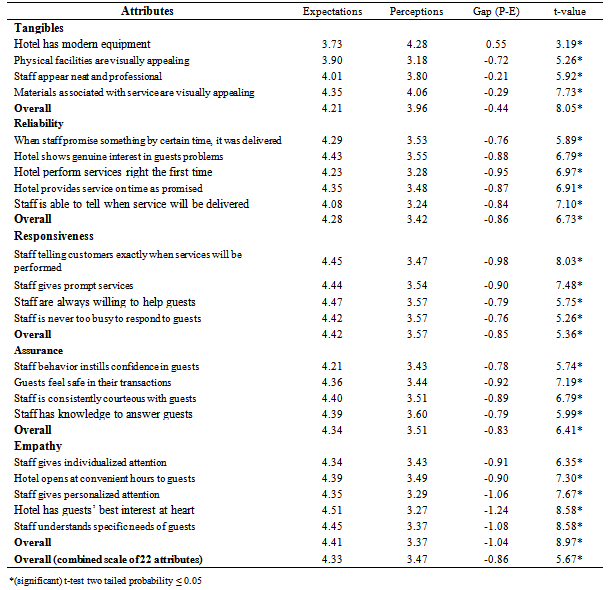
- Table 4 presents the mean scores on the expectations and perception scale for the 22 attributes and the mean gap scores (perceptions-expectations). The paired sampled t-test was used to test for significant differences between expectations and perceptions Results from Table 4 indicate that a total of 20 attributes had relatively high expectations scores (Mean>4.00) and two had expectations score of Mean<4.00.The two are ‘hotel has modern equipment’ and ‘physical facilities are visually appealing’. All the perception scores were consistently lower than the expectation scores. Thus resulting in the negative gaps which indicate that service delivered did not meet the expectations of the tourists. The overall gaps mean score was -0.86 (p<0.05) which means that tourists are dissatisfied with hotel service in Cape Coast and Elmina. On the other hand, only ‘hotel has modern equipment’ attribute had a positive gap which suggests that tourists were satisfied with hotel equipments.The biggest gaps were found in the empathy factor like ‘hotel has guests interest at heart’ (-1.24), ‘staff understand specific needs of guests’ (-1.08) and ‘staff gives personalised attention’ (-1.06) while the smallest gaps were from the tangible factors such as ‘Staff appear neat and professional’ (-0.21) and ‘Staff appear neat and professional’ (-0.29).It can be stated that there is a statistically significant (t=5. 67, p=0.05) difference between guests’ expectations and their perceptions of service quality. This finding confirms most service quality studies ([32][44][45] but contradicts[46] findings which revealed a positive gap between customers' expectations and perceptions.
|
3. Conclusions and Recommendations
- The study has looked at the issue of tourists' satisfaction with hotel services as an important key in tourism development in peripheral areas as Ghana. Factors that account for satisfaction and the relationships between satisfaction and other variables are also explained. Since tourists dissatisfaction with one hotel service could mar the whole travel experience or cause satisfaction with the destination, developing destinations like Ghana must put in extra efforts to improve service quality. The study specifically found that tourists staying in hotels in Cape Coast and Elmina perceived empathy factor to be the topmost dimension followed by reliability dimension. Attributes such as ‘staff understands the specific needs of guests’ and ‘staff gives personalized attention’ were considered very important under the empathy dimension and ‘staff has the knowledge to answer guests’, ‘hotel performs services right the first time’ and ‘hotel has guests’ best interest at heart’ from the reliability factor are very crucial. This has implications for the management of hotels and the hospitality and tourism industry as a whole. All attributes are important but hotels should work on these to achieve high levels of satisfaction. It has also be established that only empathy and reliability were significant in predicting overall service quality. This suggests that empathy and reliability factors influence tourists overall service quality. As such priority must be given to these factors in ensuring high service quality. The study has also ascertained the relationship between service quality and tourist satisfaction and revisit intention that there exist positive strong relationships which invariably suggest that if overall service quality is high; all things being equal, tourist satisfaction will be high. And a high level of satisfaction will lead to high revisit intentions. This can be implied that when hotel managers improve on the delivery of service quality, their customers especially tourists will be satisfied and will revisit the hotel. The study also considered the expectations and perception differences to measure satisfaction. It was found out that generally tourists’ perceptions were lower than their expectations hence, the negative gaps. This suggests that the actual service delivered to tourists did not match up to their expectations indicating dissatisfaction with services delivered by hotels in Cape Coast and Elmina. The negative service gaps could be as a result of a number of factors including: understaffing, inefficient operational procedures, lack of training and management not understanding customer desires. Consequently, managers have to put in extra effort to minimize these gaps by first, training employees and also treating them as internal clients so that they understand and appreciate how the hotel works, because satisfied and motivated employees lead to satisfied customers[51]. Also, employees need to be empowered to instill confidence in guests. This can be achieved by giving them the authority and responsibility to operate when managers are not around. Finally, the Ministry of Tourism and its implementing body, Ghana Tourism Authority must also strengthen their monitoring of the hotel industry.