-
Paper Information
- Next Paper
- Previous Paper
- Paper Submission
-
Journal Information
- About This Journal
- Editorial Board
- Current Issue
- Archive
- Author Guidelines
- Contact Us
International Journal of Sports Science
p-ISSN: 2169-8759 e-ISSN: 2169-8791
2016; 6(1A): 25-30
doi:10.5923/s.sports.201601.05

Relationship between Body Composition, Anthropometry and Physical Fitness in Under-12 Soccer Players of Different Positions
 Abstract
 Reference
 Full-Text PDF
 Full-text HTML
Jorge Aurélio1, Eduardo Dias1, Tiago Soares1, Gonçalo Jorge1, Mario André da Cunha Espada1, 2, Dalton Muller Pessôa Filho3, Ana Pereira1, 4, Teresa Figueiredo1
1Polytechnic Institute of Setubal, School of Education, Setubal, Portugal
2Interdisciplinary Centre for the Study of Human Performance, Lisbon, Portugal
3São Paulo State University, UNESP, Bauru, Brazil
4Research Centre for Sport, Health and Human Development (CIDESD), Vila Real, Portugal
Correspondence to: Mario André da Cunha Espada, Polytechnic Institute of Setubal, School of Education, Setubal, Portugal.
| Email: |  |
Copyright © 2016 Scientific & Academic Publishing. All Rights Reserved.
This work is licensed under the Creative Commons Attribution International License (CC BY).
http://creativecommons.org/licenses/by/4.0/

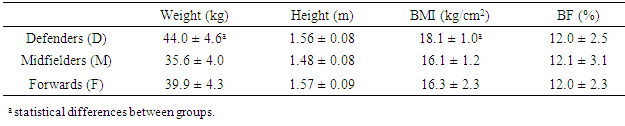
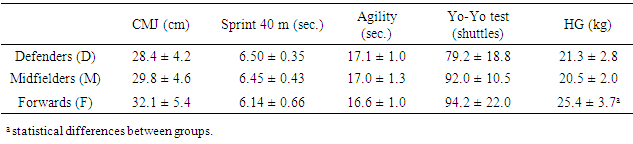
This study aimed to investigate the relationship between body composition, anthropometry and physical fitness in under-12 soccer players who play in different positions. Eighteen players underwent a battery of tests, in body composition and anthropometry significant differences were observed in weight (44.0 ± 4.6 vs. 35.6 ± 4.0 kg; p = 0.04) and body mass index (18.1 ± 1.0 vs. 16.1 ± 1.2 kg/cm2; p = 0.01) between defensive and midfield players. In physical fitness differences occurred between the results in handgrip strength between defenders and forwards (21.3 ± 2.8 vs. 25.4 ± 3.7 kg; p = 0.04) and midfielders and forwards (20.5 ± 2.0 vs. 25.4 ± 3.7 kg; p = 0.04). Correlations occurred in the soccer defenders between body fat and the result of the agility test (r = -0.85, p <0.01). In the midfield players there was a correlation between height and countermovement jump (r = -0.91, p <0.05). It was also observed in the forward players a correlation between speed and agility (r = 0.88, p <0.05) and between agility and other two variables, body fat (r = 0.84, p <0.05) and handgrip strength (r = -0.93, p <0.01). A positive relationship between the aerobic performance and countermovement jump was also observed (r = 0.96, p <0.01), and a negative relationship between the aerobic performance and weight (r = -0.88, p <0.05). Under-12 soccer players should be involved in specific strength training and functional performance evaluated using scientific instruments for talent identification and training control.
Keywords: Body Composition, Anthropometry, Physical Fitness, Soccer, Player Positions
Cite this paper: Jorge Aurélio, Eduardo Dias, Tiago Soares, Gonçalo Jorge, Mario André da Cunha Espada, Dalton Muller Pessôa Filho, Ana Pereira, Teresa Figueiredo, Relationship between Body Composition, Anthropometry and Physical Fitness in Under-12 Soccer Players of Different Positions, International Journal of Sports Science, Vol. 6 No. 1A, 2016, pp. 25-30. doi: 10.5923/s.sports.201601.05.
Article Outline
1. Introduction
- Over the years, soccer game became extremely popular among the worldwide population, resulting in an increase in the number of season competitions and games, involving highly prepared and specialized players. Specific physical fitness of the athletes, among which agility, speed or strength, deserve specific approach and detailed analysis in scientific research. Soccer is a team sport, involving many players, that requires an efficient collective organization and, simultaneously, the specific development of each player based on the individual and group perspective, at this level, the or sector position point of view. In research developed in this sport, players are divided into four groups: goalkeeper, defenders, midfielders and forwards [1, 2].Morphological characteristics [3, 4] and tactical, physical, and technical skills [5-7] successfully discriminate soccer players by competitive level and position. Among the youngest, elite youth players are taller and heavier than non-elite peers [8-10], and perform significantly better on sprinting and jumping tests [10, 11], as well as in soccer-specific tests of dribbling and juggling [12].Frequent involvement with the ball and successful performance in skill-related activities are important determinants of success in soccer [4, 12, 13]. Agility and intermittent endurance appeared to distinguish elite from non-elite central defenders, midfielders and forwards. Also power and speed usually support the decisive decision-making situations in professional football, a high degree of stress is imposed on the neuromuscular system of players to enable them to cope with these essential force-based actions required during training and competition (e.g., accelerations and decelerations) [14].It is common sense that the most intense match periods and worst-case match scenarios are associated with periods of high mechanical and metabolic stress. In fact, recently developed techniques of match analysis provide a body of evidence that supports the belief that neuromuscular demands of training and competition are higher than initially suspected [14] and give further support to the viewpoint that strength/power-related qualities are crucial for high-level performance. Therefore, speed and power are important components of soccer specific fitness training [15, 16].The team sport games, such as soccer, are associated to plenty of sprints also speed and directions changes are key features in this type of sports [17]. Players must adapt to the physical demands of the game and moderate to high levels of speed, agility, and aerobic endurance. These have been described as important physiological qualities for elite soccer as the ability to tolerate systematic training is also clearly important [4]. Players like Lionel Messi or Cristiano Ronaldo, considered currently the world best, are often considered as talent individuals due to capacities as strength, speed and agility. This attributes seem to be crucial to the performance of the player, since they are presented in various game actions, such as pass, run and dribbling.The body composition of a soccer player can also have an impact on his performance. Several studies have shown high levels of correlation between the body fat percentage (BF%) and athletic performance [18, 19], elite players have BF% between 7 and 19% [2, 20]. Also in the elite, forwards are the fastest players and run the greatest distances in sprint during a soccer game [2].Different studies showed that in soccer, power of the lower limbs evaluated by the vertical jump is between 38-45 cm [21-23]. However, Wisløff et al. [1] reported values of 50-55 cm in elite soccer players. In the same study, forwards and defenders jumped more than midfield soccer players. In young players, lower values for the vertical jump have been reported [24], but what is observed is that the vast majority of the literature is related to soccer at elite level, not youth level. Thus, this study aimed to investigate the relationship between body composition, anthropometry and physical fitness in under-12 soccer players who play in different positions.
2. Methods and Procedures
2.1. Subjects
- Eighteen male soccer players under-12 of a historical portuguese club of the first division were involved in the study. The sample included players aged between 11 and 12 years and divided by field position, 6 defenders (D), 6 midfielders (M) and 6 forwards (F). The study was conducted in the final stage of the season, but the players were still in a competitive phase. All measures were evaluated in two sessions after a simple warm-up of 10 minutes duration. The study was approved by the local University Ethical Committee, and conducted in accordance with the 1975 Declaration of Helsinki. Parents/Guardians filled and signed a consent declaration authorizing the participation.
2.2. Procedures
- In the first session anthropometric measures and strength performance in the lower limbs were performed. Body mass and whole body fat were assessed through a bioelectric impedance analysis method (Tanita BC 420S MA, Japan). The strength of lower limbs were determined using Ergojump System (Byomedic, SCP, Barcelona, Spain) which allowed each athlete to perform three jumps in countermovement (CMJ) to evaluate the maximum jump height (better record of three jumps - cm). In the final of the session, maximal isometric strength was evaluated using a digital dynamometer, handgrip (HG), (Camry 90 kg) to assess the strength in the dominant hand.One day latter, in the second session, agility was evaluated using the Illinois Agility Run Test, designed to measure the agility of the athlete to run in different directions and angles, and therefore, perform the reality of a soccer player during a game. Athletes run 10-m distances performing zig-zag movements between four equally spaced cones (3.3 m). The soccer players were instructed to perform the fastest possible route through all the cones [25].The speed was evaluated by a 40 m sprint test measured with a stopwatch (Golfinho Sports MC 815, Aveiro, Portugal) and the results of aerobic fitness test were obtained thought the Yo-Yo Endurance Test [3]. Cones mark two lines of 20 m and the subjects start with their foot behind one of the lines, and begin running when instructed. They continue running between the two lines, turning when signalled by the recorded beeps. After each minute or so, the pace gets quicker. If the line is not reached in time the subject must run to the line turn and try to catch up with the pace within 2 more ‘beeps’. The test is stopped if the subject fails to catch up with the pace within the two ends and the number of shuttles assumed.
2.3. Statistical Treatment
- Data analysis was conducted in Excel software and Statistical Package for Social Sciences (SPSS version 20.0, Chicago, IL). The normality of the distributions was assessed with the Shapiro-Wilk test. Parametric and non-parametric statistics were selected accordingly. Standard statistical methods were used for the calculation of means and standard deviations. The Kruskall-Wallis was used to compare the results players of different soccer position. Ranking Spearman Correlation Coefficients (rs) were calculated between position and all variables. Significance was accepted at the p<0.05 level.
3. Results
- Significant differences were observed between defenders and midfielders in weight and BMI (p = 0.04 and p = 0.01, respectively) (Table 1). Differences were observed in HG between defenders and forwards, also between midfielders and forwards (p = 0.04, Table 2).
|
|
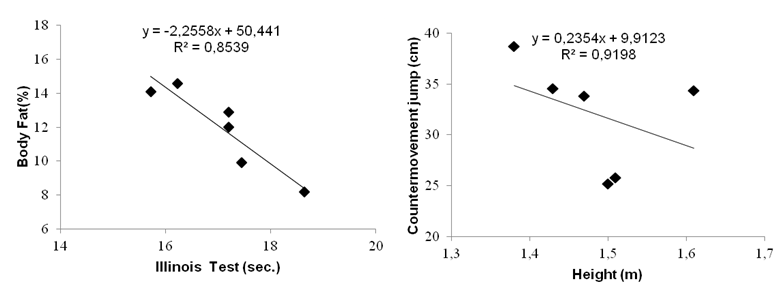 | Figure 1. Linear regression between agility test and BF% of the defensive players (left) and between countermovement jump and height in the midfield players (right) |
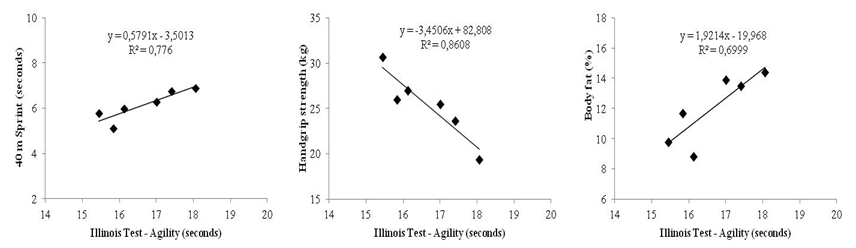 | Figure 2. Linear regression between agility test (Illinois Test) and speed, handgrip strength and body fat % in the forward players |
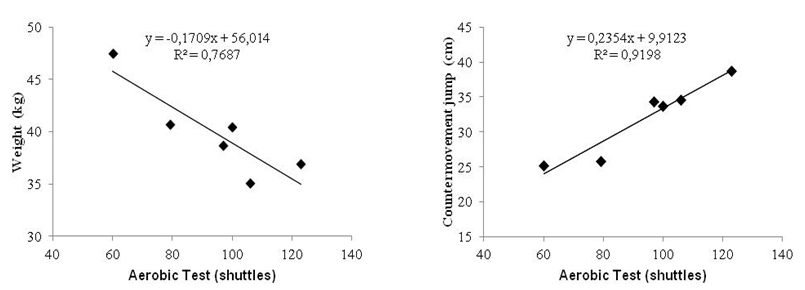 | Figure 3. Linear regression between aerobic fitness test (Yo-Yo test) and weight (left) and countermovement jump (left) in the forward players |
4. Discussion
- This study aimed to investigate the relationship between body composition, anthropometry and physical fitness in under-12 soccer players who play in different positions. This study showed that at the level of physical fitness, forward players showed better results compared to other teammates, contrarily to what was previously observed in non-professional players between 14 and 21 years in a study where midfield players evidenced higher physical fitness when compared to defenders or forwards [26]. To determine the physical characteristics associated with power and speed in youth soccer players, there are many available field and laboratory tests [27]. Analysing the data from these tests can aid coaches or athletes in developing soccer-specific fitness programs, promoting anthropometric changes, and identifying players with athletic skill sets that increase their probability of sport success [28]. It was previously indicated that a low-volume, high-intensity approach, such as sprint interval training, may favour the maintenance of muscle fiber phenotype associated with strength and power capabilities [29]. Interestingly, the addition of a long-term strength/power training program to normal soccer training routines seems to result in a higher long-term increase in the physical performance of elite youth players [30, 31].The importance of sprinting in professional soccer is well established and the need for speed is clear [33, 34]. Also, associations between neuromuscular qualities (e.g., CMJ peak power) and repeated sprint ability performance have been observed [34]. Studies of adolescent (13–15 years) and adult players showed that defenders and goalkeepers tended to be the tallest and heaviest, while midfielders and forwards tended to be the shortest and lightest [26, 35, 36]. Central defenders and forwards perform better in vertical jump than midfielders [7], this should be related with the fact that physical contact and jumping to contest aerial balls are expected among goalkeepers and central defenders [37].It was observed in the present study that the defensive players despite having a similar average values of BF% and BMI compared to colleagues in other positions, evidenced a higher total weight value, situation that may affect the aerobic performance as it was visible through the correlations and linear regression between body composition, aerobic fitness and agility. Although, results with under-12 years players must be carefully evaluated in agility because some of them doesn’t perform the correct running technique and it seems that this is very important to achieve a good result [38]. Furthermore, in the present study the relationship between BF% and performance in Illinois Test (agility) was negative.Rebelo and Oliveira [39] associated the speed with the muscle power of professional soccer players, the sample consisted of 23 professional participants of the Portuguese Super League (age: 25.7 ± 3.9 years; weight: 76.1 ± 6.6 kg; height: 179.5 ± 7.2 cm; MG: 8.2 ± 7.2%). The agility was evaluated in a 20 m test with successive changes of direction at the end of each fraction of 4 m. Muscle strength of the flexor and extensor muscles of the knee was evaluated in isokinetic dynamometer. It was concluded that maximum power of the lower limbs is fundamental to the performance in the agility tests.Chamari et al. [40] showed that the performance (time) of 20 m sprints correlates with the peak of the jump velocity, while the performance in the 10 m showed no relationship. In the shuttle test, several sprints of 20 m are performed, which seems to explain the significant correlation observed in the present study between the shuttles and the CMJ in the forward soccer players. Interestingly, the relationship between agility and speed was positive and between agility and HG turned out to be negative. Nevertheless, in total physical fitness the present data showed differences in HG test only between defenders and forwards and midfielders and forwards. This means that the field position may induce some differences also between the strength in the upper limbs, specifically maximal strength. Besides, isometric strength of the forearm might related to other high-force muscular performance in other muscles groups and probably support the main muscular actions in the total body as running, heading the ball or during the shot to goal.Body composition and anthropometry data seems to influence the physical abilities of in young soccer players, however the differences between players of different positions at these age-groups need to be carefully evaluated because as the present data showed, other abilities as technical skills could affect total performance.
5. Conclusions
- Some differences at the level of body composition, anthropometric profile and physical fitness exist between players of different soccer positions. The training process of under-12 years soccer players must become more specific according to the requirements of position, it is also important a good talent identification process. This study presents some limitations, as the number of subjects in each group and all defender players were not separated into central and lateral defenders (fullbacks). More physical tests are also needed to a total functional performance analysis. However, this study raises the relevance of using scientific instruments in the training process and the importance of specific training implementation in soccer, namely strength training. We recommend that in the future more research in this area should be conducted using physiological instruments and biomarkers toward a more concrete and individual understanding of the potential of each individual player and group of players selected by soccer position.