-
Paper Information
- Next Paper
- Previous Paper
- Paper Submission
-
Journal Information
- About This Journal
- Editorial Board
- Current Issue
- Archive
- Author Guidelines
- Contact Us
International Journal of Sports Science
p-ISSN: 2169-8759 e-ISSN: 2169-8791
2016; 6(1A): 1-7
doi:10.5923/s.sports.201601.01

Network of Interpersonal Interactions in Roller Hockey
 Abstract
 Reference
 Full-Text PDF
 Full-text HTML
Vasco Vaz1, Gonçalo Dias1, José Gama1, Micael Couceiro2, 3, João Vantente-dos-Santos1, 4, João Rafael1, José Alberto Areces Gayo5
1Faculty of Sport Science and Physical Education, University of Coimbra, Coimbra, Portugal
2Artificial Perception of Intelligent Systems and Robotics (AP4ISR), Institute of Systems and Robotics (ISR), University of Coimbra, Coimbra, Portugal
3Ingeniarius, Ltd., Portugal
4Lusófona University of Humanities and Technologies, Faculty of Physical Education and Sport, Lisbon, Portugal
5Faculty of Sport Sciences and Physical Education, University of Galiza, Galiza, Spain
Correspondence to: Gonçalo Dias, Faculty of Sport Science and Physical Education, University of Coimbra, Coimbra, Portugal.
| Email: |  |
Copyright © 2016 Scientific & Academic Publishing. All Rights Reserved.
This work is licensed under the Creative Commons Attribution International License (CC BY).
http://creativecommons.org/licenses/by/4.0/

The aim of this study was to identify the number of intra-team interactions and to examine which athletes have more interactions with their peers through the use of pass. We analyzed the preferential connectivity levels of specific players, highlighting their interactions and identifying those who had the greatest influence on ball movement. The sample consisted of 8 Portuguese, highly trained male roller hockey players (aged between 14.5 and 16.5 years), selected to participate in the 2007 and 2008 editions of the U-17 European League. Results showed that player 8  and player 6
  presented the highest global rank of the team in terms of promoted interactions.Generally, these results permitted the identification of the centroid player and his role in a team activity. It was concluded that roller hockey could be described as an open system able to create clusters of connectivity between players. The herein presented findings may help coaches and sport scientists to better understand how the collective behaviour is orchestrated.
Keywords: Interpersonal coordination, Interaction, Performance, Young athletes
Cite this paper: Vasco Vaz, Gonçalo Dias, José Gama, Micael Couceiro, João Vantente-dos-Santos, João Rafael, José Alberto Areces Gayo, Network of Interpersonal Interactions in Roller Hockey, International Journal of Sports Science, Vol. 6 No. 1A, 2016, pp. 1-7. doi: 10.5923/s.sports.201601.01.
Article Outline
1. Introduction
- Networks of individual and collective decisions can be used to quantify the performance of individual players in a team activity [6, 10, 15, 27]. As in other team sports (e.g., basketball, handball or soccer), the performance structure of roller hockey is complex [13] and, therefore, depends on player’s decisions that occur in contexts and environments with high variability and instability [12, 14, 27].Notational analysis of highly trained male adolescent roller hockey players indicated an average of 130 ball possessions per 50-min game [15]. The majority of ball possessions derived from interpersonal interactions between players [15], suggesting this trait as an important component of hockey performance.Network analysis was recently used to map actions and interactions of players during a game of water polo [19]. The concept has its origins in Social Sciences and Biology, among other areas of research [1, 2, 16, 16]. Applied to sport, enables the possibility to investigate not only the number of interactions that occur in a given period of space and time, but also, to understand team’s coordination patterns in the course of individual and collective dynamics.Research dealing with these theoretical assumptions in the context of sport is rather limited [19, 24, 28] and does not systematically consider the broader scopes that go beyond the usual prospective or retrospective actions of success or failure [23]. Behavioral information that can optimize players and teams effectiveness are of prime interest to many of those involved in the sport [4].Therefore, the purpose of this study was to identify the number of intra-team interactions and to examine which athletes have more interactions with their peers through the use of pass. A further aim was to examine the influence of interpersonal actions on competitive performance and the final result of the game. Weanalyzed the preferential connectivity levels of specific players, highlighting their interactions and identifying those who had the greatest influence on ball movement [10]. It was hypothesized that the centroid player maintains the connectivity of the whole team. It was also hypothesized that roller hockey could be described as an open system able to create nets or clusters of connectivity between players.
2. Material and Methods
2.1. Participants
- The sample comprised 8 outfield male competitive roller hockey players aged 14.5-16.5 years. These players represented the Portuguese national team, which participated in the 2007 and 2008 editions of the U-17 European Championship. Players were classified as defenders (n = 4; players 3, 4, 6 and 8) and forwards (n = 4; 2, 5, 7 and 9). All players participated in regular training sessions at their clubs (4–6 sessions per week, ~360–510 min per week) and typically played 1 or 2 games per week over a 10-month period (mid-September to June). All participants had been engaged in formal training and competition for at least 5 years. The national team preparation for the European Championship occurred 4 weeks before the competition, and the training volume increased to 15 sessions per week (~1050 minutes) in the first two weeks, and then decreased to 10 sessions per week (~825 minutes) in the last two weeks.
2.2. Measures and Procedures
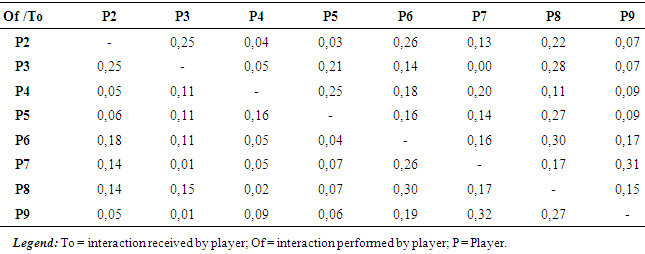
- Data collection included five games of the European Championship and 1039 collective offensive actions. Two digital cameras Sony Mz 25 DCR70 were used and images were processed at 25 Hz. Register grates that supported the coding of images to stock frequencies and their times were prepared in accordance with the work presented by Mendo and Argilaga [15]. After registration in the game observation grates, we proceeded to the registration of the data in the Excel spreadsheet, which was design for this purpose. The categorization of variables aimed an overall assessment of all the actions, verifying the analytic contribution of each player in their actions. The data was represented by a nonsymmetrical weighted adjacency matrix
 , in which the upper-triangle corresponds to the number of pass actions made, while the lower-triangle corresponds to the number of pass actions received (the diagonal that subdivides the matrix is ignored). As an example, the number of pass actions player
  does with player
  is represented by
  which may, or may not, be the same as the number of pass actions player
  did with player
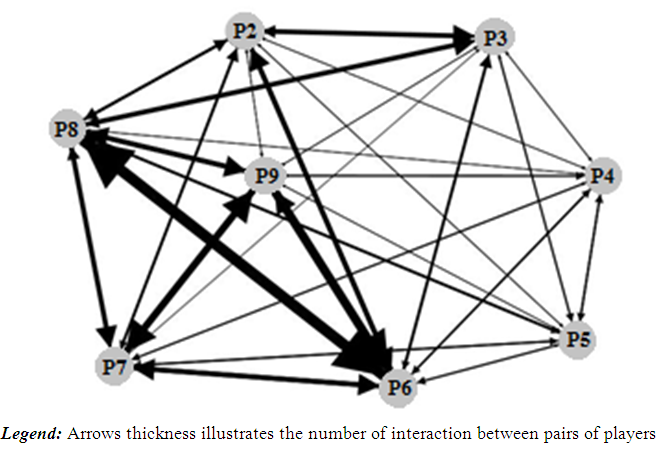
 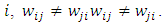 Based on this matrix, we adopted a schematic representation of a roller hockey (see results section, Figure 2) to identify, and later definition of variables involved in the typology of game. The schematic representation of a roller hockey was based on the one already used by Mendo and Argilaga [15], which has split up the rink in eighteen areas with six sectors and three side lanes. During the offensive process roller hockey player’s act in depth and breadth using quick actions of progression with the ball or pass [15]. Nevertheless, pass is the technical element that best distinguishes the interaction between players [4, 10, 19, 23].The data obtained were inserted on an Excel Template, version Node XL program 1.0.1.164. Through this application, it was possible to get connectivity matrices and establish the mapping of interactions that took place between players in the context of the match. To this end, were created two arrays of double-entry, which aimed to present the interactions between players that resulted from passes established in different parts of the schematic representation of a roller hockey. All procedures used in this study were approved by the Ethics Committee of the Faculty of Sport Sciences and Physical Education, University of Coimbra, following the guidelines of the American Psychological Association for research involving human participants. All participants provided informed consent to take part in this research.Finally, to better understand the net of interactions, which emerge from player of the same team, we used the relative frequency probability method, by the following equation [20]:
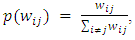 | (1) |
 is the probability of a given interaction
  to occur between player
  and
and  It needs to be noted that probability of an interaction occurs, as it is defined, results on a relative frequency of occurrence. Thus, the probability is a number such that:
  Besides the probability of interaction between pairs of players, we computed an intra-player network concept (network property of a node), denoted as the centroid players). To computed is network concept, one can create a new relative weighted adjacency matrix
 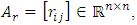 defined as:
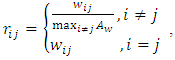 | (2) |
 for
for  with
with  The denominator
  corresponds to the larger connectivity between players, the players that interact the most together. Note that, as the weighted adjacency matrix
  is also nonsymmetric.Afterwards, one needs to compute a widely used concept for distinguishing a vertex of a network (cf. [11]), called the connectivity (also known as degree). The connectivity of player
  can be defined by:
 | (3) |
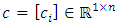
 is the vector of the connectivity of players. Note that there will be a vector for the pass actions made and another for the pass actions received. In other words, player
  may present a high connectivity with the team due to the actions he make, but may not present a high connectivity with the team regarding the pass actions received.The most cooperative player, or players, can be found by finding the index/indices of the maximum connectivity for the pass actions made and received as:
 | (4) |
 as:
as: | (5) |
 is the vector of the relative connectivity of players. Note, once again, that there will be a vector for the pass actions made and another for the pass actions received.In team sports context, one could interpret the scaled connectivity as a measure of cooperation level of a given player in which high values of
  (as
(as  tends to 1) indicate that the
  player works with most of the other teammates. However, a player may present a high connectivity with other players but may be unable to produce consensus among his non-direct teammates. In other words, he may interact with several other players directly that does not directly interact with each other. Therefore, the clustering coefficient of player
  offers a measure of the degree of inter-connectivity in the neighborhood of player
  , being defined as:
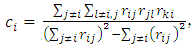 | (6) |
 is the vector of the clustering coefficient of players. Note that there will be a vector for the pass actions made and another for the pass actions received.The relationship between the clustering coefficient and the connectivity has been used to describe structural (hierarchical) properties of networks [22]. As a team sports modality, a weighting distribution of the cluster coefficient and the connectivity between players should be taken into account. Therefore, a weighting function, denoted as global rank, was defined as:
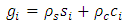 | (7) |
 , such that
 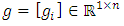 is the vector of the global rank of researchers. Note that there will be a vector for the pass actions made and another for the pass actions received. Also note that the scaled connectivity
  was chosen over the unscaled one
  since it lies between 0 and 1 as the clustering coefficient, thus resulting in
  Taking into account that the main objective of the hockey team, as any other collective sport, is to give priority to the collective performance (the overall interaction between players), one can ponder a balanced consideration of
 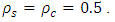 The top-ranked player (s), the one (s) presenting the higher
  will then be denoted as the centroid players. Within sports team, the centroid player(s) could be considered as the player(s) who maintain(s) the connectivity of the whole team.
3. Results
- As shown in Table 1, 1039 interactions were noted between youth players of national roller hockey team, regarding the studied game-related statistics. Note that, as previously stated, interactions made and received correspond to passes made and received between pairs of players.
|
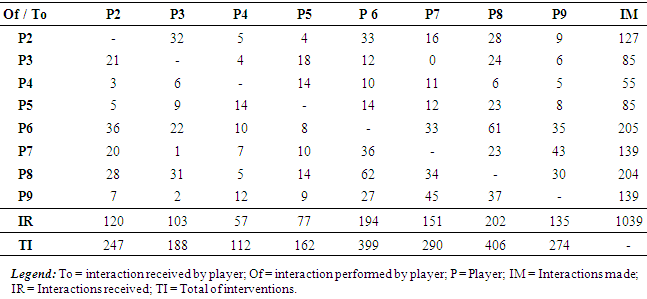
 | Figure 1. Level of interaction and network between players on offensive phases of the game |
 | Figure 2. Transmission of the ball done by players, and interactions zones of the team |
|
|
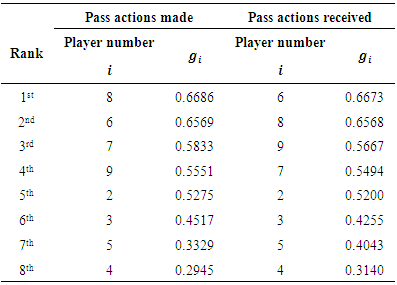
 and player 6
  presented the highest global rank of the team in terms of promoted interactions. Moreover, player 6
  and player 8
  had the higher global rank of the team in terms of interactions passing through them.
 4. Discussion
- The purpose of this study was to identify the number of intra-team interactions and to examine which athletes have more interactions with their peers through the use of pass. A further aim was to examine the influence of interpersonal actions on competitive performance and the final result of the game. We analyzed the preferential connectivity levels of specific players, highlighting their interactions and identifying those who had the greatest influence on ball movement. In that sense, results show that the centroid player can be considered as the player who maintains the interaction of the whole team [17-19].Considering the results of recent studies of network analysis [10, 25], there’s a need to understand the intra and inter-individual behaviours that are associated with team sports. They can emerge not only from actions and strategies of individual players, but also from group tactical decisions that influences the performance of the players in the game [19, 21]. Therefore, players have to self-organize their performance to overcome game’s “constraints” (e.g., adversary, public, etc.) and help the team to succeed [10, 14].While more data on individual and group level are required to drawn definitive conclusions, the results of this study are new insights to the understanding of the roller hockey game. In fact, our results describe precisely the player’s level of interaction and network between players on offensive phases of the game.Regarding the zones of preferential interaction used by players during the offensive phase, we observed that there is a predominance of offensive midfield interactions, particularly in the right and left side of the sector 4 (4L-4R; 4R-4L). The same trend was noted for longitudinal observation of midfield side corridors (4L-5L; 5L-4L; 4R-5R; 5R-4R) and for the finalization zone (5C). It is worth noting that the observed trend of ball movement tended to be in the beginning of offensive midfield and inside corridors.The results extend previous findings demonstrating that that some players tend to preferably interact with certain players in certain areas of the rink. Therefore, the results put forward in this paper suggest a stronger connectivity between some players against others, which is consistent with previous research in team ball sports [17-19]. In this sense, there are some issues that deserve our attention, namely: why is this type of interaction characteristic of certain players? What are the reasons underling those occurrences? Is this agame model imposed by coach? Is this a self-organized process that acts independently without external feedback, in which players interact as a dynamic system? While acknowledging these questions, McGarry et al.’s [14] study, suggest the existence of an "attractor" or preferred state that influences the coordinative structure of the team along with its competitive performance. Additional studies are needed to critically obtain contextual information from players through the possibilities of game (affordances), verifying the extent to which this information may or may not influence actions of the actors on the ground [6, 25].Although there are no studies in roller hockey that allow us to compare the present data, works devoted to basketball and soccer (e.g., [3, 7, 9]), found similar game-related statistics and patterns. Therefore, we can assume that this approach can be useful to measure tactical performance in youth roller hockey players. The centroid analyzes represented an essential resource bridging the gap between collective behavior and the flow of the game [8]. This study also shows that the collective dynamics of this youth roller hockey team includes numerous episodes and instances of cooperation, which act in a multidimensional perspective. Accordingly, future research should focus not only the number of interactions that occur in a given space and time period, but also to establish the dynamic pattern of teams’ coordination in the course of individual and collective actions. Traditional notational analysis is essentially a means of recording events so that there is an accurate and objective record of what actually took place [4]. It’s undoubtedly importance in the range of match analysis techniques, can be complemented with the present qualitative assessment method. The present approach makes it possible the identification of player´s performance and the team game dynamics pattern for the observable coordinative structure [14, 19, 27].
5. Conclusions
- Considering the number of intra-team interactions and the preferential connectivity levels, results showed that player 8
 and player 6
  presented the highest global rank of the team in terms of promoted interactions. Generally, these results permitted the identification of the centroid player and his role in a team activity.Given the above, it was concluded that roller hockey could be described as an open system able to create clusters of connectivity between players.This is something that can be applied to other team sports, such as football, handball or basketball, because through this network of interactions, coaches can further understand the team dynamics and optimize its performance to the objectives to be achieved during competition. The herein presented findings may help coaches and sport scientists to better understand how the collective behaviour is orchestrated.
6. Practical Application
- This study has practical implications for coaches since it proposes a multidimensional analysis of the roller hockey. Such analysis of professional roller hockey matches is carried out through inter-player interactions (networks), in order to identify the centroid player and his central role in the team collective dynamics. Furthermore, such an approach can be complemented with other indicators and other methods in order to increase the explanatory power of the variables presented in this study. For this purpose, one should further analyse these and other sport performance indicators in professional roller hockey teams, transversal to other team sports, using, for this intent, a robust and larger sample in terms of number of games and players.
ACKNOWLEDGEMENTS
- This research was supported by the Portuguese Foundation for Science and Technology (FCT) under the grant SFRH/BPD/99655/2014. JVdS was partially supported by a grant from the Portuguese Foundation for Science and Technology: SFRH/BPD/100470/2014.