-
Paper Information
- Next Paper
- Previous Paper
- Paper Submission
-
Journal Information
- About This Journal
- Editorial Board
- Current Issue
- Archive
- Author Guidelines
- Contact Us
International Journal of Sports Science
p-ISSN: 2169-8759 e-ISSN: 2169-8791
2014; 4(6A): 42-48
doi:10.5923/s.sports.201401.06
Kinematic Profile in Soccer Players
 Abstract
 Reference
 Full-Text PDF
 Full-text HTML
Gabriele Mascherini1, 2, Andrea Cattozzo1, 2, Giorgio Galanti2, Stefano Fiorini1
1Italian Football Athletic Trainers Association, Florence, Italy
2Sports Medicine Department, University of Florence, Florence, Italy
Correspondence to: Gabriele Mascherini, Italian Football Athletic Trainers Association, Florence, Italy.
| Email: |  |
Copyright © 2014 Scientific & Academic Publishing. All Rights Reserved.
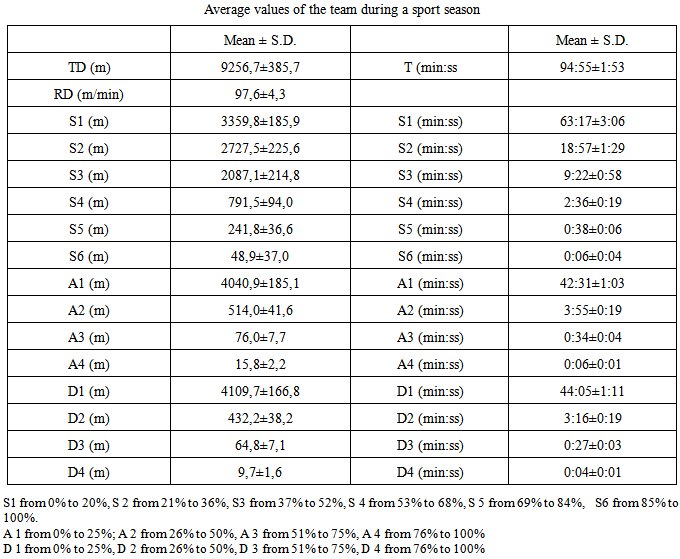
Soccer match analysis was established to evaluate tactical aspects of the game, now this assessment is utilized for physical effort. This has been done to date mainly by video interpretation of the matches. The aim of this study is to analyze the official matches of a regular soccer season with a wearable device as Global Positioning System. Thirty official games of a team of sixth division of Italian Football League were assessed via GPS system. Parameters of volume (time as minutes, distance as meters and relative distance as meters/minutes) were calculated directly from the instrument, while the values of intensity (speed as m/sec, acceleration as m/sec2 and deceleration as m/sec2) have been indexed respect to the maximum individual. In addition a tactical analysis for each roles of players were done. Results shows lower values of total distance (9256.7±385.7 m) and relative distance (97.6±4.3 m/min) than previous studies, while the values of speed, acceleration and deceleration confirm the data present in the literature. Tactical analysis shows high speed for the forward, medium speed for midfielders and low speed for lateral defenders. No differences between the different tactical roles for acceleration analysis. Decelerations are mainly represented in midfielders and lateral forward. A new approach has been used for an individualized threshold for speed, acceleration and deceleration. Different kinematic data was found among different players respect to tactics analysis.
Keywords: GPS, Soccer, Match analysis, Tactical analysis
Cite this paper: Gabriele Mascherini, Andrea Cattozzo, Giorgio Galanti, Stefano Fiorini, Kinematic Profile in Soccer Players, International Journal of Sports Science, Vol. 4 No. 6A, 2014, pp. 42-48. doi: 10.5923/s.sports.201401.06.
Article Outline
1. Introduction
- The history of match analysis in soccer originated in 1991, when, for the first time, two studies reported some of the parameters (mainly total distance ran) with regards to physical demands of each player during the 90 minutes of a soccer match [1, 2].Because soccer federal laws prevent players from wearing any technological devices during official soccer matches, video analysis is the main method currently used to date. Video analysis of matches was introduced into soccer to verify the roles assigned to each player, and the real performance of tactics that were decided by the coach. This method was then used to evaluate physical performance parameters such as total distance covered (m), speed (m/sec) and acceleration (m/sec2) [3, 4].From 1991 to 2013 many studies on the issue were conducted, finding uniform results on the metres covered on average by a player during a match, but there are still many differences in terms of “speed” and “acceleration/ deceleration” of soccer players. For “speed” in a soccer match, the researchers agreed to create six zones with increasing intensity, but the identification and the description of these zones is still unclear [5].There are few studies on the evaluation of “acceleration”, probably due to the intrinsic errors of the devices without a built-in accelerometer. Many studies about “acceleration” in soccer are based on sprint tests during a training session and not on entire official matches [6, 7].Recent studies have introduced the use of the Global Positioning Systems, better known by the acronym GPS, as a tool for analyzing the performance of athletes [8]. For some sports, such as Australian Football, data on official games are available in the literature [9, 10], while for soccer there are only two studies [11, 12].Recent studies completed with the GPS systems show that today the attention is directed to an ever greater individualized assessment [13]. One method is to identify the physical abilities of each athlete on the team during his performance by focusing on “speed”, “acceleration” and “deceleration” [13]. Another approach is to analyze the various tactical tasks of each role within team sports [14].Video match analysis is the main method to evaluate the performance of soccer players during official matches, while GPS technology is the main method to evaluate training sessions. Different methods of detection of the same data should be compared to validate the superposition of the results [12].The principal aim of this present study was to report values of soccer performance in official matches, with the use of a GPS device. The second aim was to analyze the differences in activity of players according to their role, then the difference of physical effort in the various tactical aspects in soccer.
2. Methods
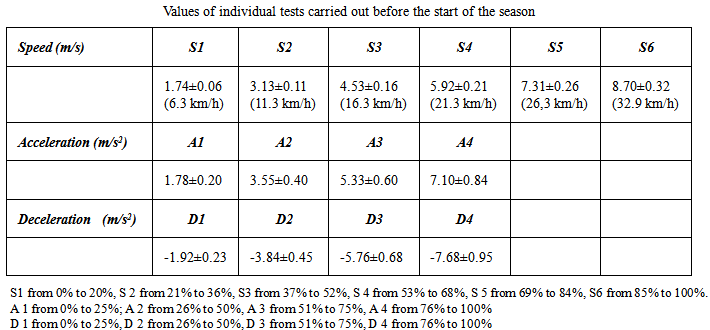
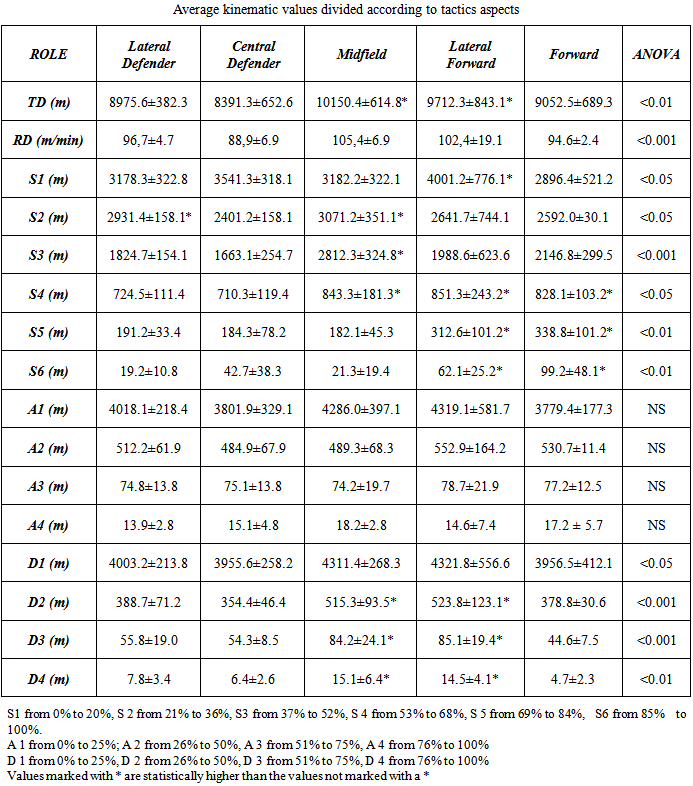
- The present study is observational and involved an Italian Soccer League team playing in the sixth division (called Campionato di Eccellenza). The study received Ethics approval from Italian Soccer Federation, the protocol allows players to wear GPS devices during all official matches of the regular season 2013/2014, has been approved by the Regional Committee. All participants provided a formally documented and witnessed oral informed consent as per the declaration of Helsinki. During the week before the first official match tests were completed to determine the maximum value of speed, acceleration and deceleration of each individual team member: each player, wearing shirts with the appropriate GPS equipment, had to complete three 50m sprints to determine their maximum speed, and four 20m shuttle sprints to determine their maximum accelerations and maximum decelerations (table 1).Therefore 18 players of the team, (age 23.9±2.1 years, weight 74.1±5.7 kg, height 177.2±11.6 cm) who played at the beginning of the official matches, wore under their official shirts the GPS (K-Sport-Italy, sampling frequency 10Hz, position, distance and speed measurement; accelerometer: 100Hz, 16G Tri-Axis) and kept on GPS device for the time they played.At the end of the match data recorded was downloaded onto the laptop with the software Prozone Kinetic to analyze the data, all values were tabled and divided into the following categories:- total time of the game (T, min);- total distance covered (TD, m);- relative distance, defined as the ratio between total distance and duration (RD, m/min).In addition to these parameters, as suggested by previous studies, the values of speed and acceleration were divided into zones [5]:- speed, divided into 6 zones (S1, S2, S3, S4, S5, S6, m/sec);- acceleration, divided into 4 zones (A1, A2, A3, A4, m/sec2).- deceleration, divided into 4 zones (D1, D2, D3, D4, m/sec2);Each zone was calculated considering the value of individual maximum speed, individual maximum acceleration and individual maximum deceleration. There is still no consensus on the division of the speed (S), however we chose to keep the six zones mentioned in literature [6], but choosing these ranges:- S 1 from 0% to 20%,- S 2 from 21% to 36%,- S 3 from 37% to 52%,- S 4 from 53% to 68%,- S 5 from 69% to 84%,- S6 from 85% to 100%. With regards to the values of acceleration and deceleration for what is known to the authors this is the first work with a threshold approach, therefore four categories were chosen for every 25%, then the zones for acceleration (A) and deceleration (D) are:- A 1 from 0% to 25%;- A 2 from 26% to 50%,- A 3 from 51% to 75%,- A 4 from 76% to 100%- D 1 from 0% to 25%;- D 2 from 26% to 50%,- D 3 from 51% to 75%,- D 4 from 76% to 100%For an additional evaluation, as suggested by previous studies, the data reported at the relative values of speed, acceleration and deceleration in the different zones are also shown as a percentage of the total time of the game (T) and the total distance covered (TD) [15]. This is an observational study and the main purpose was to describe the activities of the player. For tactical analysis the roles of the players was initially assessed by the coach, then it was decided to divide the players in:- 2 Lateral Defender- 2 Central Defender - 3 Midfield - 2 Lateral Forward - 1 ForwardTherefore the averages and standard deviations were calculated into a new subdivision, and then tested by the ANOVA analysis for variance to establish any significant differences (p<0.05) between five different samples.30 official matches have been downloaded, then300 recordings were obtained. Were not included in the statistical analysis footballers replaced during the game. They were therefore excluded 72 recordings (19 lateral defender, 8 central defender, 21 midfield, 15 lateral forward, 9 forward): in conclusion 228 data records took part in this study.
3. Results
- The data obtained from tests before the season are reported in table 1, mean maximum values is 8.70±0.32 m/sec for speed, 7.10±0.84 m/s2 for acceleration, and -7.68±0.95 m/s2 for deceleration.
|
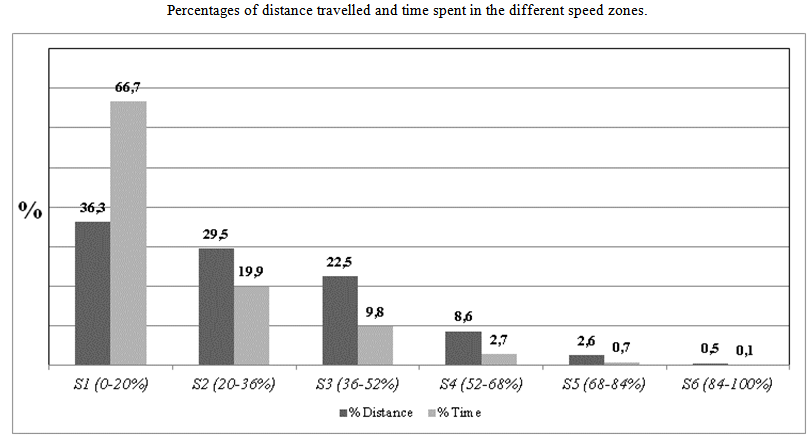 | Figure 1. Comparison between distance travelled and time spent in the different speed zones the percentage is given by the ratio between the different zones of distance (D) and time (T) |
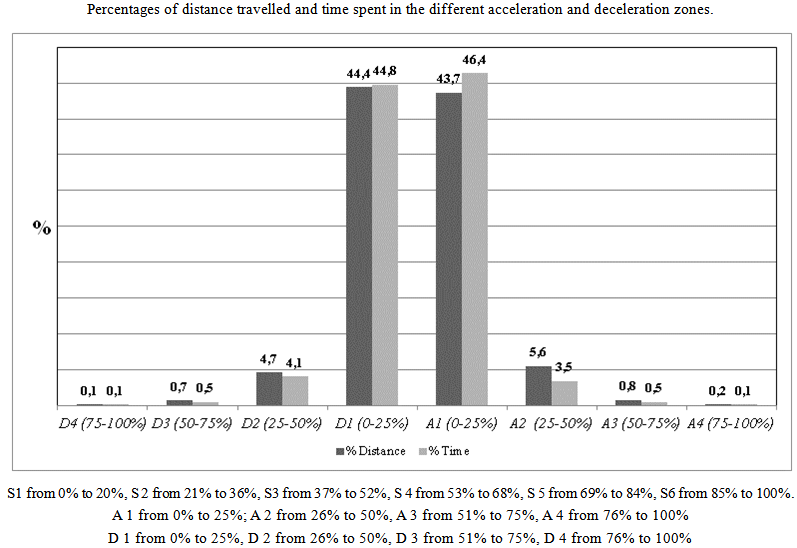 | Figure 2. Comparison between distance travelled and time spent in the different acceleration and deceleration zones. The percentage is given by the ratio between the different zones of distance (D) and time (T) |
|
4. Discussion
- Analyzing a game of soccer is more complex than a commitment of an individual sport. The evaluation of performance by the technical staff is the basis for the preparation of the next game, it is therefore crucial to have information as objective as possible: before this assessment was carried out only by observation, now it is possible to use technology, mainly video analysis [16]. So the debate on this topic in recent years has increased [17].This study provides additional information in the assessment of official soccer matches with GPS device. Respect previous carried out during competitive matches of elite soccer [12] (TD = 10532.4 m), the present study (TD = 9256.7 m) shows a lower total distance. In addition, this study confirms the differences in kinematic analysis among different players position, however, the difference of this study was not the same of previous study [11], probably due to a different tactical planning of the different team investigated.If we compare the results between this study with a GPS units in sixth division and studies reported with video analysis of top level athletes [16], you may notice a greater volume of workload at high levels, but the characteristics of intensity is comparable: probably because the characteristics of the sport influence the kinematic profile of soccer players while the different level of endurance performance influence the total distance covered [18].The approach to the analysis follows the trend of recent major studies on match analysis: maximum values of speed, acceleration and deceleration have been set, therefore this setting limited to recording artefacts due to too high values for a given athlete [19]. On this maximal value ranges have been set according to a percentage scale for each athlete to get a more personalized assessment, in respect to a range of standardized values which cannot represent the real intensity of the individual player.The results obtained from tests completed before the start of the regular season showed high values of maximum speed, but the data regarding the maximum values of acceleration and deceleration was the most interesting: 7.10±0.84 m/sec2 and -7.68±0.95 m/sec2. In fact in the present study, soccer players didn't achieve these maximum values during an official match, probably because the game requires this commitment only occasionally.The evaluation of speed predominantly (96.4% of T and 88.3% of TD) shows values below 16 km/h, corresponding to 52% of maximum speed: only a small portion of the game was played at high speeds.The interpretation of the different percentage in S1 (66.7% respect T versus 36.3% respect TD, figure 1) could be attributed to the space/time ratio at low speeds travelled a few meters compared to the time spent [16].The data relating to acceleration and deceleration mirror the two types of speed variation: in fact in this analysis, the majority of time and meter (around 90%) are completed at an intensity that fluctuates from -25% of the maximum deceleration and to 25% of the maximum acceleration (figure 2).Tactical analysis draws attention to a lot of information as shown from studies in other team sports [9, 10]. The evaluation of speed indicates how different areas of the field requires different kinematic commitment, deceleration data shown how to midfielders and lateral forward are required an amount of braking greater than the other roles. Result not expected was the substantial overlap of acceleration data among different tactics roles.A limitation of the present study is to investigate the soccer performance at a lower level of competition respect literature.
5. Conclusions
- Sports science in soccer is constantly changing as well as the methods used during the training in this sport [20]. Since the introduction of match analysis, the most common parameters in the literature are “total distance” and “relative distance”: the first one only provides information about the volume of physical effort; the second one can be considered a simple parameter estimating the intensity of physical activity.Soccer performance is characterized by the presence of the ball which influences the physical engagement with sudden accelerations and decelerations which must be considered in the estimation of workload, recently studies show these as the main parameters to be evaluated for the intensity in team sport, therefore total and relative distance take lesser value in the evaluation of physical effort in soccer players [21]. Studies carried out on acceleration and deceleration in soccer players have been done mainly through video analysis of the matches [17], the present study adds to the more recent made with GPS devices. The study of the physical effort following a tactic division by roles can provide interesting ideas on how to improve training methods according to the different natures of physical demand in sport games such as soccer, for example the intensity of the deceleration in midfield and in lateral forward.In conclusion, the present study provides a kinematic analysis of athletes during soccer match with a wearable system such GPS devices. This assessment was carried out used ranges in percentage of maximum values for a more individualized assessment.
Piratical Implications
- • Match analysis in soccer was done mainly from the video, an additional method allows us to compare the different parameters in order to have more reliable data.• With a proper kinematic profile of soccer players is therefore possible a higher accuracy in the modulation of the training loads.• The different physical demands in different tactical roles may allow coaches and trainers to a more individualized training program.
ACKNOWLEDGMENTS
- The authors did not receive any financial support for doing this analysis and presenting it in this report.
References
| [1] | Ali A, Farrally M., 1991, A computer-video aided time motion analysis technique for match analysis. J Sports Med Phys Fitness. Mar;31(1):82-88. |
| [2] | Bangsbo J, Nørregaard L, Thorsø F., 1991, Activity profile of competition soccer. Can J Sport Sci.;16(2):110-166. |
| [3] | Bangsbo J., 1994, Energy demands in competitive soccer. J Sports Sci. Summer;12 Spec No:S5-12. |
| [4] | Mohr M, Krustrup P, Bangsbo J., 2003, Match performance of high-standard soccer players with special reference to development of fatigue. J Sports Sci.l;21(7):519-528. |
| [5] | Cummins C., Orr R., O’Connor H., West C., 2013, Global Positioning Systems (GPS) and Microtechnology Sensors in Team Sports: A Systematic Review. Sports Med.; 43(10):1025-1042. |
| [6] | Castagna C, Impellizzeri F, Cecchini E, 2009, Effects of intermittent-endurance fitness on match performance in young male soccer players. J Strength Cond Res.; 23(7):1954–1959. |
| [7] | Bucheit M, Mendez-Villanueva A, Simpson BM, 2010, Match running performance and fitness in youth soccer. Int J Sports Med. 2010;31(11):818–825. |
| [8] | Gray AJ, Jenkins D, Andrews MH, 2010, Validity and reliability of GPS for measuring distance travelled in field-based team sports. J Sports Sci.;28(12):1319–1325. |
| [9] | Suarez-Arrones JL, Portillo LJ, Gonzalez-Rave MJ, 2012, Match running performance in Spanish elite male Rugby Union using global positioning system. Isokinetic Exer Sci.; 20:77–83. |
| [10] | Waldron MT, Highton C, Worsolf J, 2011, Movement and physiological match demands of elite Rugby League using portable global positioning systems. J Sports Sci.;29(11):1223–1230. |
| [11] | Varley MC, Aughey RJ, 2012, Acceleration profiles in elite Australian soccer. Int J Sports Med.2013 Jan;34(1):34-9. |
| [12] | Harley JA, Lovell RJ, Barnes CA, Portas MD, Weston M, 2011, The interchangeability of global positioning system and semiautomated video-based performance data during elite soccer match play. J Strength Cond Res.;25(8):2334-6. |
| [13] | Abt G, Lovell R. 2009, The use of individualized speed and intensity thresholds for determining the distance run at high-intensity in professional soccer. J Sports Sci.;27(9):893–898. |
| [14] | Di Salvo V, Baron R, Tschan H, 2007, Performance characteristics according to playing position in elite soccer. Int J Sports Med.;28(3):222-227. |
| [15] | Osgnach C, Poser S, Bernardini R, 2010, Energy cost and metabolic power in elite soccer: a new match analysis approach. Med Sci Sports Exerc; 42(1):170-178. |
| [16] | Carling CA,Williams M, Reill T, 2005, Handbook of Soccer Match Analysis: A Systematic Approach to Improving performance. Routledge, Taylor & Francis Group. |
| [17] | Sarmento H, Marcelino R, Anguera MT, Campaniço J, Matos N, Leitão JC, 2014, Match analysis in football: a systematic review. J Sports Sci. 1:1-13. |
| [18] | Ingebrigtsen J, Bendiksen M, Randers MB, Castagna C, Krustrup P, Holtermann A, 2012, Yo-Yo IR2 testing of elite and sub-elite soccer players: performance, heart rate response and correlations to other interval tests. J Sports Sci.;30(13):1337-45 |
| [19] | Larsson P., 2003, Global positioning system and sport-specific testing. Sports Med;33(15):1093–1101. |
| [20] | Randers M, Mujikab I, Hewitt A, 2010, Application of four different soccer match analysis systems: a comparative study. J Sports Sci.;28(2):171–182. |
| [21] | Di Salvo V, Gregson W, Atkinson G, 2009, Analysis of high intensity activity in Premier League soccer. Int J Sports Med.; 30(3):205-212. |