-
Paper Information
- Next Paper
- Previous Paper
- Paper Submission
-
Journal Information
- About This Journal
- Editorial Board
- Current Issue
- Archive
- Author Guidelines
- Contact Us
International Journal of Sports Science
p-ISSN: 2169-8759 e-ISSN: 2169-8791
2014; 4(6A): 35-41
doi:10.5923/s.sports.201401.05
Possession vs. Direct Play: Evaluating Tactical Behavior in Elite Soccer
 Abstract
 Reference
 Full-Text PDF
 Full-text HTML
Matthias Kempe, Martin Vogelbein, Daniel Memmert, Stephan Nopp
Institute of Cognitive and Team/Racket Sport Research, German Sport University, Cologne, Germany
Correspondence to: Matthias Kempe, Institute of Cognitive and Team/Racket Sport Research, German Sport University, Cologne, Germany.
| Email: |  |
Copyright © 2014 Scientific & Academic Publishing. All Rights Reserved.
Measuring and evaluating tactical behavior is one of the main goals in performance analysis in professional soccer. A specific tactical approach may present the difference between winning and losing, especially in the highest level of competition. So fare tactical behavior is mostly determined by using one or two variables, like ball possession or number of passes. Within this study, we introduce a new index (Index of Offensive Behavior, IOB) that combines different variables of offensive actions to evaluate tactical behavior. To evaluate the indexes data of 676 official games (German Bundesliga 2009/10, & 2010/11, FIFA World Cup 2010) were analysed using the “MathBall”- notation software (Algorithma Ltd., 2009). IOB was able to reliable distinguish the two common tactical approaches in soccer: possession and direct play. Furthermore, we could show that successful teams prefer possession play and that game control (measured via Index of Game Control, IOC) is the most important variable of success irrespective of the tactical approach.
Keywords: Style of play, Performance indicators, Tactical behavior, Performance analysis, Index of game control, Index of offensive behavior
Cite this paper: Matthias Kempe, Martin Vogelbein, Daniel Memmert, Stephan Nopp, Possession vs. Direct Play: Evaluating Tactical Behavior in Elite Soccer, International Journal of Sports Science, Vol. 4 No. 6A, 2014, pp. 35-41. doi: 10.5923/s.sports.201401.05.
Article Outline
1. Introduction
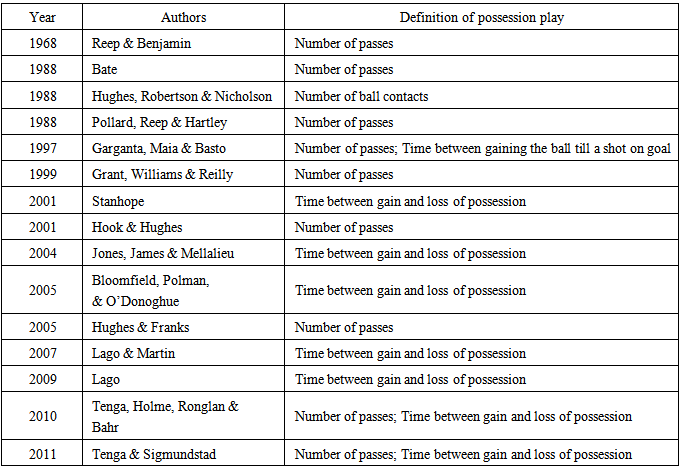
- 2013 was one of the best years in German soccer, as two German teams faced each other in the Champions League final. But furthermore, it was the battle of two different tactical approaches to succeed: possession play vs. direct play. Bayer Munich is known for its dominant possession play which led them to recent success advancing to the Champions League Final three times in four years. Their counterpart, Borussia Dortmund, prefers the direct play approach by using an intensive pressing and looking to score immediately after capturing the ball from their opponent. Unfortunately, this close encounter did not provide clarification that one of the approaches is superior to the other as it was decided by a goal out of accident. More precisely, if you take a closer look of the style of play of both teams it even made matters worse. Bayern Munich has implemented some aspects of the direct play approach into their game, as well as Borussia Dortmund likes to play ball dominant in phases of a game. Taking this into account, how do we differ between both approaches? Can we measure it just by using ball possession percentage? Even more important, how can we evaluate the tactical performance of a team and could this be an indicator for success? We will answer these questions within our approach and give some practical suggestions based on our findings.In soccer, teams aim to achieve two major aims: Scoring goals and prevent the opposing team from doing so. Comprehensive research was concentrating on those two aims [1–4] as scoring goals may be the only or at least the most valid performance indicator to determine team’s success. Yet researchers investigate certain performance indicators trying to elicit their influence on successful performances. The indicator receiving the most attention in performance analysis in soccer is ball possession. Literature often defines ball possession starting “when a player on the analysed team had sufficient control over the ball to enable a deliberate influence on its direction” [5] (p. 100) and registers its duration as comprehensive measure. Other researchers define ball possession “as the proportion of time each team held the ball” [6] (p. 1263) (for further definitions see also [7, 34]).Several studies demonstrated that ball possession was influenced by variables like match status [5, 8–11] and the quality of the respective opposing team [7, 9, 11]. Researchers therefore mostly agree that teams being down on goals possess the ball longer [8, 10, 11] and that effectiveness of a possession is far more important than the mere time in possession [2, 7, 12, 13]. In terms of evaluating the effectiveness, passing accuracy and the conversion of ball possession into a high shot-on-goal to total shots ratio are critical indicators for effective ball possession and possession quality, respectively.Closely tied to the aforementioned is the determination of the two attacking strategies that are utilised by soccer teams: possession play and direct play. The former is defined as having more ball possession (= longer ball possession periods, more passes per possession) than the respective opponent, playing ball retentive with the aim to keep possession and playing risky passes preferably in the attacking third; hence possession play or elaborate attacks, respectively, “often progress relatively slowly” [14] (p. 247). In contrast, teams utilising direct play try “to move the ball into a shooting position as directly as possible with the least number of passes” [2] (p. 509) and is thus often equated with counter-attacking [3, 4, 14]. There has been a continuous debate which style of play may be advantageous over the other. This debate has its origin in the study of [15]. Within their study, they used a hand notation system to analyse more than 3000 games and found that about 80% of all goals were scored from a sequence of three or less passes and that teams had a shot-to-goal ratio of 10:1. Subsequently, some outcomes of the aforementioned study were misinterpreted [16] so that the opinion prevailed that ten shots are required to score a goal and that few passes per possession are advantageous over possessions with higher passing sequences. [17] supported the idea of the benefits of the direct play approach which coined soccer at that time, especially in Great Britain. [2] replicated the study of [15] but normalised the data and concluded that successful teams tend to play possession soccer with more touches of the ball per possession than unsuccessful teams. Subsequently, several studies supported these findings and identified longer ball possession durations to be linked to successful teams [5, 11, 18]. However, it remains questionable which style of play should be preferred over the other, not at least because of many teams adopting their style of play according to match status and the quality of the opposing team [18].We think that complex tactical behavior, like style of play, should not be investigated by analysing just one or two ‘isolated’ performance indicator (like passes per possession, for an overview see Table 1). This point of view is supported by [19] in their review on performance indicators in sport. Recent studies in volleyball [20], ice-hockey [21], and basketball [22-24] revealed that to measure tactical performance and predicting success different performance indicators of offensive and defensive actions need to be taken into account. In soccer there is a lack of studies using an aggregated index to measure tactical behavior and performance.
|
2. Method
2.1. Match Sample
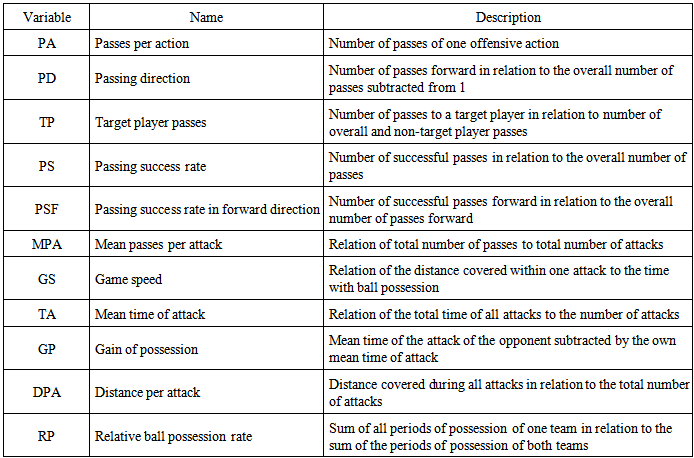
- A total amount of 676 official games over three competitions (Bundesliga 2009/10, n= 306; Bundesliga 2010/11, n=306; FIFA World Cup 2010, n= 64) were monitored and recorded via the official broadcasting signal. They were further analysed using the “MathBall”- notation software (Algorithma Ltd., 2009, www.mathball.com). The software enables as to mark desired variables (Table 2) within the video footage per mouse click and in advance to automated type out offensive actions. With the help of this software tool different standard game-related statistics for passing, shooting, ball control and ball possession were recorded and advanced variables were calculated (see Table 2).
|
2.2. Reliability Testing
- To prove reliability of the data used within the indexes, five different raters transcribed 120 randomly chosen game events. This procedure was repeated after twenty-one days to control for intra- and inter- reliability. Inter-rater reliability was calculated using Fleiss´ kappa to assess the agreement between the five raters [25]. To ensure intra-rater reliability, correlations of kappa values between two time points of the same data set were calculated using a test-retest design with a delay of 3 weeks [30].
2.3. Index of Game Control
- To evaluate the performance of the offensive game of different teams, we calculated the Index of Game Control (IGC, see Equation 1). It includes several passing parameters (passes per action, passing direction, and target player passes) and parameters of passing success (passing success rate and passing success rate in direction forward). To aggregate the different parameters with different dimensions they were Z-transformed in advance of the calculation. This index gives an impression how accurate an attack was performed, regardless the preferred style of play of the team, but is nevertheless a component of the Index of Offensive Behavior.
 | (1) |
2.4. Index of Offensive Behavior
- In order to assess the style of play of a team and to distinguish between direct and possession play we calculated the Index of Offensive Behavior (IOB, see Equation 2). The index characterizes the offensive behavior of a team by using parameters of ball possession, gain of possession and quality of possession (IGC) as well as parameters of the duration and the covered distance of offensive actions and the overall game speed. All parameters with exception of IGC were Z-transformed to allow the combination of variables with different dimensions.
 | (2) |
2.5. Data Analysis
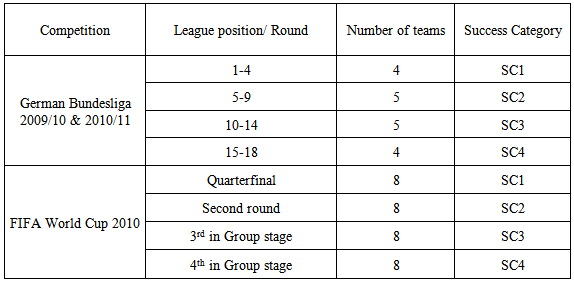
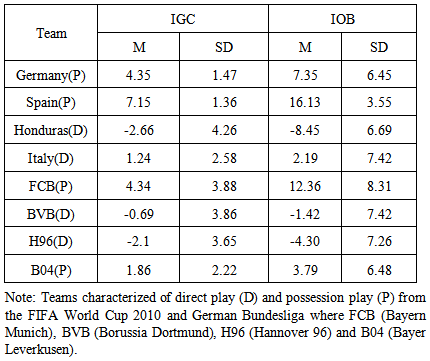
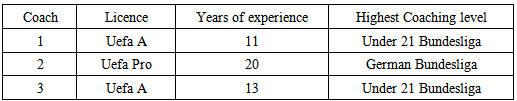
- For the purpose of showing validity of the IOB, we chose eight teams of the sample size that were characterized by four different coaches (UEFA A-level) as either using direct (Borussia Dortmund, Hannover 96, Honduras, Italy,) or possession play (Spain, Germany, Bayern Munich, Bayer Leverkusen). IOB should be in line with the characterizations, indication possession play with a positive and direct play with negative values.To determine between successful and less successful teams, the teams with our sample size were categorized into four groups ranging from top four teams (Success Category 1, SC1, UEFA Champions-League Qualifiers) to the relegated teams (SC4). The entire classification by league position or performance in the FIFA World Cup 2010 is shown in Table 3.
|
3. Results
3.1. Reliability
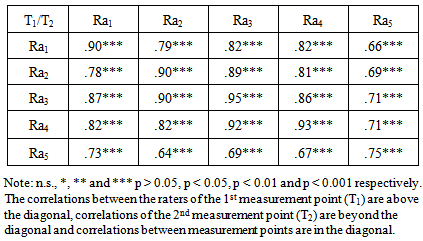
- As shown in Table 4, data acquisition was conducted with high inter-rater and intra-rater reliability. Rater1- Rater4 (Ra) did reveal correlations above .75, which is seen as near total accordance [26, 30]. A lower level of accordance was performed by Ra5, who has been the rater with the least experience in notation analysis. Furthermore, with the exception of Ra5, the achieved intra-rater reliability of above .90 can be seen as excellent.
|
3.2. Validity of the IOB
- Table 5 shows the mean values of the teams picked to validate the IOB. As a high positive value describes possession play, it can be seen that Spain, the team mostly renowned for using possession play, scored highest. By contrast, Honduras a team characterized as play “kick and rush” scored a high negative value which describes direct play. Overall, with the exception of Italy, all teams characterized by the coaches for possession play achieved a positive and the ones characterized for direct play achieved negative IOB. Therefore, IOB seems to be able to clearly distinguish between both styles of play. Values also indicate that the IOB is able to differentiate how strict a team used one style of play or a mixed approach. Bayer Leverkusen and Borussia Dortmund could be seen as representatives for a mixed approach. Although both prefer either direct (Borussia Dortmund) or possession play (Bayer Leverkusen), they seem to partly use the other approach as well in stretches of a game (see [7] for statistical evidence of the categorization of the style of play of the different teams).
|
3.3. Impact of Playing Style on Success
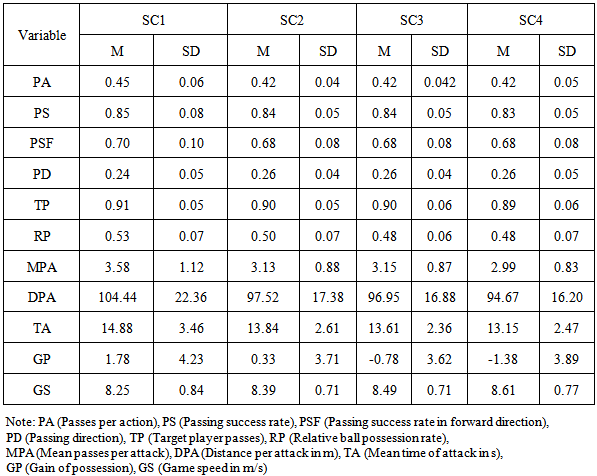
- To reveal the influence of the two different styles of play on team success, we investigated the connection between the indexes and actual success. All of variables used to form the indexes (see Table 6) showed a significant main effect between the success categories (SC).
|
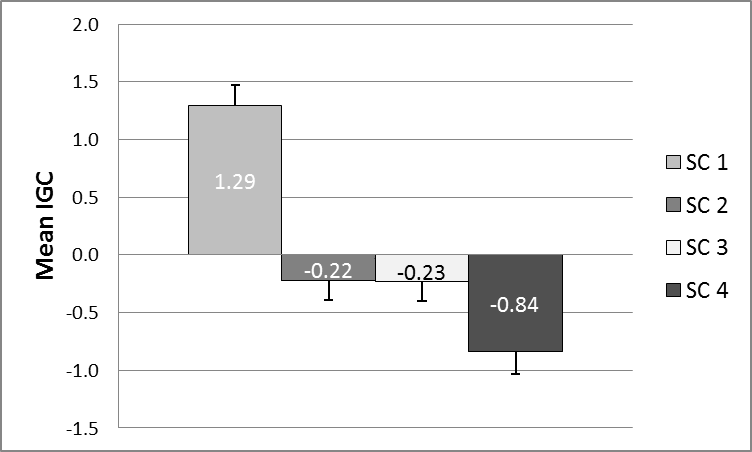 | Figure 1. Mean values of the Index of Game Control (IGC) of the Four Different Success Categories (SC) |
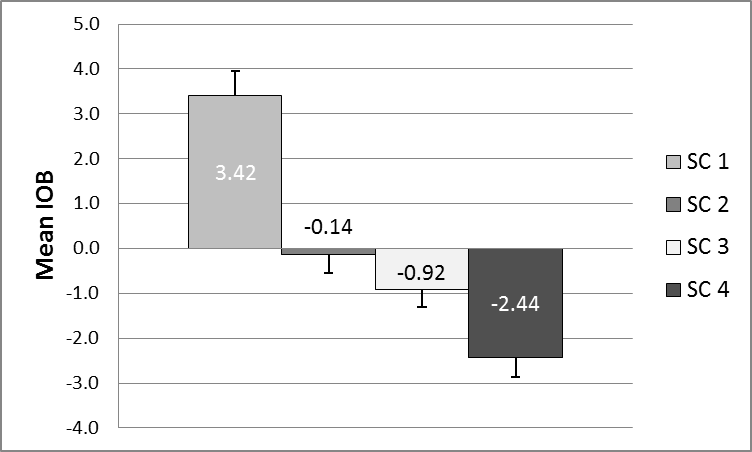 | Figure 2. Mean values of the Index of Offensive Behavior (IOB) of the Four Different Success Categories (SC) |
4. Discussion
- In the present study we developed two indexes to better characterize the style of play in soccer and further investigate what style of play is used by successful teams. In a first step we could show that the different variables we collected showed a high reliability between different raters and time points. Therefore, we showed that this data can be trusted and we created a reliable basis for our further calculations.As we strove to create an index that is better suited to characterize tactical behavior in soccer, especially direct and possession play, we carefully reviewed the relevant literature. Based on this reviewed literature (see Table 1), we introduced a new index of offensive behavior that combines previous cited variables like ball possession [3], number of passes [2, 15, 27], the mean time of an attacking sequence [28], and the time between gain and loss of possession via our Index of Game Control [5, 10, 18, 29]. Via face validation by UEFA A-licence soccer coaches (see Table 7), we showed that the IOB is able to distinguish between direct and possession play. Furthermore, the IOB gives deeper insights in the tactical approach of a team. Spain, for instance, is known for its extensive possession play [36]. In the FIFA 2010 World Cup they achieved an IOB of 16.13, which was the highest number of all teams of our sample size. In contrast, Honduras scored an IOB of –8.45 indicating a strict use of direct play, which was in line with the appraisal of the coaches as a “kick and rush” team. Those observations are line with [7] and [37] who revealed the same teams as ball dominant or recessive by calculating and weighting ball possession times. Overall, by including the different variables that characterize different tactical approaches, the IOB is able to not just differentiate between direct and possession play but enables to make fine distinctions between the offensive approaches of different teams (see Table 5). Therefore, we achieved our main goal to calculate an index to describe and measure tactical behaviour like it is common in other sports [20-24]. However, the IOB focus more on team performance than of individual player performance like most indexes in basketball [22-24]. Further studies may yield the possibility to quantify individual performance with the IOB or IGC, as well.
|
5. Conclusions
- In conclusion, we introduced two indexes that help to define and understand the tactical behavior of soccer teams. By using the indexes we could provide further evidence that possession play is linked with team success. However, we are in line with previous findings that the most important variables are control and effectiveness of attacking actions [2, 7, 12, 13]. In contrast, a low margin of distance covered per attack and the inability to regain possession seem the most important indicators for a bad tactical behavior. As the indexes are sensitive in differentiating tactical behavior, they might be a useful tool to evaluate differences in the course of a game. Therefore, further research could use them to investigate tactical pattern in relation to the match status, whether the team is playing at home or away, or the quality of the opposing team.
ACKNOWLEDGEMENTS
- The authors wish to express their appreciation to Manuel Grob, Timo Gross, and Marius Terhorst for their support on data collection. Further, we like to thank Hasan Gören for his support on behalf of the “MathBall”-software. The data presented belong to the PhD-thesis of S. Nopp [35].