Christos Papahristodoulou
School of Business, Society & Engineering, Mälardalen University, Västerås, Sweden
Correspondence to: Christos Papahristodoulou, School of Business, Society & Engineering, Mälardalen University, Västerås, Sweden.
| Email: |  |
Copyright © 2014 Scientific & Academic Publishing. All Rights Reserved.
Abstract
The ranking of football players has always engaged media and supporters worldwide. The different views on ranking are due to two reasons. First, leagues are heterogeneous with various qualities. Second, fans often rely on different performance measures and statistics, or just unmeasurable actions. Despite the fact that team and player bias will never disappear, this paper aims to objectively evaluate the efficiency of 42 top scorers who have played in the UEFA Champions League (UCL) over a six years period, (2006/07 - 2011/12), based on official match-play “multi-input and output” statistics, using input- and output oriented DEA models.
Keywords:
Efficiency, Scorers, UEFA Champions League, DEA
Cite this paper: Christos Papahristodoulou, Evaluating the Performance of UEFA Champions League Scorers, International Journal of Sports Science, Vol. 4 No. 6A, 2014, pp. 1-11. doi: 10.5923/s.sports.201401.01.
1. Introduction
All over the world, the media and football supporters have always tried to rank teams and players, based on their own subjective views and/or various key parameters. The Union of European Football association (UEFA) asks a number of team managers to nominate the best players in UEFA Champions League (UCL). The Fédération Internationale de Football Association (FIFA) also asks national team managers, team captains and representatives from FIFPro (the worldwide representative organization for professional players) to vote for the world player of the year. The French football magazine, France Football, has awarded the “Ballon D’ Or” (the European Footballer of the Year) since 1956, a prize which is considered as the most prestigious individual award in football. The nominee player must have been playing for a European team within UEFA’s jurisdiction. France Football asks only a group of European football journalists to participate in this voting [20]. Obviously, ranking the best player among goalkeepers, defenders, midfielders and forwards is a very difficult task. How should one compare and evaluate amazing savings by goalkeepers, excellent tackling by defenders, wonderful assists by midfielders, and outstanding goals by forwards? Moreover, even if one could observe a defender’s tackling, his cooperation with the other defenders and even midfielders, his smart play in terms of offside won or fouls committed etc., and compare him with a top forward, the degree of subjectivity would be very high. Sport journalists do evaluate players with point systems that often differs among countries and media. In addition, low points do not necessarily imply bad performance, if for instance the player followed the instructions given by his manager and might have sacrificed his own performance for the best of his team.On the other hand, scorers are easier to evaluate because goals scored and other relevant statistics related to goals, are available. The use of “goals scored” though, causes a strong bias mainly against defenders and midfielders. A few defenders score, usually from penalties, foul kicks or other occasions. For instance, in the 96 group matches of the 2005/06 UCL tournament, there were scored 228 goals. Out of 48 players who scored at least two goals, 27 were forward, 19 midfielders and only 2 were defenders.If some midfielders (usually the offensive ones) who score many goals are to be included in the data set together with the top forward scorers, their goal performance is obviously inferior, because their main duty is not to score goals, but passing the ball to other players and starting an attack. Thus, in order to give them a chance to be compared on fair grounds with the forwards, additional performance statistics can be included, such as assists, shots on goal, and fouls suffered. On the other hand, one might doubt whether the additional performance statistics are true output measures, given the fact that only “goals scored” count in matches. In that case, one can follow for instance Despotis et al [7], and treat assists, shots on goal and fouls suffered as “intermediate” inputs instead, in a two-stage decomposition model.The purpose of this paper is to evaluate each one of the 42 top scorers and measure his total performance, relative to an envelopment surface, which is composed of other scorers, using a multiple input-multiple output Data Envelopment Approach (DEA) approach. In section two I present two standard Linear Programming (LP) models I used in the estimates; in section three I discuss the input and output variables and the procedure I applied in the estimates; in section four I present and comment on the estimates; finally, section five concludes the paper.
2. Envelopment Models
As is well known, the DEA approach envelops a data set of inputs and outputs, as tightly as possible (as in [2, 3, 5, 14]). There are many LP formulations to identify the Data Measurement Units (DMU), i.e. the scorers in our study. When there are multiple criteria, it is harder to find scorers who beat all others in “more-is-better-case” (such as goals scored, assists e t c) and in “less-is-better-case” (such as played less time, or playing in an inferior team). Some of the top scorers will remain at the top in various aspects, while others would probably disregard the selected variables that ranked them as inefficient. The relative efficiency of scorers cannot be decided unless we use as many relevant inputs and outputs as possible, and apply various envelopment models, such as a proportional decrease in inputs or a proportional increase in outputs.The author’s estimates are based on the following two well-known envelopment models, the CCR, Input and Output oriented models and the BCC, Input and Output oriented models.
2.1. CCR: Input Oriented Model
If scorers are free to adjust their inputs (for instance if their managers let them playing more or less time) in order to achieve some given output(s), an input oriented model is appropriate. Input oriented models are relevant when at least two inputs are used. Since inputs excess is non-negative, the proportional decrease ends when at least one of the excess inputs variables is reduced to zero. The CCR formulation of the input oriented problem is the following:  | (1) |
 | (1a) |
 | (1b) |
 | (1c) |
 | (1d) |
where:si , output slack for multi-output i , i = 1,…,m;ej , input excess for multi-input j, j = 1,…,n;yi,u, output i of scorer u, u = 1,...,q;xj,u, input j of scorer u; weight(s) of u scorer(s);
  efficiency parameter of every u scorer; is a non-Archimedean positive constantConstraint (1a) states that the evaluated scorer cannot produce more “output” than the players who are on the efficient frontier. If he produced as much as the efficient frontier players, he would be a part of the efficient frontier too, so that his specific output slack would be zero. If he produced less, he would be inefficient and his inefficiency degree would be equal to his output slack. Constraint (1b) states that the evaluated scorer cannot use less input than the efficient input requirements. If he used as much input as some other efficient input scorers, he would be efficient too, and his excess input would be zero. If he used more input, he would be inefficient and his inefficiency degree would be equal to his excess input. The evaluated scorer u is efficient in the strict sense of Koopmans if
  euj = 0, sui = 0 and consequently,
  Moreover, while
  implies inefficiency in the sense of Koopmans, the scorer can be efficient in the weak sense of Debreu and Farrell, if the proportionate inputs reduction
  left him on the optimum outputs level, i.e. if and only if his output slack sui = 0. Any positive output slack and/or excess input indicates
  i.e. inefficiency. Notice that, the fact that there are neither output slack nor excess input does not necessarily imply that
  That might happen in the extreme case, if another efficient scorer k, envelops the evaluated (and inefficient) scorer u by 100%, i.e. if
  Notice finally that the objective function employs a non-Archimedean positive constant
  (determined by the optimal solution) to allow both e and s to be positive. Given the positive, but unknown constant
  the problem is in fact a NLP. The Constant Returns to Scale (CRS), CCR input oriented model is easily modified to the Variable Returns to Scale (VRS), BCC model, by adding the convexity constraint
 . Normally, the efficiency increases in the VRS frontier.
2.2. CCR: Output Oriented Model
We turn now to the output orientation model. Output oriented models can be relevant if scorers are not allowed to adjust their inputs to achieve their outputs, for instance if the player is going to play the entire match. The key question in these models is how efficiently the fixed inputs are used to reach the output frontier. Thus, in output oriented models one seeks to maximise the proportional increase in outputs.The standard formulation of the output-oriented problem is the following: | (2) |
 | (2a) |
 | (2b) |
 | (2c) |
 | (2d) |
where,  is the output efficiency parameter of every u scorer and all other variables are defined as before.The interpretation of constraints is similar to the previous model. For instance, all outputs are now multiplied with the efficiency parameter
  If
If  and
and  the evaluated scorer is efficient in the Koopmans sense. If
  i.e. when the output vector lays below the efficiency frontier, the scorer is inefficient in the sense of Koopmans but efficient in the weak sense of Debreu-Farrell, if and only if
  Similarly, this output oriented CCR model turns to BCC model by adding the convexity constraint
 .
.
3. Variables and Data
The data for the selected input and output variables are collected from the UEFA’s official site, [16-18]. They cover six seasons (2006/07 - 2011/12) and are based on 950 match statistics, i.e. in every season there are 96 matches at group stage, 16 matches at the round of 16 teams, 8 matches at the quarterfinals, 4 matches at semi-finals and the final. Matches at previous qualifying rounds are excluded.The investigated period is not particularly long, but rather sufficient for most of the included scorers who are in their “best” years. No matter when the period starts (or how long the investigated period is), there will always be senior good scorers who just play their last season(s) and younger talents who just started their career, or their team was qualified for the UCL. Both groups will be disfavoured compared to those who are in the peak of their career and have played for some years in the tournament. For instance, while I was writing the first version of this paper, the first semi-finals of the 2012/13 season just finished. In that match, a young rising star, Robert Lewandovski, scored four goals against Real Madrid, reaching ten goals that year. Since that period is not included, Lewandovski is excluded from the observations. Similarly, Andriy Shevchenko, the third-highest goal-scorer in UCL history with 59 goals, is also excluded, because, mainly due to injuries, he made just two goals in the first included season 2006/07. In addition to that, the observed statistics do not show why a particular player did not play certain matches. There is no certain information if he was 100% fit, in bad shape or simply the manager decided not to use him for tactical reasons.Since the study investigates the efficiency of scorers, a number of excellent scorers (42) were selected. The selected scorers should fulfil the following requirements: (i) they must have scored at least 5 goals in one season, or at least 4 goals per season, over two seasons; five scorers, (Del Piero (Juventus), Callejon (Real), Doumbia (CSKA), Shirokov (Zenit) and Cavani (Napoli) scored exactly 5 goals in one season. (ii) all goals count, i.e. even penalty kicks, during the game or after extra time. A goal scored is obviously the most important “output” variable. Moreover, goals reveal only a part of a scorer’s ability. Missing goals and the reason why, would be another important measure to correctly evaluate the scorers’ efficiency. Since such statistics do not exist (and it would be questionable to rely on such subjective statistics if somebody tried to collect), only scored goals count in this study. Three more “output” variables are used.
3.1. Assists
Many “experts” regard assists as “half goals”. By definition, an assist is an observation and attributed to the player who passed the ball to a teammate, directly and sometimes indirectly, to score a goal. While a direct pass that leads to goal counts as an assist, the assist is not recorded if the teammate misses the goal. Usually, as assists count also some indirect passes, such as: (for details, in [19]).i. A shot by a player X that causes a rebound and then a goal scored by player Z; ii. A run by a player X in the penalty area that results in a penalty kick that player Z scores. On the other hand, if the same player X takes the penalty, is not credited with an assist; iii. A cross, a free kick or a corner kick from player X that leads to goal by player Z, either through volleyed or headed goal. On the other hand, if player Z who receives the pass, cross or rebound must beat at least one opponent before scoring, player X’s assist does not count.Obviously more assists imply better performance. Despite the fact that generally, midfielders or playmakers are better in assists than the scorers are, some top scorers are excellent in assists as well. The problem with “missing goals” mentioned above, appears with assists as well. For instance, the observed statistics improve the efficiency of the players whose assists led to goals and decrease the efficiency of the players whose “assists” were not recorded, simply because the expected scorer missed the goal!
3.2. Shots on Goal
A shot on goal is another important measure to evaluate the scorers’ performance. Goals are obviously the result of shots on goal. Papahristodoulou [12] found that shots on goal are strongly significant correlated to goals scored. Moreover, the average return on goals is about 0.25, since three out of four shots on goal are saved or deflected. The probability that a shot on goal is converted into goal varies significantly with both the location of the shot and with other factors. For instance, Pollard and Reep [13], estimated that the scoring probability is 0.24 higher for every yard nearer goal and the scoring probability doubles when a player manages to be over 1 yard from an opponent when shooting the ball.Do shots on goal belong to “more-is-better” or to “less-is-better”? For instance, if one argues that shots on goal should reflect the inability of scorers to convert them into goals, such a measure fits better as an input. I believe that this argument is wrong for two reasons. First, unless one obtains information (which is missing) why these shots on goal were not converted into goals, one cannot treat them as identical to “missed goals” and consequently as an indicator of poor performance. Second, if fewer shots on goal should be preferred, and treat that as an input measure, it is difficult to believe that extremely high goal returns per shot on goal would reflect higher performance and not just true “fortune”. It is simply ridiculous to ask for instance Messi to score a goal for, say, every second shot on goal, in order to be equally efficient, as other modest scorers who might have scored a goal out of just two shots on goal. Messi, in this six-year period, scored 50 goals and had 130 shots on goal. He is obviously an outstanding performer in both goals scored and shots on goal. Therefore, the position of the author is just the opposite, that is, scorers who shot more shots on goal must have been more active and therefore performed better in “shots on goal”, even if many of their shots did not turn into goals. Moreover, efficiency estimates were obtained by treating shots on goal as an additional input instead of output.
3.3. Fouls Suffered
All players commit fouls. The main purpose with fouls is to prohibit the opponent players from playing their game, from gaining ground and shooting from favourable positions in order to score goals. (For details regarding the violations of the rules that lead to fouls, see [15]). Offensive players, who suffer many fouls from the opponent players, are obviously regarded as dangerous. The number of fouls they suffer for their team is a credit to them and consequently an indicator of a good performance. Despite the fact that all gained fouls are not equally important, the fouls suffered by forwards and sometimes by midfielders are often nearer the opponent team’s area where the scoring probability is higher. Papahristodoulou [12] found that offensive teams with higher ball possession gain (statistically) more fouls.
3.4. Playing Time in Minutes
This is the most frequent match-play input variable. In fact, the simplest performance of scorers that always is used, relates goals scored per minutes played. The longer the playing time a player plays, the higher his output(s) performance is expected to be.This measure treats all matches equally and every minute played is expected to yield the same return, an assumption that might not be very likely. For tactical reasons, or because of injury, some scorers play less than 90´per game (or less than 120´in case of extra time). In addition, some scorers play more matches than others, some others play “easier” or “home” matches, while others might be kept on the bench for a particular match, especially when their team is already qualified for the next round and some forwards are told to help their midfielders and even their defenders in various matches! In this study I treat all played minutes equally, provided that the scorer has played at least 90´in a season. Scorers who played less than 90´are normally not expected to score goals and are excluded from that particular season, unless they managed to score at least a goal and fulfill the other goal conditions mentioned earlier.
3.5. The “Team and Player Power”
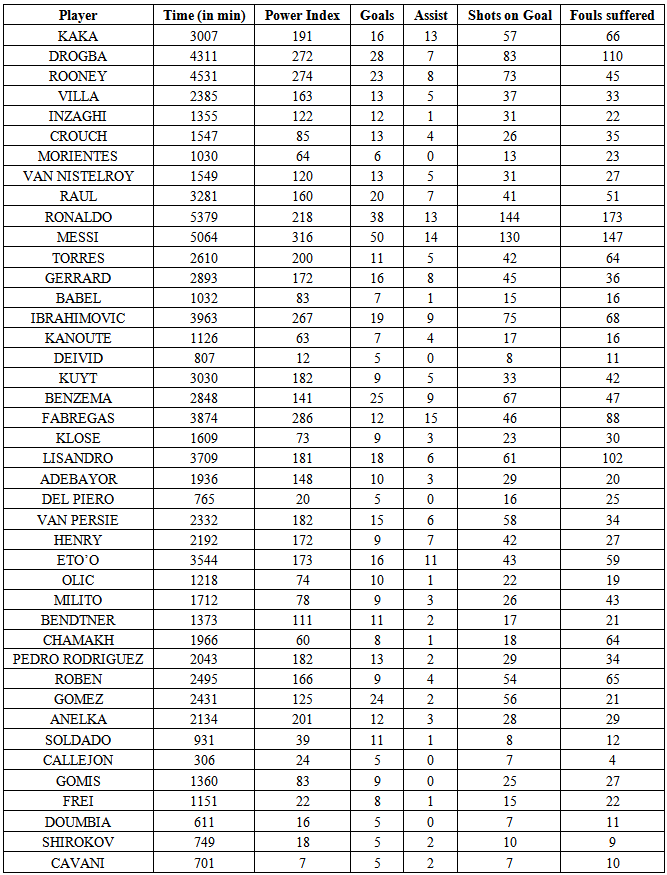
By definition, excellent teams consist of many excellent players, including top scorers. Often, it is easier to be an excellent scorer for a top team than for an average team and good scorers from average teams are usually purchased by top teams. Average teams are often satisfied with draws or keeping clean at their defense and play a more defensive style. Consequently, scorers who play in superior or richer teams have better teammates and given the fact that their team plays a more offensive style, have more opportunities to score goals. In order to correct for the “player power”, I constructed first an index of the “team power” in which the scorer has played and adjusted that index for the scorer as well, according to the time the scorer has played in the matches. As is known, the group stages of the UCL consist of eight groups with four teams per group. The seeding of teams for the UCL (and the Europa League as well) is based on Bert Kassies estimates [21], who uses a number of various match results coefficients. Every group contains one top team among the first eight ranked, (1-8), one team with second ranking (9-16), one with third ranking (17-24), and finally one with fourth ranking (25-32). The lottery will then decide the four teams per group. Moreover, since the “team power” is measured as “high as possible”, we need to reverse the ranking list, so that the top team is valued with 32 points and the bottom team is valued with 1 point. Consequently, the four power groups are classified as: (A) = 32-25, (B) = 24-16, (C) = 15-9 and (D) = 8-1. The relative power of every team, in each one of the eight groups, is then measured as:A power = 3A – (B + C + D) B power = 2B – (C + D)C power = C D power = DDepending on the lottery, it is possible that two or more teams in two or more different groups to have the same relative power, even if the teams have different ranking. However, the above condition is sufficient to ensure that no weaker teams can have higher power than the stronger ones. Based on the “team power” the scorers were assigned the respective numeric value of their team, weighted by their own playing time, i.e.: The index is divided by 540´ (i.e. compared to if the scorer has played all the six group-matches full time). If his team qualified and played at least two more matches, the “player power” is identical to his “team power.” Obviously, scorers who changed teams over seasons are adjusted for the new team’s value. Thus, the higher the scorer’s power (by playing against relatively weaker teams), the higher his performance should expected to be. Table A in Appendix depicts the data set.
4. Efficiency Estimates
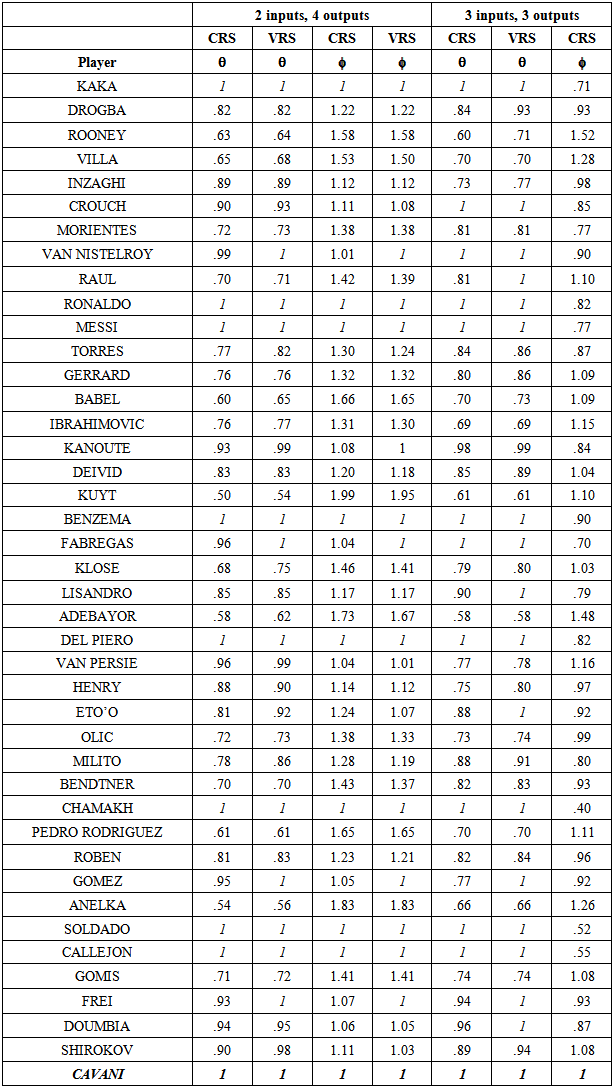
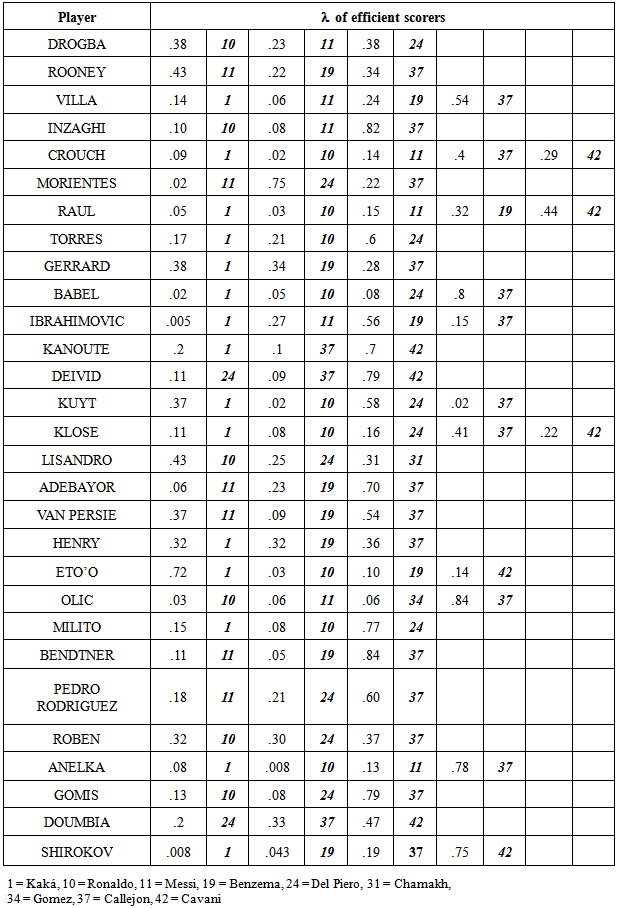
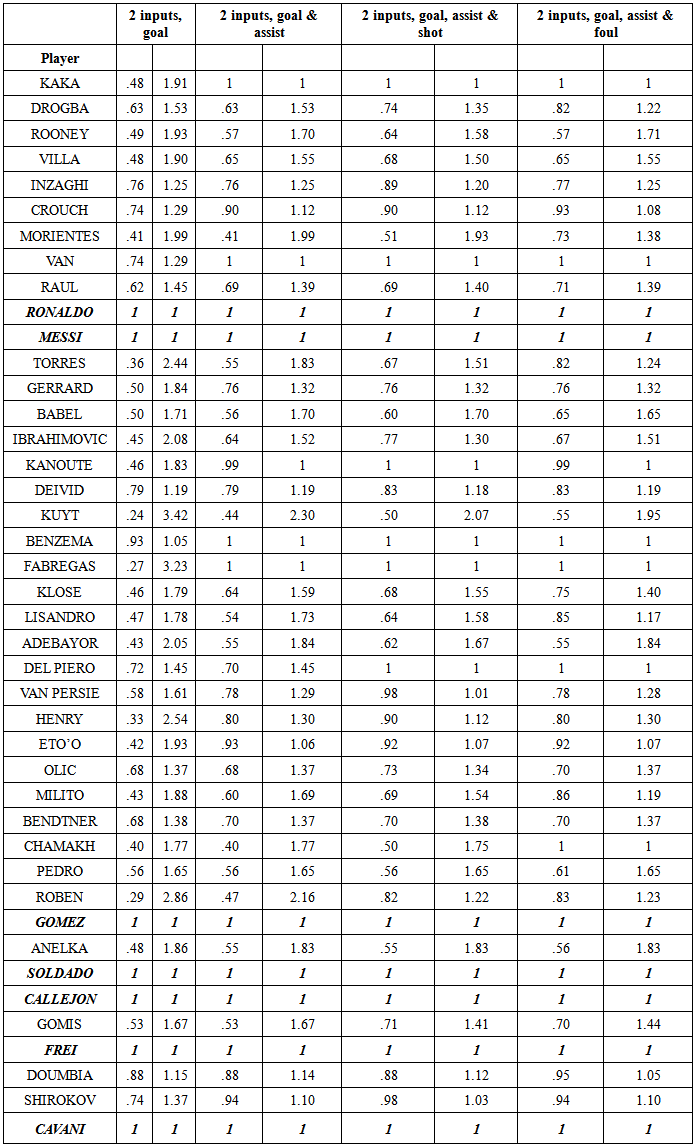
Using four outputs and two inputs, I run simultaneous estimates for all 42 scorers, using Global Solver from the LINGO package. There are 2059 variables, of which 253 non-linear, 295 constraints and one non-linear in the VRS-frontier, and 42 constraints less in the CRS-frontier. The number of iterations in the input oriented exceeded 2 million (in about 20 minutes of computing time), while the global solution to output oriented was very fast (in less than 1 minute). As it was mentioned earlier, I also used three inputs (by treating shots on goal as the third input) and three outputs. The efficiency estimates in the CRS- and VRS-frontiers for both input and output oriented models are given in Table 1. In addition, Table B in Appendix shows the estimates with two inputs and one, two and three outputs.With two inputs and four outputs, both input- and output oriented frontiers show almost similar efficiency and inefficiency estimates. The three “Ballon D´Or” players in the list (Kaká, (2007), Ronaldo, (2008, 2013) and Messi (2009-12)) are efficient in all frontiers. Apart from them, there are five more efficient scorers in the CRS-frontier (Benzema, Del Piero, Soldado, Callejon and Cavani) and five more efficient scorers in the VRS-frontier (Van Nistelroy (almost), Fabregas, Chamakh, Gomez and Alexander Frei). If we compare the efficiency with respect to goals only (Table B, Appendix), Kaká, Van Nistelroy, Benzema, Fabregas and Del Piero are not efficient.With three inputs and three outputs, in input oriented VRS-frontier, there are five more scores, Crouch, Raúl, Lissando, Eto´o and Doumbia, who turn efficient. Notice also that, despite the fact that most inefficient scorers improve their efficiency, compared to two inputs and four outputs, the efficiency of Inzaghi, Ibrahimovic, Adebayor, Van Persie and Henry deteriorates. In output oriented CRS-frontier, only Cavani is efficient.Table 2 shows the convex combination of efficient scorers who are used to project the inefficient scorers in input- and output oriented models respectively, for the VRS-frontier with two inputs and four outputs. It is clear that Callejon (37) of Real Madrid (and now at Napoli) is the most commonly used efficient scorer. Twenty out of twenty-nine inefficient scorers are tested against him in the input oriented and nineteen out of twenty-nine in the output-oriented models. Callejon in 2011/12 season had an exceptional efficiency. He played about five hours (306´) and scored five goals! His score efficiency is almost twice compared to the top scorer of the whole period, Messi. The three “Ballon D’ Or” players, Kaká, Ronaldo and Messi, follow in the next places. These three scorers project every second inefficient scorer.Table 1. Input- and Output oriented estimates
 |
| |
|
Table 2. The projection of inefficient scorers (Input oriented)
 |
| |
|
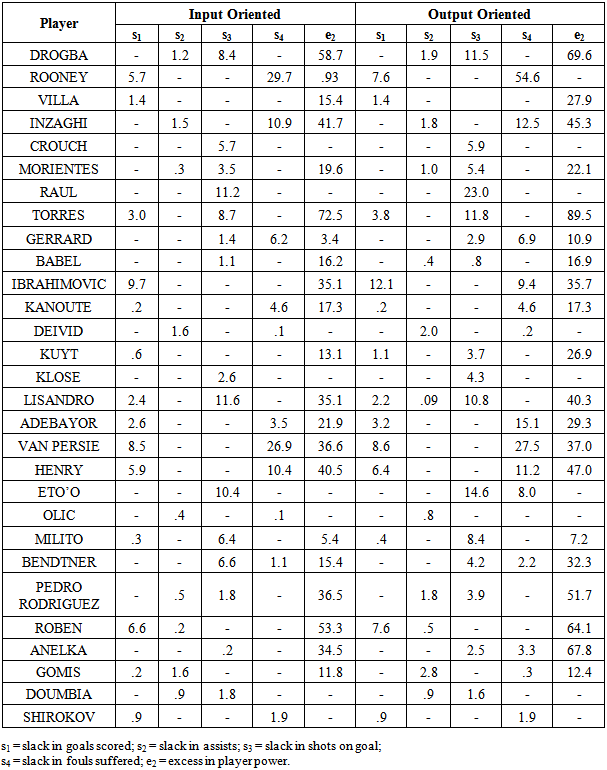
Table 3 shows the slacks and excesses of the twenty-nine inefficient scorers. All inefficient scorers are Debreu-Farrell inefficient at some slack, and/or at some excess. Notice that, apart from Eto’o, who had a positive excess of playing time of about 6 matches, none of the remaining twenty-eight scorers is inefficient in terms of playing more time, i.e. all e1 = 0.Table 3. Slacks and excesses of twenty-nine inefficient scorers (VRS)
 |
| |
|
There are fifteen respectively sixteen out of twenty-nine inefficient scores who had zero slack in goals scored, for the input- and output oriented models. The most goals scored inefficient player was Zlatan Ibrahimovic followed by Van Persie, who perform much better in their home leagues.Similarly, about 2/3 of the inefficient scorers had zero slack in assists. Finally, only eight, respectively nine out of twenty-nine inefficient scorers had zero excess in their power index. The highest excess power had Fernando Torres, followed by Didier Drogba. Among the inefficient scorers, the Debreu-Farrell efficiency differs. For instance, despite the fact that Van Persie’s  and Klose’s
  (see Table 1), Klose is more efficient in goals scored, in fouls suffered and in power index, while Van Persie is more efficient only in shots on goal. Also, while Raúl who had a higher inefficiency (higher
  than Drogba, he was more efficient in assists and in power index, but less in shots on goal. These differences are because various inefficient scorers are projected against different convex combinations of efficient scorers.Let us check two of the inefficient scorers, one in input oriented and the other in output oriented.Fernando Torres in the VRS-frontier (input oriented) has an efficiency of 0.82. Torres is compared against the convex combination of Kaká (16.75%), Ronaldo (21.71%) and Del Piero (61.54%). The convex combination of these three efficient scorers has played 2,142´ (instead of 2,610´ that Torres played). Thus, for
  the theoretical playing time of Torres is
  , leading to e1 = 0. Similarly, Torres should have had the same “power” as the weighted power of the three scorers (which is about 91.5 units, instead of 200 units that Torres has). Consequently, Torres has an extra excess of power of
 , which is e2 = 72.5, i.e. Torres’ power efficiency is worse than his playing time efficiency. The convex combination of these three scorers gives 3 more goals than Torres (s1 = 3) and about 9 more shots (s3 = 8.7) than Torres. In summary, Torres is inefficient.Zlatan Ibrahimovic in the VRS-frontier (output oriented) is about 30% inefficient. The convex combination of Kaká, Messi and Benzema scored about 37 goals. If we subtract Ibrahimovic slack (s1 = 12.1), he should have scored almost 25 goals. Moreover, since he scored only 19 goals, (i.e. 5.8 goals less) he is goal-inefficient by 30% (= 5.8/19). Similarly, given his s4 = 9.4 and given that the same convex combination gained 97.8 fouls, other things being equal, he should have gained 88.4 fouls (= 97.8 – 9.4). But he gained 68 instead of 97.8, which is 30%. Finally, while the same convex combination of scorers played exactly the same time as Ibrahimovic, (e1 = 0), his “power” is higher (e2 = 35.7), compared to these three scorers. In summary, Ibrahimovic is inefficient too.
5. Conclusions
Ranking football players is a very difficult task. Everyone who has an opinion weights arbitrarily a number of various “performance” parameters. Some of the parameters are neither directly observed and measured, nor compared. Even if we observe a player who plays creatively, or runs without the ball in order to open spaces for his team, we cannot measure these performances objectively. Nevertheless, the objectively measured parameters, such as goals scored or assists, do not reveal everything, simply because there are “easier” and “tougher” matches and opponents. Everyone should agree that if player X scores the third goal in a 3-0 victory in a group and non-decisive match, while player Y scores an excellent and the decisive goal in a quarterfinal or a semi-final, these goals are not equally worth. What people might never agree though is how much higher the performance of scorer Y is. The ranking of scorers should obviously reflect the different subjective weights one sets in these goals. In this paper, I decided not use any weights. None of the goals scored, of assists, of shots on goal and of fouls suffered is worse or better; all are equally good. Of course, one can repeat the estimates by assigning subjective weights to goals, assists, shots on goals and fouls suffered, depending upon the importance of the game. Obviously, to re-collect all data and assign various weights to all observations is not only a very difficult and time consuming task, it is highly questionable too. On the other hand, this paper controls for the quality or power differences that exist among teams, so that players who play for powerful teams have higher “power” compared to those who play in inferior teams, and consequently are expected to have higher performance.If the UEFA official match play statistics are to be taken seriously and measure what they intend to measure, the DEA models rank the following eight players on top: Messi (Barcelona), Ronaldo (Real), Kaká (Real, back to Milan), Benzema (Real), Del Piero (Juventus, retired), Soldado (Valencia, now at Tottenham), Callejon (Real, now at Napoli) and especially Cavani (Napoli, now at PSG) who remained efficient even with 3 inputs and 3 outputs. I believe that very few people would reject the top performance of these players during this investigated period (2006/07 - 2011/12). Both Messi and Ronaldo continued with their outstanding performances over the recent two periods as well. Ibrahimovic (PSG), who was inefficient during the investigated period, has improved his performance considerably over the recent two periods and might be among the efficient scorers as well, if the data are extended and cover the recent years. And as always with sports, new stars have emerged recently. Diego Costa (Atlético) and Robert Lewandowski (Dortmund) are two of them who have had excellent performances over the last two years.
Appendix
Table A. The data set (2006/07 - 2011/12)
 |
| |
|
Table B. Additional Input- and Output oriented estimates
 |
| |
|
Notes
1. A larger version of this paper was presented at the 26th European Conference on Operational Research in Rome, July 1-4, 2013.2. CCR stands for Charnes, Cooper, Rhodes [5], the three authors who formulated that model.3. BCC stands for Banker, Charnes, Cooper [3], the three authors who formulated that model.4. Koopmans [9] defined technical efficiency as: "a possible point in the commodity space is efficient whenever an increase in one of its coordinates (the net output of one good) can be achieved only at the cost of a decrease in some other coordinate (the net output of another good)" (p. 60). 5. Debreu [6] and Farrell [8] defined input oriented technical efficiency as 1 - q, so that the production of a given output will be reached. If q = 0 the scorer is efficient while if q > 0 he is inefficient.6. Ali and Seiford [1] mentioned some computational difficulties when this model is formulated as a one-step non-Archimedean approach. Modern packages, like LINGO that I used to obtain the estimates, can handle that problem very easily. The LINGOs NLP algorithm provided indeed global optimal solutions. 7. “Shots on goal” is the official name, but it includes also the heads on goal.8. Fouls committed and offside are also two other “input” proxies that can be used (as in [12]). In that study, it was found it pays to teams to commit “soft” fouls, i.e. as long as players were not punished by yellow or red cards. Similarly, it was found a weak positive correlation between offside and goals scored for the away teams, but not for the home teams.9. Almost similar projections were obtained from output oriented.10. The output oriented VRS was infeasible.
References
| [1] | Ali, A. and L. Seiford, “Computational Accurancy and Infinitesimals in Data Envelopment Analysis”, Technical Report, University of Massachusetts at Amherst, Amherst, 1989. |
| [2] | Ali, A. and L. Seiford, “The Mathematical Programming Approach to Efficiency Analysis”, in H.O. Fried, C.A. Knox Lovell and S.S. Schmidt (eds): The Measurement of Productive Efficiency: Techniques and Applications, Oxford University Press, Cambridge, 1993. |
| [3] | Banker, R.D., A. Charnes and W.W. Cooper (1984), "Some Models for Estimating Technical and Scale Inefficiencies in Data Envelopment Analysis", Management Science, Vol. 30 (9), 1078-92. |
| [4] | Borland, J. (2005), “Production functions for sporting teams”, Working paper, Department of Economics, University of Melbourne, Available:http://www.economics.unimelb.edu.au/staffprofile/jborland/Prodfunctforsportingteams.pdf |
| [5] | Charnes, A., W. Cooper and E. Rhodes (1978), “Measuring the efficiency of Decision Making Units”, European Journal of Operational Research, 2 (6), 429-44. |
| [6] | Debreu, G. (1951), "The Coefficient of Resource Utilization", Econometrica, Vol. 19 (3) 273-92. |
| [7] | Despotis, D.K., G. Koronakos and D. Sotiros (2012), Additive decomposition in two-stage DEA: An alternative approach, University of Piraeus, Available: http://mpra.ub.uni-muenchen.de/41724/1/MPRA_paper_41724.pdf. |
| [8] | Farrell, M.J. (1957), "The Measurement of Productive Efficiency", Journal of the Royal Statistical Society, Series A, General, Vol. 120 (3), 253-81. |
| [9] | Koopmans, T. (1951), "Activity Analysis of Production and Allocation", John Willey & Sons, Inc. New York. |
| [10] | Lovell, C.A.K. (1993), "Production Frontiers and Productive Efficiency", in H.O. Fried, C.A. K. Lovell and S.S. Schmidt (eds): The Measurement of Productive Efficiency: Techniques and Applications, Oxford University Press. |
| [11] | Papahristodoulou, C. (2006),”Lag- och spelareffektivitet från Champions League matcher”, mimeo, School of Business, Mälardalen Univerity, Västerås, Sweden. |
| [12] | Papahristodoulou, C. (2008), “An analysis of UEFA Champions League match statistics”, International Journal of Applied Sports Science, No 20 (1), 67-93. |
| [13] | Pollard, R. and C. Reep (1997), “Measuring the effectiveness of playing strategies at soccer”, The Statistician, 46, No. 4, 541-50. |
| [14] | http://www.deazone.com/ |
| [15] | http://www.fifa.com/mm/document/affederation/federation/laws_of_the_game_0708_10565.pdf |
| [16] | http://www.uefa.com/competitions/ucl/history/index.html |
| [17] | http://www.uefa.com/competitions/UCL/players |
| [18] | http://www.uefa.com/competitions/supercup/news/kind=1/newsid=577098.html |
| [19] | http://en.wikipedia.org/wiki/Assist_(football) |
| [20] | http://en.wikipedia.org/wiki/European_Footballer_of_the_Year |
| [21] | http://www.xs4all.nl/~kassiesa/bert/uefa/index.html |
 Abstract
 Reference
 Full-Text PDF
 Full-text HTML