-
Paper Information
- Paper Submission
-
Journal Information
- About This Journal
- Editorial Board
- Current Issue
- Archive
- Author Guidelines
- Contact Us
Resources and Environment
p-ISSN: 2163-2618 e-ISSN: 2163-2634
2013; 3(5A): 23-28
doi:10.5923/s.re.201309.04
Identification of Major Problems with Urban Water Supply in Selected Areas of Johor Bahru, Malaysia
 Abstract
 Reference
 Full-Text PDF
 Full-text HTML
Nabilah M. I. 1, Noor Sharipah S. S. 2, Zardari N. H. 2
1Faculty of Built Environment, Universiti Teknologi Malaysia, 81310, Skudai
2Institute of Environmental and Water Resources (IPASA), Universiti Teknologi Malaysia, Skudai, Johor, Malaysia
Correspondence to: Zardari N. H. , Institute of Environmental and Water Resources (IPASA), Universiti Teknologi Malaysia, Skudai, Johor, Malaysia.
| Email: |  |
Copyright © 2014 Scientific & Academic Publishing. All Rights Reserved.
In this paper the survey results of 836 households located in three local authorities of Johor Bahru District are presented. A questionnaire consisted of some demographic, water supply, water usage and some opinion questions were administered to a randomly selected respondents based on housing type, settlement type and some socio-economic criteria in face-to-face interviews. The survey data were analyzed using descriptive and inferential statistical techniques. The major focus of the questionnaire were on water usage and water issues such as water quality, interrupted or continuous water supply, response to pipe leakage problems, water pressure in the supply line, and water utility bill payments encountered by the households. The survey results reveal that the quality of domestic water in the surveyed area was realistically good except for few places where some complaints regarding high chlorine contents and silt presence were recorded. Besides that, water pricing was also identified as one of the major issues where some residents complained about current water price that is unaffordable. This paper will be of interest to policy makers, regulators, water company professionals and other researchers for enhancing water management in terms of strategies, policy and programs formulation and initiatives towards technological and infrastructural innovations.
Keywords: Water Demand Management, Urban Water, Water Resource Planning, Johor Bahru, Survey Questionnaire
Cite this paper: Nabilah M. I. , Noor Sharipah S. S. , Zardari N. H. , Identification of Major Problems with Urban Water Supply in Selected Areas of Johor Bahru, Malaysia, Resources and Environment, Vol. 3 No. 5A, 2013, pp. 23-28. doi: 10.5923/s.re.201309.04.
Article Outline
1. Introduction
- Water is an important resource in life. During the last decade, water management has evolved through a paradigm shift. Traditionally, water resource planning started by projecting the population to be served, estimating per capita water use and then simply multiplying the population projection with the per capita estimation. Since late 1970’s, the traditional resource supply planning has proven to be an ineffective process for some utilities as it is particularly unresponsive to the environmental, financial and political constraints of the 1980’s and 1990’s. The large water construction projects which are often recommended encountered significant public opposition. It also ignores the important contribution to supply that can be obtained from comprehensive demand-side management programs such as water conservation[1].
2. Water Demand Management (WDM) Approach
- Nowadays, WDM has become an integral part of water services planning in many countries of the world particularly the developed nations. WDM generally refers to the implementation of policies or measures which serve to control or influence the amount of water used[2]. As stated by[3], he defined WDM as a practical strategy that improves the equitable, efficient and sustainable use of water which can be achieved through stressing equitable access to water, reflected in a starategy that is specifically designed to improve service delivery to the poor, treating water as both an economic as well as social good and managing and pricing it accordingly, balancing the management of losses and consumption with new or augmented supplies and managing the change from a supply driven to demand responsive culture.As said by[4], WDM defined as the adaptation and implementation of strategies, policies and initiatives by a water institution to influence water demand and usage of water in order to meet any of the following objectives: economic efficiency, social development, social equity, environmental protection, sustainability of water supply and services and political acceptability (cited by[5]).WDM actually focuses on managing the water demand aspect of consumers. As said by[6], water demand defined as the amount required for a given purpose, measured for example, according to the number of litre per person per day, or mm per crop. The demand can be present or future and it can be actual (related to an available infrastructure) or potential (assuming full infrastructural development and no raw water shortage). The serviceble part of the demand is limited both by infrastructure and raw water availability. According to him, a distinction can be made beween consumptive demand (for households, industries and agriculture) and non-consumptive demand (for habitat preservation, fisheries, navigation and salinity control at the river mouth). A similar but slightly defferent distinction can be made between instream demand and offstream demand.An important aspect in WDM is water use. The usage (or consumption or utilization) of water is that part of demand that is actually served at a given time. Many uses generate a return flow (for example sewerage or irrigation tailwater). The return flow can occur at a different time of place than the withdrawal. The usage of water can be increased by infrastructural development and reduced demand by management[6]. Water consumption on the other hand, also refers to water that has been withdrawn and used in a way that prevents its immediate reuse[7]. Demand management refers to the intervention on water in order to reduce the consumption of water. It is applied in order to meet water shortage, shortage of money for infrastructural development or to improve water efficiency[6].WDM is a tool for achieving harmony between demand for water and the availability of water. There are various tools which can be adopted in WDM and various mechanisms applied in managing water usage by consumers. Domestic consumption for example, can be controlled by measures such as installation and charging water fee, applying different tariffs for different housing areas, generation of awareness about prudent use of water and rationing of water (normally in case of critical shortage only). The demand of water for industrial consumption can be controlled by measures such as installation of water meters, and charging water fee, applying of different tariffs for different users and different seasons, promotion of new water efficient technology and rationing of water, normally in case of critical water shortage. As for the agricutural sector, measures such as water charging or fee depending on volume of water used, different triffs for different seasons, generation of awareness about prudent water usage, promotion of good operation and maintenance, promotion of new water efficient technology and water rationing are some of the mechanisms applied.Population growth and urbanization together with changes in production and consumption patterns have placed unprecendented demand on water resources. As such, a World Conservation Congress organized by IUCN in October, 1996 discussed the issues through presentaion of regional case studies which brought together from diverse countries such as Mali, Zambia, Morrocco, Jordan, Banglaadesh, Pakistan and Guatemala to discuss on water and population dynamics. An important fact highlighted in the discussions was that popuation dynamics (such as growth, distribution, migration and other characteristics) and water resources interact through human uses of water and the most important demographic trend affecting water resource is population growth. The congress also acknowledged the fact that a better understanding of the relationship between population dynamics and water resources is the first step toward designing policies that can make these relationships more sustainable[8].An important water demand sector is that of the residential sector. Studies undertaken in the United States have proven that residential water use can be divided into use by single-family units versus multi-family units. The two types of units generally showed different patterns of water use, for both demographic and economic reasons. The major economic difference is that the residents of multi-family units are usually not metered and billed individually[9]. Another major difference is that there tends to be less outdoor space per resident in multi-family units and the maintenance of the landscaping may be controlled by a building manager[10]. Demographically, multi-family units are often associated with smaller family sizes, although the opposite may be true in lower income areas where large households may live in apartment units. Overall, generally there is lower per capita use in multi-family units. The residential water use in a normal year area was estimated to an average of about 150 gallons per capita per day for single –family units and 110 gallons per capita per day for multi-family units[11].The role of the demand side in water utility planning is obviously important. Future water needs must be anticipated and estimated and future utility capacity must be built accordingly[12]. Although demand forecasting and planning have always been intrinsically related, utility planning models and methods have evolved in ways that explicitly recognise the value of demand analysis. Modern utility planning emphasizes forecasting with greater precision and methodologically sophisticated approaches to reduce or avoid risks and uncertainties. Modern planning also embraces the concept of demand management which suggests that water demand is not fixed and unalterable. Water demand is malleable and manipulating patterns of water use can improve the efficient and effective use of water supply sources[13].
3. Implementation of Water Demand Management in Malaysia
- The need for a comprehensive Water Demand Management (WDM) approach in Malaysia has been raised repeatedlyby[14] and[15]. James T. Cherian[15] is an Environmental Consultant and an advocate for water and forest conservation highlighted that water conservation is essential in a country blessed with abundant railfall such as Malaysia. He also emphasised the need to implement Water Demand Management in Malaysia, a system which advocates efficient use of water in order to maintain vital environmental flows and to reduce dependence on costly infrastructure projects.As a new approach in water planning and management, not many studies have been undertaken on analyzing the water demand patterns of the various sectors namely the residential, industrial, agricultural, institutional and commercial sectors in the country and the factors influencing such patterns which are important information required by planners for purposes of determination and calculation of future water needs and the formulation of strategies, policies and programmes towards achieving water resource sustainability. As an initial stage, this research focuses on analyzing water demand of the residential sector and Johor Bahru District has been selected as the case study area.
4. Research Methodology
- A questionnaire form was designed covering issues such as the demographic, household water usage, water supply issues, household attitude and awareness about water saving or water conservation. The questionnaire was divided into five sections. Section one seeks the response of respondents about their profile or background. Section two focuses on water supply sources and water usage. The next section gives more attention on household water supply issues and problems. Respondents were asked their satisfaction about quality of water supply, water pressure, continuous supply, maintenance services like pipe leakage fixation and current water charges. Section four focuses on the awareness, perception, attitudes and behavior of respondents pertaining to water campaigns and water conservation.
4.1. Sampling Method
- Before the questionnaire was distributed, an appropriate method was used to calculate the number of sample size. Based on the total population in Johor Bahru of about 1,023,800 people, the minimum number of respondent needed to carry out the survey with 4% significant value was 386. Nonetheless, this study managed to collect 836 samples of households from three major municipalities in Johor Bahru District, namely Majlis Perbandaran Johor Bahru Tengah, Majlis Bandaraya Johor Bahru and Majlis Perbandaran Pasir Gudang.
4.2. Data Analysis
- The data obtained from the questionnaires and were analyzed using the Statistical Package for Social Sciences (SPSS) and Microsoft Excel softwares. The Descriptive Analysis and Cross Tabulation Analysis, specifically the Chi-Square Test were adopted in the analyses.
4.3. Respondents’ Profile
- The study area comprises of three major local authorities namely Majlis Perbandaran Johor Bahru Tengah (MPJBT), Majlis Bandaraya Johor Bahru (MBJB) and Majlis Perbandaran Pasir Gudang (MPPG). The population size of MPJBT and MBJB are almost the same (39% each) while MPPG being the least populated area had only about 22% of the respondents. The distribution of survey respondents is shown in Figure 1.
4.4. Distribution of Respondents
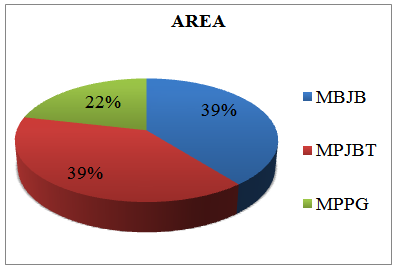 | Figure 1. Distribution of Respondent |
4.5. Settlement Types and Types of Houses
- Most of the respondents (71%) live at the urban housing, comprising of flats, single, double storey, semi-detached and bungalow houses. Some households in the squatter's areas, traditional villages, new villages and resettled housing schemes were also included in the interviews.
4.6. Socio-economic Characteristics
- The majority of the respondents (70%) were Malays, followed by Chinese (18%), 10% Indian while others contributed the lowest percentage. About 43% of the respondents are between 41-60 years old and followed by 26-40 years old and range 61 years old (13%) of the total sample. The lowest percentage of respondents (9%) came from 25 years old and below. The majority were Muslims (70%) followed by Buddhist (14%), Hindus (9%), Christian (6%) and the least (1%) were atheist.The majority of respondents (61%) had secondary school education, followed by primary and college level education (16% and 11%) respectively. There were only 7% of the respondents with university education and the lowest percentage (5%) was with no formal education. The highest percentage of respondents work in private sector (42%) while about 27% and 16% of respondents were self-employ and housewife respectively. While jobless was only 4% of the total sample. The highest percentages of respondents (59%) were in the middle income range of RM1, 001-3, 000 per month. Respondents with income range of between RM3001-5000 and below RM1, 000 per month had the same percentage which is 19% each. There were only 1% of respondents of high-income category of between RM10, 000 to RM15, 000 and more than RM15, 000 per month.
4.7. Household Characteristics
- The majority of the households had 4 persons staying (19%), followed by those with 3, 5 and 2 persons contributed (15%, 14% and 13%) respectively. As a whole, most of them had household size of between 1 to 6 persons per household.
5. Water Supply Sources and Water Usage
- The main purpose of the survey was to gather information pertaining to sources of water supply, water usage and water issues and problems encountered by households of Johor Bahru District.
5.1. Sources of Water Supply
- The main source of water supply for the majority of respondents were from individual meter piped water (96.3%), while some obtained water supply from a number of sources such as shared pipe water supply; meter pipe and rain water; rain water and well and meter pipe and well water.
5.2. Water Usage
- The study indicated that the major indoor water usage were mainly for activities such as washing dishes, cooking, bathing, washing clothes, flushing toilet, cleaning of house and ablution. Rearing of fish in aquarium and bathing of pets were found to be very minimal. Outdoor water usage in the study area were for watering of plants lawn, cleaning of motor vehicles, watering of fruit trees, cleaning of porch and for other purposes such as business.
5.3. Water Consumption
- The majority of respondents (29.8%) pay less than RM20 and less of water bills, followed by those who paid RM21 to RM40, and more than RM81. The study indicated that the flats recorded the lowest level of water consumption, followed by double storey terrace houses. The highest consumption was recorded among bungalow houses followed by the village houses. The type of settlement which recorded the highest water consumption was the traditional villages, followed by squatter areas. Analysis based on type of house indicates that the highest percentage is from the village houses followed by single storey terrace and the flats.
6. Households Water Issues and Problems
- Generally, the respondents (86%) indicated they have no problem with water. However, the highest rate of dissatisfaction was on the water bill (18%), followed by problem of water quality (13.1%), low water pressure (6.9%), maintenance problem (4.4%) and interrupted supply (2.2%) respectively.
6.1. Unreasonable / Unaffordable Water Bills
- A relatively high percentage of respondents (18%) indicated that the water bills they had to pay were unreasonable and this corresponds well with the main concern of the respondents whereby water bill is the second major factor causing dissatisfaction to them. The municipality which indicated the highest level of dissatisfaction with regard to water bill was MPJB, followed by MPJBT and MPPG respectively. The housing type which indicated the highest responses was the village houses, followed by single storey terrace, flats and double storey terrace units. The type of settlement which indicated highest level of dissatisfaction with the water tariff and bill were the traditional villages and the squatter areas, hence implying that income and affordability are the main factors influencing the level of satisfaction on water tariffs.
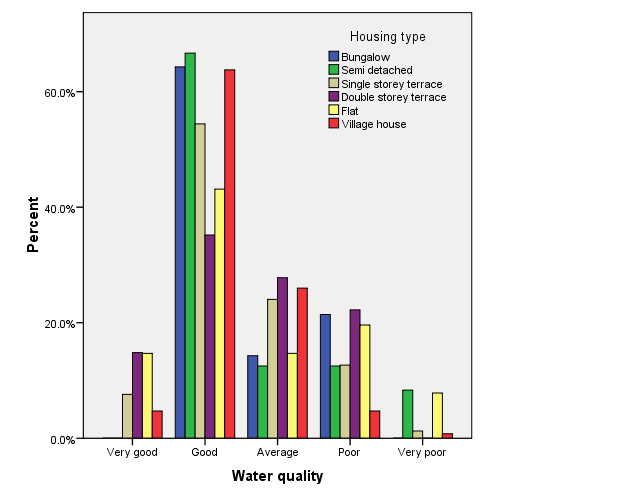 | Figure 2. Water Quality versus Housing Type |
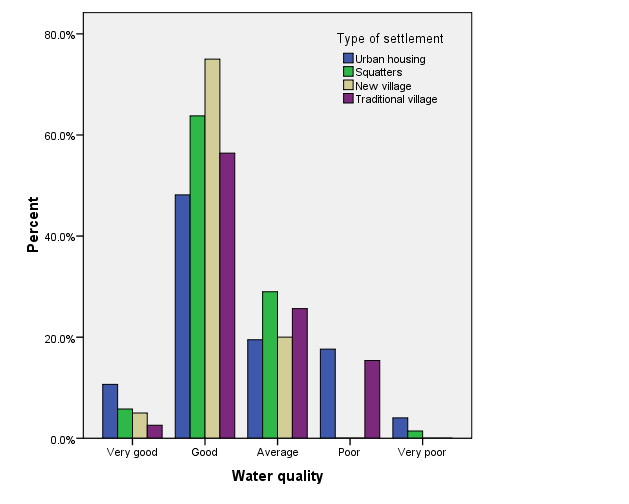 | Figure 3. Water Quality versus Type of Settlement |
6.2. Water Quality Problem
- The main water quality problems indicated by respondents were silt, high chlorine content and the water being smelly and dirty. The highest level of dissatisfaction was from those staying in flats, followed by the semi-detached houses and double storey terrace houses respectively. Majority of residents of flats, urban housing schemes, new villages and traditional villages were dissatisfied with the quality of water. More details on water quality versus type of house are given in Figure 2. Figure 3 presents survey data on water quality versus type of settlement.
6.3. Low Water Pressure
- Low water pressure was the third major problem identified in the research. MBJB's area indicated the highest level of response on this problem. Most of the responses were from urban housing units, particularly the double storey houses and the flats.
6.4. Maintenance
- In this study, we found that there were some maintenance problems in water delivery system because of old and rusty pipes mainly in flats and some village houses.
6.5. Main Concerns of Respondents
- The respondents were also asked through an open-ended question on their main concern regarding to water supply. Their biggest concern was on poor quality of water probably due to presence of silt. The second concern was of high contents of chlorine and smelly odor in water. Their other concern was about rusty pipes, unreliable water supply, low water pressure, leaky pipe, and high water bills as shown in Figure 4.
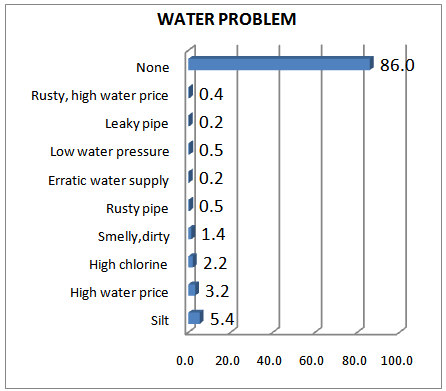 | Figure 4. Water Problems |
7. Implications to Water Demand Management
- The findings indicated that the main water problem in the study area was water quality which need to be improved, the water tariff need to be reviewed and decreased, the infrastructure need to be repaired and upgraded, a more efficient service and supply need to be ensured. The areas which need more focus for improvements are the traditional villages, the new villages, the flats and also the squatter areas of Johor Bahru. The findings of this study can also be used as indicators not only for improving the quality and level of services required by consumers in the study area but also provide some basic data and information which can be used estimating and forecasting of future water needs in the study area. Therefore, further analysis of the data collected is required.
8. Conclusions
- This paper focuses mainly on the water issues and problems in the study area. The main conclusion which can be drawn is that generally, the services provided by the water authority or water provider in Johor Bahru, specifically Syarikat Air Johor (SAJ) has been quite commendable as the level of satisfaction of the households were generally quite high at 86%. However, there are still avenues for improvement. Therefore, the findings of this research can be used as indicators towards further action by the local authorities and the water provider concerned towards improving the quality of water and services provided towards enhancing the quality of life of the population in general.
ACKNOWLEDGEMENTS
- This study was funded by the Ministry of Higher Education (MOHE) Malaysia and the Universiti Teknologi Malaysia (UTM) under GUP Grants Tier-2 with project Vot No. 06J69 titled “A Planning Model for the Implementation of Water Demand Management Approach in Malaysia: A Case Study of Johor Bahru District”. The authors are thankful to the survey participants who put their valuable time on filling out the questionnaire.
References
| [1] | D. D. Baumann, J. J. Bolandand M. W. Hanemann, Urban water demand management and planning, McGraw-Hill: USA, (1998). |
| [2] | UKWIR/EA, (1996), Economics of demand management - Main report and practical guidelines, UK Water Industry Research Limited: London. |
| [3] | P. Derevill, Sharing it out; Introducing water demand management strategies for small towns, WELL, WEDC: Loughborough, UK, (2001). |
| [4] | Department of Water Affairs and Forestry (DWAF), Water conservation and demand management- National strategy framework, South Africa, (1999). |
| [5] | A. Aravidis, Water Demand Management and Water Conservation Potential and Limitations in Katerini, Greece. Unpublished Master's Thesis, Loughborough University, UK, (2007). |
| [6] | T. K. Nielson, Water Conservation and Water Demand Management Strategy for Water Service Sector, South Africa, 2002. |
| [7] | C.Belshaw, N. Bingham and A.Blowers, (2003). Contested Environments. The Open University, Chichester, Wiley. |
| [8] | A. de Sherbinin. (1998), Water and Population Dynamics: Local Approaches to a Global Challenge, Available: http://.aaas.org/international |
| [9] | The Star, Daily Newspaper, Online version, 26 March 2011 Issue. Accessed on 19 August 2013 via web link http://www.thestar.com.my/story.aspx?file=%2f2011%2f3%2f22%2flifefocus%2f8192017&sec=lifefocus |
| [10] | R. F. Kenneth, P. H. James, A. M. Miguel and S. Randy, (2011), Water Use and Demand Management Options for the Multi-family Residential Sector, Florida Water Resources Journal, Department of Environmental Engineering University of Florida Gainesville, FL. |
| [11] | S. Renzetti, (1992), Evaluating the Welfare Effects of Reforming Municipal Water Prices, Journal of Environmental Economics and Management, 22(2): 147-63. |
| [12] | D. D. Baumann, Urban Water Demand Management, McGraw Hill, United States of America, (1998). |
| [13] | J.A. Beecher, (1996), Avoided Cost: An Essential Concept for Integrated Resource Planning, Water Resource Update no, 104 (Summer): 28-35. |
| [14] | P.W. Mayer, D. Bennett, W. B. De Oreoand E. Towler, (2006), Third-party billing of multifamily customers presents new challenges to water providers, J Am Water Works Assoc, 98(8): 74-82. |
| [15] | J. T. Cherian, (2011), Audio file downloaded from BFM website via web link http://www.bfm.my (accessed on 19 August 2013). |