-
Paper Information
- Paper Submission
-
Journal Information
- About This Journal
- Editorial Board
- Current Issue
- Archive
- Author Guidelines
- Contact Us
Resources and Environment
p-ISSN: 2163-2618 e-ISSN: 2163-2634
2013; 3(A): 1-5
doi:10.5923/s.re.201309.01
Analytical Hierarchy Process Application in Urban Sustainability Indicators Prioritization
 Abstract
 Reference
 Full-Text PDF
 Full-text HTML
Florianna Lendai Michael1, Zainura Zainon Noor1, Noorul Hassan Zardari2, Maria Josefina Figueroa Meza3
1Department of Chemical Engineering, Faculty of Chemical Engineering, Universiti Teknologi Malaysia, Skudai, Johor, 81310, Malaysia
2Institute of Environmental and Water Resource Management (IPASA), Faculty of Civil Engineering, Universiti Teknologi Malaysia, Skudai, Johor, 81310, Malaysia
3Department of Transportation, Technical University of Denmark, Lyngby, 2800, Denmark
Correspondence to: Zainura Zainon Noor, Department of Chemical Engineering, Faculty of Chemical Engineering, Universiti Teknologi Malaysia, Skudai, Johor, 81310, Malaysia.
| Email: |  |
Copyright © 2012 Scientific & Academic Publishing. All Rights Reserved.
Urban population is increasing rapidly for many reasons, fast increase in the country’s total population, more job opportunities, better living standards, and availability of reliable utility services in the cities. This trend is predicted to continue for decades to come, therefore, managing urban cities on a sustainable way is a challenge that receives increasing attention from policy-makers and researchers. Many developed countries have established some sets of sustainability indicators for the urban areas. This paper presents review on the sustainability indicators published in international journals and have prepared a list of indicators that are suitable to the Malaysian urban environment. We have produced this list of sustainability indicators based on sorting criteria including accessibility, variability in spatial and temporal directions, and measurability We used analytical hierarchy process to rank and prioritize urban sustainability indicators for Malaysia. The results, data analysis and prioritization of a set of urban sustainability indicators are presented in this paper. The survey included a group of 15 postgraduate students given questionnaires consisting of four sections; Economic Development, Social Stability, Environmental Conservation and Institutional Strength.
Keywords: Indicators, Urban, AHP, Ranking, Sustainability
Cite this paper: Florianna Lendai Michael, Zainura Zainon Noor, Noorul Hassan Zardari, Maria Josefina Figueroa Meza, Analytical Hierarchy Process Application in Urban Sustainability Indicators Prioritization, Resources and Environment, Vol. 3 No. A, 2013, pp. 1-5. doi: 10.5923/s.re.201309.01.
Article Outline
1. Introduction
- Cities have been viewed as efficient places for business location, markets for job creation, social interaction as well as culture and communication platform. However, the rapid pace of growth and development can altered the balance of city and nature, the urban and the rural[1]. When there are too many people migrating to the urban area, there is no doubt that it will increase the cities’ density and the effect can be negative and give rise to unpleasant interferences but can also be very positive and give rise to social cohesion and there assumption that higher density developments are more sustainable[2] which leads to more wealth creation and decrease the cost of city’s infrastructure as economy can be exploited. Nonetheless it also means that the cost of living gets higher which may lead to a few undesirable social issues. Cities’ advancement leads to many challenges to meet the needs of the cities’ increasing population by not straining land and resources or create lead to social issues. The challenges cities face can be overcome in ways that allow them to continue to thrive and grow, while improving resource use, reduce pollution and poverty. The future we want includes cities of opportunities, with access to basic services, energy, housing, transportation and more for all. Sustainability calls for a decent standard of living for everyone today without compromising the needs of future generations where it has emerged as a planning concept from its beginnings in economics and ecological thinking and has widely been applied to urban development. Urban sustainability is seen as a desirable state of urban conditions that persists overtime[3]. Hence, there is a need for a sustainability assessment approach that requires cities to view environmental impact seriously while simultaneously asserting the value of social and economic. Thus, the positive aspects of cities can be merged into a net benefit approach, where the enduring value of environmental improvement, social gain and economic enhancement can be seen as a joint legacy for the future[4].Urban indicators are no doubt one of the most well known tools to be used to assess the level of urban sustainability in the world now. For the past two decades, extensive research and works has been conducted and tested to improvise the methodology of developing the urban indicators. Currently, there are long lists of urban sustainability indicators that are used by so many institutions or countries that leads to the questions of whether its manageable to be applied justifiably and most importantly the problems it created for the decision makers to decide what needs to be focused to measure the urban sustainability level. Hence, there is urgency in developing a method that is useful in process of selecting the appropriate indicators for decision-making based on the specific current condition of that particular cities or country.The focus of this paper is to apply the methodology of selecting and ranking the urban sustainability indicators. First of all, long lists of urban indicators were compiled from different sources and are short-listed based on ten criteria. Second, Then, the list is further short-listed using the Analytical Hierarchical Process (AHP) tool created by Saaty. Third, an analysis of ranking obtained is presented and finally a brief conclusion with the strength and problems of the present approach are used to conclude on the usefulness of AHP for ranking indicators and its contribution in decision-making.
2. Theoretical Approach
- Four dimensions of sustainability were considered in this paper, namely economic development, social stability, environmental conservation and institutional strength. Economic, social and environmental dimensions are commonly used in most sustainability works, however, institutional dimensions are considered here as it is viewed as another important part of sustainability as it manifests the significance of the new governance in the sustainable development’s policy, modeling and implementation processes to which state governance and the public administration organizations should be actively involved in processes of the structuring and the permanent enhancing of the appropriate provisions for the sustainable development, because the objective of the sustainability is making the impact on the states’ policy increasingly through the global organizations’ information channels and its institutional nets[5].In this paper, Saaty’s decision making theory is applied in which he explained that decision making theory should be able to be used to assist the decision makers in arriving to a decision which should be science of scaling based on mathematic, philosophy and psychology, not being affected by the influence of politics and behaviour[6]. Furthermore, Analytical Hierarchy Process (AHP) is being used in this study, which is a process designed as structured technique to organized and analyzed complex decisions and has been extensively studied and refined up until now[7].AHP allows some small inconsistency in judgment because human is not always consistent. The ratio scales are derived from the principal Eigen vectors and the consistency index is derived from the principal Eigen value[8]. Decision situations to which the AHP can be applied aspects such as choice where the selection of one alternative from a given set of alternatives, ranking where putting a set of alternatives in order from most to least desirable, prioritization where relative merit of members of a set of alternatives is determined as opposed to selecting a single one or merely ranking them. Then, resource allocation where resources among set of alternatives is apportioned, benchmarking where the processes in one's own organization with those of other best-of-breed organizations is compared as well as quality management that deals with multidimensional aspects of quality and quality improvement[9].
3. Methodology
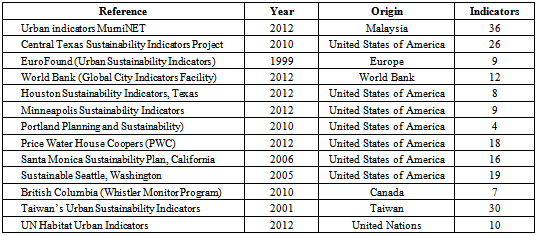
- List of urban sustainability indicators were complied from 13 sources (Table 1). Two steps of elimination were conducted to short-list the number of urban indicators. First elimination were done by doing a checklist according to ten criteria and further eliminated by designing a questionnaire based on the shorter list of indicators. The questionnaires were distributed to 15 graduate students. During the distribution, a briefing was conducted to explain the meanings of the indicators to avoid any misunderstanding. Dummy indicators were included to test the understanding of the graduate students during data analysis.
|
3.1. Elimination of Urban Indicators
|
3.2. Questionnaire Design
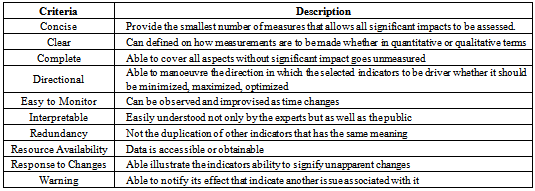
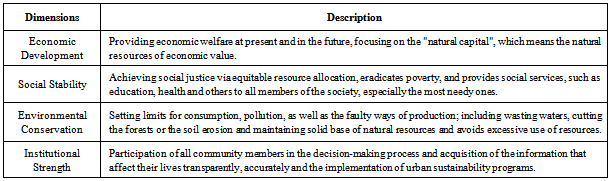
- Questionnaire is formed to further eliminate the 41 numbers of urban indicators, as that numbers are still considered unmanageable. These questionnaires were distributed in a workshop participated by 15 postgraduates students and took approximately an hour including the briefing. The designated questionnaire is divided into two (2) sections; where section A consists of urban sustainability Indicators Dimensions and section B consists four (4) parts of urban indicators. The urban indicators parts are Economic development, Social stability, Environmental conservation and Institutional strength. The questionnaire was modified for the postgraduate students to avoid biasness. The modification started by re-arranging the order of the indicators in the questionnaire by dividing them into three groups; "top-middle-bottom", "bottom-top-middle", and “middle-bottom-top". The reason for this is to avoid the respondents into thinking that the first few urban indicators listed in the each of the category were more important that the others. In addition, one extra dummy urban indicator is added in each of the categories (dimension) to observe if the respondents understood the explanation given on each of the urban indicators before the questionnaires were distributed. The purpose of this questionnaire is to determine the importance of each of the indicators to one another within their dimensions. Table 3 displayed each dimension used in this questionnaire and its explanation.
|
3.3. Data Ranking
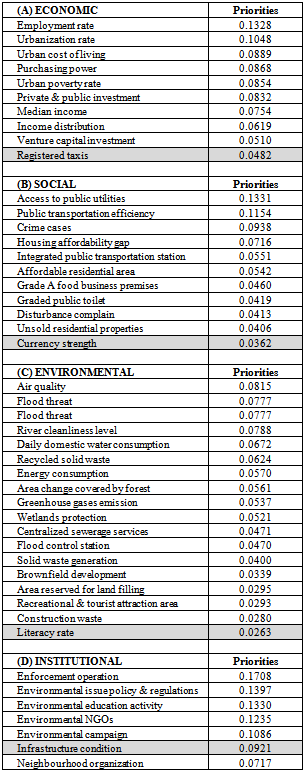
- AHP is being used to analyse the data from the questionnaires. The indicators were compared to each other to obtain their priorities. The perk of using AHP is to allow the respondents to focus judgment separately on each of several properties essential for making a sound decision. Hence, the most effective way to obtain solid judgment is by pairing elements and compares them with single property without taking other properties into consideration. Normalization used in AHP contains information on the total dominance of the alternatives being compared to enable the allocation of the criterion priority to each alternative according to the relative dominance of the alternatives[9]. The result of the questionnaires are shown in the Table 4 as below with the dummy indicators were highlighted and were placed at the bottom of the list of each of the dimension after being prioritize using AHP based on the distributed questionnaires. The indicators were arranged according to their highest priority weights to the lowest priority.
|
4. Analysis of Result
- The numbers of indicators under environmental dimensions are seen as more important to be focused on, followed by economy, then social and institutional. The respondents has more concerns over the significances of prioritizing the environmental dimensions due to the increasing number of sustainability issues cases effecting on the environmental in the country. The environmental issues are probably are more obvious and critical compares the other dimensions as it has been given more awareness through programs created by the government to raise concerns. There are still some ways to improvise this method that is to include more participation from more experts to obtain their opinion from a more technical or scientific view rather than just feelings of biasness. The indicators that have highest priorities were given to “employment rate” in the dimension of Economic Development, “access to public utilities” in Social Stability’s dimension, “air quality” in Environmental Conservation’s dimensions and “enforcement operation” in Institutional Strength’s dimension. The reasons for these priorities results are probably because; “Employment rate” is seen as sign that economy is developing if the population has fixed income and is not living in extreme poverties. As for social stability, high “access to public utilities” shows that the country is capable of providing basic necessities to the people and this contributes to creating a stable living environment. Meanwhile, for environment’s dimension, “air quality” is viewed as the most important issue that needs to be given extra attention, bad air quality signify high air pollution in the air that we breath everyday and this definitely will cause health issues to the humans and affecting the balance of flora and fauna as well. Then, for institutional dimension, “enforcement operation” needed to be implemented by the local authorities. However, the cons of this method are the different opinions from different experts coming from different background. The environmentalist probably are more bias towards environmental issue, economist are more bias towards economy issues and so on. There is a need to have people who are able to overview the significance of the issues without the feeling of biasness, someone who understands the interrelationship between the four dimensions and how important it is to balance the sustainability dimensions in order for everyone to work together towards a more sustainable quality of life.
5. Conclusions
- AHP is found to be really helpful in assisting the decision-makers to eliminate those indicators that are less relevant and focus on the indicators that need to be prioritized to oversee the significant issue for solution or immediate action. The active participation from all the stakeholders is needed to produce better and more efficient needed indicators. In the near future, this application of AHP in selecting the indicators would be applied to the real experts as AHP requires the judgments of the experts and the experts are defined as those who has been involved and working closely with the sustainability concept and works or programs. They could be stakeholders from the Local Authorities, academicians, researchers andnon-governmental organizations.
ACKNOWLEDGEMENTS
- The study was partially supported by Ministry of Higher Education (MOHE) Malaysia and Universiti Teknologi Malaysia under GUP Tier 2 Grant Vot 04J98. Authors extend many thanks to the workshop participants for their time and co-operation.