-
Paper Information
- Next Paper
- Previous Paper
- Paper Submission
-
Journal Information
- About This Journal
- Editorial Board
- Current Issue
- Archive
- Author Guidelines
- Contact Us
American Journal of Materials Science
p-ISSN: 2162-9382 e-ISSN: 2162-8424
2015; 5(3A): 36-38
doi:10.5923/s.materials.201502.06
Surfactant Free Hydrothermal Synthesis of Copper Oxide Nanoparticles
 Abstract
 Reference
 Full-Text PDF
 Full-text HTML
K. J. Arun1, 2, A. K. Batra1, A. Krishna2, K. Bhat1, M. D. Aggarwal1, P. J. Joseph Francis3
1Department of Physics, Chemistry and Mathematics, Alabama Agricultural & Mechanical University, Normal, Alabama, USA
2Department of Physics, Sree Kerala Varma College, Thrissur, Kerala, India
3Department of Applied Sciences, Oman Medical College, Sultanate of Oman
Correspondence to: A. K. Batra, Department of Physics, Chemistry and Mathematics, Alabama Agricultural & Mechanical University, Normal, Alabama, USA.
| Email: |  |
Copyright © 2015 Scientific & Academic Publishing. All Rights Reserved.
This paper describes a simple and versatile method for growing anisotropic plate shaped CuO nanostructures by simple, low temperature, and cost effective hydrothermal method. Scanning electron microscopy illustrated that the CuO nanostructures had an average particle size of 27nm. Structural analysis revealed that the CuO nanostructures had high crystal quality with the monoclinic crystal structure. Energy dispersive X-ray spectroscopy studies demonstrated that the sample was composed of CuO. The FTIR study also indicated the single-phase property and high crystallinity of as grown CuO nanostructures from its precursors. The optical band gap energy was very much larger than that of its reported values.
Keywords: Hydrothermal synthesis, Copper oxide nano-particles, Quantum confinement
Cite this paper: K. J. Arun, A. K. Batra, A. Krishna, K. Bhat, M. D. Aggarwal, P. J. Joseph Francis, Surfactant Free Hydrothermal Synthesis of Copper Oxide Nanoparticles, American Journal of Materials Science, Vol. 5 No. 3A, 2015, pp. 36-38. doi: 10.5923/s.materials.201502.06.
Article Outline
1. Introduction
- Nanostructures with well-defined shape and inner structure have attracted great interest due to their novel properties and diverging applications [1–3]. Hydrothermal method has gained space as a versatile method for the preparation of copper oxide in temperatures ranging from 373 to 473K [1]. Metal oxides represent the most diverse class of materials with properties covering almost all aspects of Materials Science and Physics. Copper oxide, an important p-type semiconductor with the band gap in the range of 1.8 – 2.5 eV [1], has obtained increasing interest because it has many potential applications in solar energy conversion, photo catalytic degradation of organic pollutants. Copper oxide is used in consumer products such as pillowcases and socks due to its cosmetic and antimicrobial properties [4-6]. In the present study, nano-CuO was prepared without any additive like ionic liquids capping agents.In this paper, we report the preparation of CuO nano-particles by hydrothermal method and its characterization by X-ray diffraction (XRD) and Fourier transform infrared spectroscopy (FTIR). The morphology of CuO nanostructure is observed by scanning electron microscopy and chemical composition is analyzed by energy dispersive x-ray spectroscopy.
2. Experimental Details
- CuO nano-particles are prepared using copper sulphate and sodium hydroxide as reactants. Stock solution of CuSO4.2H2O (0.1 M) was prepared in 100ml double distilled water. To this stock solution, NaOH (.3 molar) solution prepared in double distilled water is added under continuous stirring in order to get the pH value of reactants at 9. The solution is next transferred into Teflon lined sealed stainless steel autoclaves and maintained at a constant temperature of 200°C for 6 hours under autogenous pressure. It is then allowed to cool naturally to room temperature. The precipitate so obtained is placed in a furnace and annealed in air at 250°C for 1 hour.The x-ray diffraction data are recorded by using Cu Kα radiation (1.5406Ao) over a 2θ range of 20-80°. UV-Vis-NIR spectrum of CuO nano-particles from 190 nm to 1200 nm is recorded by Varian, Cary 5000 spectrophotometer. Molecular structure is confirmed by Thermo Nicolet, Avatar 370 FT-IR spectrometer. The morphology of the nano-powder is studied by SEM (JEOL Model JSM - 6390LV) and chemical composition is examined by EDAX using JEOL Model JED – 2300 attached to a scanning electron microscope with a magnification of 10000 with a voltage of 20KV.
3. Results and Discussions
3.1. X-ray Diffraction Studies
- The x-ray diffractogram of the CuO nano-particles recorded by using Cu Kα radiation is shown in figure 1. The average particles size of the samples was estimated by using the Debye Scherrer equation D=0.9λ/(βCosθ)λ is the wavelength (CuKα), β is the full width at the half-maximum, θ is the diffraction angle.
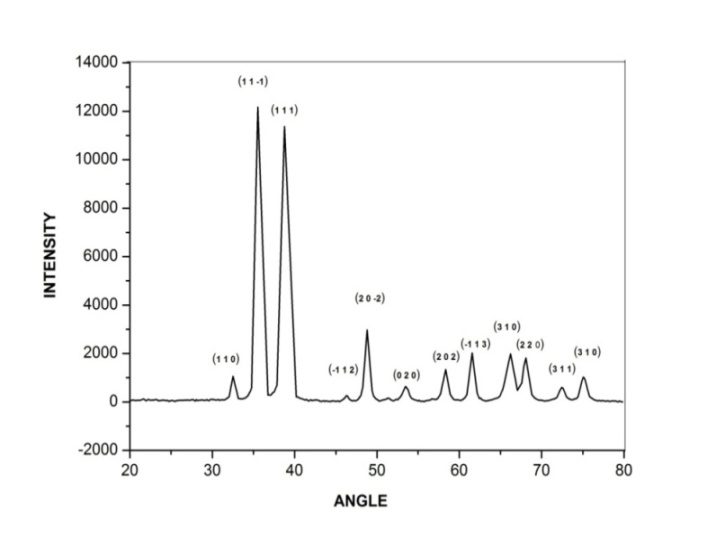 | Figure 1. X ray diffractogram of CuO nano particles |
3.2. Fourier Transform Infrared Spectroscopy Analysis
- The FTIR spectrum of the sample is taken and shown in figure 2. The spectrum shows the following characteristics: the peaks 437.14 cm-1 (Cu-O symmetric stretching), and 522.08 cm-1 (Cu-O asymmetric stretching) and 600.78 cm-1 (Cu-O wagging) imply the presence of metal-oxide group in the sample. The vibration peak 3434 cm-1 indicates the presence of hydroxide group in the sample. This may be due to the water attached to the surface of the CuO nano-particles, which is also one of the byproducts of the reaction and can be removed by further heating. The metal–oxygen bond is observed at 1383 cm-1 (M-O rocking in plane) and at 1634 cm-1 (M-O rocking out of plane) indicates the formation of CuO from copper sulphate.
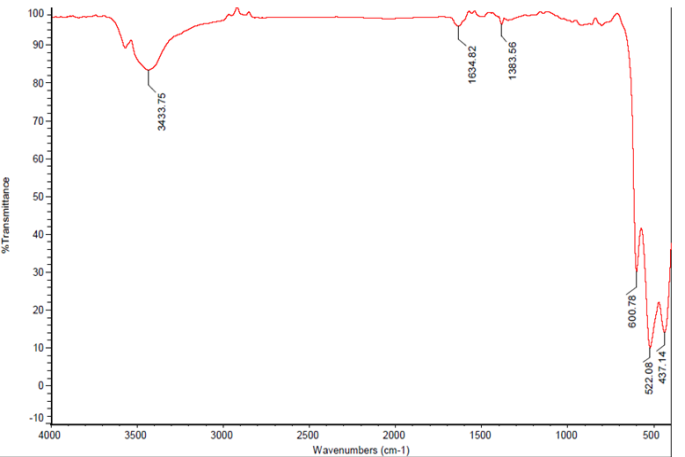 | Figure 2. FTIR spectrum of CuO nano particles |
3.3. UV/Vis/NIR Absorption Spectroscopic Studies
- The optical characterization of the sample is recorded on UV-Vis absorption spectrophotometer as shown in figure 3 in order to determine the Band gap energy of nano-CuO. The fundamental absorption, which corresponds to electron excitation from the valence band to the conduction band, can be used to determine the value of the optical band gap. The relationship between the absorption coefficient α and the incident photon energy hυ can be written as(αhυ) = A (hυ-Eg)nA is a constant. The band gap estimated for the sample is 4.2 eV, which is greater than that for bulk CuO (2.1eV) and is more than the reported values. The higher band gap is attributed to the lowered particle size. When the size of nano-crystals is smaller than the Bohr radius of the excited electron-hole pair, quantum confinement effect occurs and the band gap energy starts to increase with the decrease of particle size.
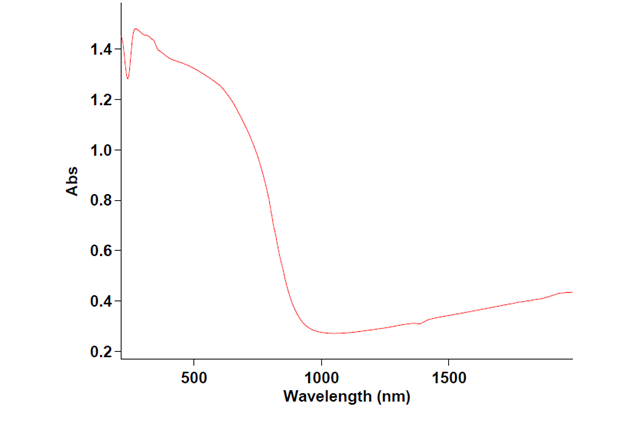 | Figure 3. UV/Vis/NIR spectrum Cuo nano particles |
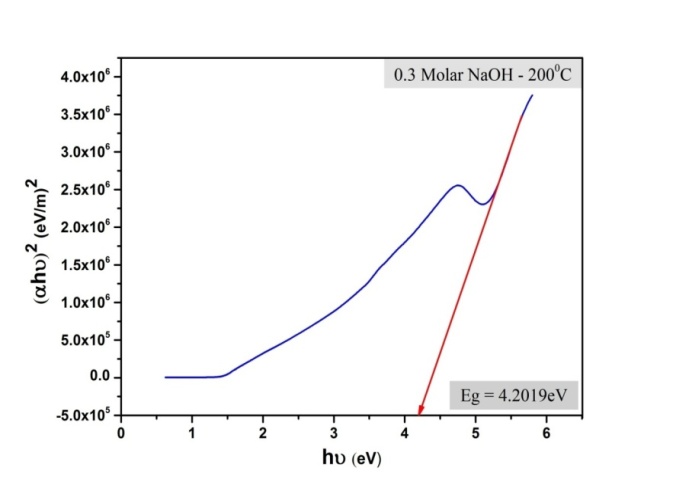 | Figure 4. Graph showing the energy band gap of CuO nanoparticles |
3.4. SEM-EDS Analysis
- The SEM-EDS analysis is done with SEM Machine: JEOL Model JSM - 6390LV and EDS Machine: JEOL Model JED – 2300 at magnification of 10000 with a voltage of 20KV. The scanning electron microscope picture of the synthesized sample is shown in figure 5. It is seen that CuO nano-particles formed have an irregular planar structure with no distinct morphology. The EDS analysis carried out on the sample is depicted in figure 6, in which characteristic peaks corresponding to Cu and oxygen are seen and there is no traces of precursors, which shows the purity of the CuO nano-particles formed.
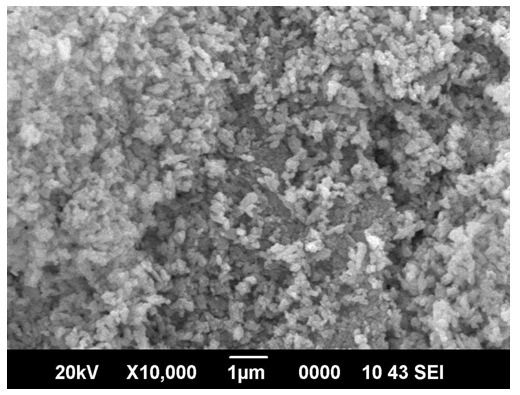 | Figure 5. Scanning electron micrograph of CuO nano-particles |
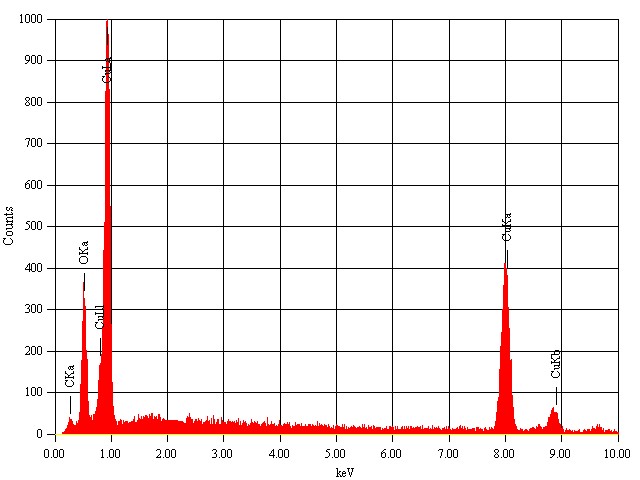 | Figure 6. EDX spectrum of annealed CuO nanoparticles |
4. Conclusions
- By surfactant free hydrothermal synthesis, CuO nano-particles with particle size below 30nm are obtained. The XRD analysis results show that monoclinic CuO-crystals were formed with particle size ranging from 14nm to 27nm. The SEM analysis shows that nano-CuO formed had an irregular plate-like shape. The FTIR results show the presence of copper as oxides. The UV-VIS-NIR result is in accordance with the quantum confinement, since the energy gap increases as the particle size decreases. The energy gap in CuO nano-powder is found to be 4.2eV, which is greater than that previously reported.
ACKNOWLEDGEMENTS
- The authors gratefully acknowledge support for this work through the National Science Foundation grant #EPSCoR R-II-3 (EPS-1158862) and DHS grant #2010-ST-062- 000034. The authors extend special appreciation to Professor Chance Glenn, Dean, college of Engineering, Technology and Physical Sciences for his keen interest in our research.