-
Paper Information
- Next Paper
- Previous Paper
- Paper Submission
-
Journal Information
- About This Journal
- Editorial Board
- Current Issue
- Archive
- Author Guidelines
- Contact Us
American Journal of Materials Science
p-ISSN: 2162-9382 e-ISSN: 2162-8424
2015; 5(3A): 21-30
doi:10.5923/s.materials.201502.04
Influence of Surface Passivation by L-Arginine on Linear and Nonlinear Optical Properties of Ag-PVP Nanocomposite
 Abstract
 Reference
 Full-Text PDF
 Full-text HTML
A. L. Sunatkari1, S. S. Talwatkar2, Y. S. Tamgadge3, G. G. Muley4
1Department of Physics, Siddhartha College of Arts, Science and Commerce, Fort, Mumbai, India
2Department of Physics, N.G. Aacharya and D.K. Maratha College of Arts, Science and Commerce, Chembur, Mumbai
3Department of Physics, Mahatma Phule Arts, Commerce & S.R.C. Science College, Warud, India
4Department of Physics, Sant Gadge Baba Amravati University, Amravati, India
Correspondence to: G. G. Muley, Department of Physics, Sant Gadge Baba Amravati University, Amravati, India.
| Email: |  |
Copyright © 2015 Scientific & Academic Publishing. All Rights Reserved.
We have investigated the effect of surface passivation using L- arginine on nonlinear optical responses, localized surface plasmon resonance(LSPR)and size of colloidal silvernano-particles (AgNPs) synthesized by chemical reduction method. The nonlinear optical responses of AgNPs embedded in the polyvinyl pyrrolidone (PVP) matrix were investigated using Z-Scan technique with wavelength 632 nm under the continuous wave (CW) regime. The surface plasmon resonance absorption peak of AgNPs showed a blue shift with an increase in L-arginine concentration. Transmission electron microscopy (TEM) analysis confirmed that the average size of AgNPs reduced from 10 nm to 6 nm as the concentration of L-Arginine increased from 1 mM to 5 mM. The sign of nonlinear refractive index was found negative, which was of a self-defocusing nature and the magnitude was in the order of 10-4 cm2/W. Very large third-order nonlinear susceptibility (
 ~10-4 esu) was estimated. Both nonlinear refractive index and third-order nonlinear susceptibility were found to decrease as the concentration of L-arginine increased. Fourier Transform-Infared (FT-IR) studies revealed strong bonding between L-arginine functional groups and AgNPs. The X-ray diffraction study confirmed the formation of face-centred cubic (fcc) structured AgNPs. Based on the results, we have proposed that this material possesses a high potential for various optoelectronic device applications.
Keywords: L-arginine, Nonlinear refractive index, Nonlinear optical susceptibility, Silver nano-particles, Z-scan technique, AgNPs, Fourier transform infrared spectroscopy
Cite this paper: A. L. Sunatkari, S. S. Talwatkar, Y. S. Tamgadge, G. G. Muley, Influence of Surface Passivation by L-Arginine on Linear and Nonlinear Optical Properties of Ag-PVP Nanocomposite, American Journal of Materials Science, Vol. 5 No. 3A, 2015, pp. 21-30. doi: 10.5923/s.materials.201502.04.
Article Outline
1. Introduction
- In recent years, nonlinear optical (NLO) properties of metal (Au, Ag, Pt, and Cu) nano-particles (MNP) embedded in adielectric matrix attracted great attention owing to their potential applications in catalysis, optical storage, photonics, sensors, optical switching, optical energy transportation, and thermal therapy [1-5]. AgNPsare of a very special class due to their potential applications in optics, catalysis, biological labeling, antibacterial applications, and surface enhanced Raman scattering (SERS) detection [6-12]. In the search of novel materials aiming atoptoelectronics device applications, thin films containing MNPs dispersed into the polymer matrix are very promising owing to the huge enhancement in the nonlinear refractive index (n2) and third-order nonlinear susceptibility (
 ) [13-17]. The investigations on
  in the vicinity of LSPR of MNPs, specifically gold nano-particles embedded in various matrices, were carried out and huge third-order nonlinear susceptibility as large as
  ≈10-6 esu was found [18-20]. For AgNPs doped in the glass matrix, the magnitude of
  in the order of 10-7 esu was obtained [21]. The large enhancement in the nonlinear optical responses is ascribed to the several factorssuch as SPR, size of the MNPs, effective refractive index of dielectric matrix, absorption coefficient, and mainly local field effects. However, for optoelectronic devices, which are based on the continuous wave (CW) laser operation or high repetition rates, the thermo-optic effect become dominant.Numerous reports are available about the effect of surface passivation on the properties of MNPs, which would play a vital role in the applications such as biosensors [22], DNA/drug delivery [23], Imaging [24], bio diagnostic, and optoelectronics devices [25]. Common choice for MNPs surface modification is thiol-mediated binding of ligands [26-27]. Aniline, long-chain amine carboxylic compounds have been used as stabilizers in the synthesis of MNPs [28]. Researchers have also studied the role of Poly-Vinyl Pyrrolidone (PVP), polyacrylate and polyacrylamide as protective agents, which can effectively alter shape, size, stability, and linear optical properties of AgNPs [29]. More recently, researchers have diverted attention to the binding of metal NPs with amino-acids [30]. Amino acids are inherently compatible, and one of the common amino acids is L-arginine, which has zwitterrionic structure. Upon functionalization of MNPs with L-arginine molecules, they can highly facilitate the interaction and hence have a potential to bring drastic changes in NLO properties. Joshi et al. (2004) reported the synthesis of L-lysine capped gold nano-particles [31]. Bhargava et.al (2005) reported the synthesis of gold nano-particles using the amino acids such asL-tyrosine, glycyl-L-tyrosine, and L-arginine as a reducing agent [32]. To the best of our knowledge, reports are not available on the use of L-arginine as a protective agent in the synthesis of AgNPs. Therefore, we have used L-arginine for surface modification in the synthesis of AgNPs.Various methods such as degenerate four-wave mixing (DFWM), NLO interferometry, PPTFS (Pump-Probe technique of femtosecond spectroscopy), and VSD (Vectorial self-diffraction) have been used to measure NLO susceptibility and nonlinear refractive index [33, 21]. Among these, Z-scan method is extensively used because of its simplicity and accuracy. Further, this method gives not only real and imaginary part of third-order susceptibility but their respective sign too. Information on their sign is of great interest for applications in optoelectronic devices.The objective of this work is to synthesize silver nano-particles in colloidal form with various concentrations of the stabilizer (L-arginine) followed by its dispersion into PVP matrix to fabricate thin films by spin coating method and to study the effect of L-arginine concentration on SPR, size of AgNPs, nonlinear refractive index, and third-order NLO susceptibility.
2. Experimental Section
2.1. Chemicals
- Analytical grade chemicals, i.e. Silver nitrate (AgNO3, 99.999% purity), sodium borohydride (NaBH4, 98% purity), L-arginine (99% purity), and PVP (MW 10000) were purchased from Sigma-Aldrich and used without further purification. De-ionized water was used in thesynthesis process. L-arginine was used as a stabilizing agent and NaBH4 was used as a reducing agent.
2.2. Synthesis of L-Arginine Passivated Silver Nano-Colloids
- Stock solutions of 1 mM silver nitrate (AgNo3), 2 mM sodium borohydride (NaBH4) were prepared. L-arginine solutions with 1, 2.5, and 5 mM concentrations were prepared separately by dissolving appropriate amount in de-ionized water. All solutions were kept in ice-bath for 20 minutes. In three separate 200 ml volumetric flasks, 20 ml doubled distilled water, 10 ml NaBH4, and 5 ml L-arginine solutions were taken and stirred at 50°C for 20 minutes. Silver nano-colloidal solution was obtained by drop wise addition of 5 ml silver precursor into the above mixture. The solution turned dark violet in colour in 10 minutes indicating the formation of silver nano-particles, which were stable for a duration of 3 months.
2.3. Fabrication of Thin Films
- PVP solution was prepared by dissolving PVP powder (15 wt%) into 100 ml doubled distilled water and was stirred for 1 h at 40°C. An appropriate amount of silvercolloidal solution and PVP solution wasmixed,and the solution was further stirred for 1 hour to get ahomogeneous viscous mixture. This mixture was used to fabricate thin films by spin coating method. Prepared thin films were used in the Z-scan measurement to study their NLO properties and for other characterizations.
2.4. Characterisation
- UV-vis spectrophotometer (Black-C-SR-50, Stellarnet, USA) was used to record absorption and transmission spectra in the spectral range 190 -1000 nm. Average size and shape of AgNPs were determined by TEM using theJEM-2100F (make- JEOL, Japan) andhaving a point-to-point resolution of 0.19 nm. Powder XRD spectra recorded using Rigaku rotating anode (H-3R) diffractometer (MiniFlex II) with irradiation from Kα line of copper (λ=1.5418 Å) and angle 2θ, ranging from 20 to 80°C was used. FT-IR spectra were obtained with the instrument, having the hyperion microscope with a vertex 80 FT-IR system -3000 (Maker - Bruker, Germany) in the range of 450-7500 cm-1.
2.5. Measurements of Nonlinear Optical Properties
- Nonlinear optical responses, i.e, nonlinear refractive index and third-order nonlinear optical susceptibility were investigated by Z-scan technique with the He-Ne laser (λ = 632 nm) under CW regime.
3. Results and Discussion
3.1. UV-Visible Study
- Fig.1 depicts UV-Visible absorption spectra of L-arginine stabilized colloidal AgNPs prepared by reducing silver nitrate with sodium borohydride in the wavelength range 300 – 600 nm. Generally, AgNPs exhibit a surface plasmon resonance absorption peak in the range of 380 – 430nm. A characteristic plasmon band due to resonance phenomenon of free electrons in the conduction band of silver nano-particles is observed at 405, 395, and 391 nm for 1 mM, 2.5 mM, and 5 mM L-arginine concentration respectively. This explains the blue shift in the optical absorption peak as the concentration of L-arginine (stabilizing agent) increases. The shift towards lower wavelength side (blue shift) also indicates that size of AgNPs is reducing as the concentration of stabilizer is increasing. Further, it is well noted from absorption spectra that the intensity of absorption is decreased with an increase of the L-arginine concentration, which is attributed to a decrease in the concentration of AgNPs and their size as well [34-35].
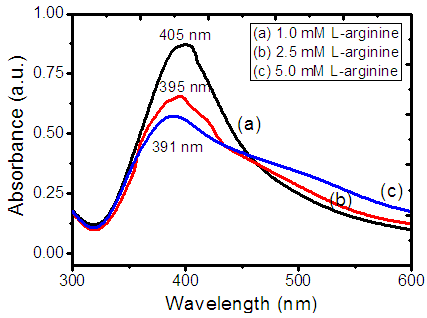 | Figure 1. Absorption spectra of Silver nano-colloids with (a) 1 mM (b) 2.5 mM (c) 5 mM L-arginine concentration |
3.2. Structural and Morphological Study
- Fig.2 illustrates X-ray diffraction spectra (X-RD) of AgNPs embedded in the PVP matrix. The diffraction peaks at 2θ ≈ 38.11°, 44.27°, 64.42°, and 77.47° indexed to the (111), (200), (220), and (311) planes of face-centered cubic crystal structure of silver respectively. The intensity of all peaks matched with JCPDS data given in the literature (PDF card No- 040783). The line broadening of the X-ray diffraction peak is mainly due to small particle size. The broad peak (hump) around 2θ = 25° suggests the existence of PVP [39]. From full-width at half maximum (FWHM) of diffraction peaks, the average size of AgNPsis estimated using Debye-Scherrer equation 2R = 0.9λ/β cosθ [40], where 2R is the size (diameter) of QD, β is full-width half maxima (FWHM) of XRD peak in radians, θ is thediffraction angle, and λ is wavelength of X-ray (1.540598Å).
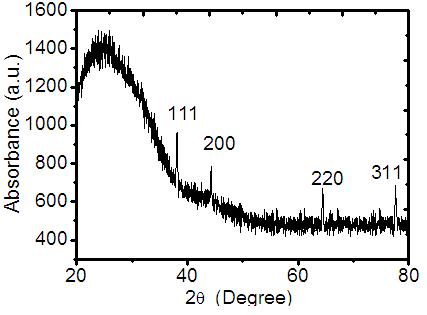 | Figure 2. X-RD spectra of Ag-PVP thin film |
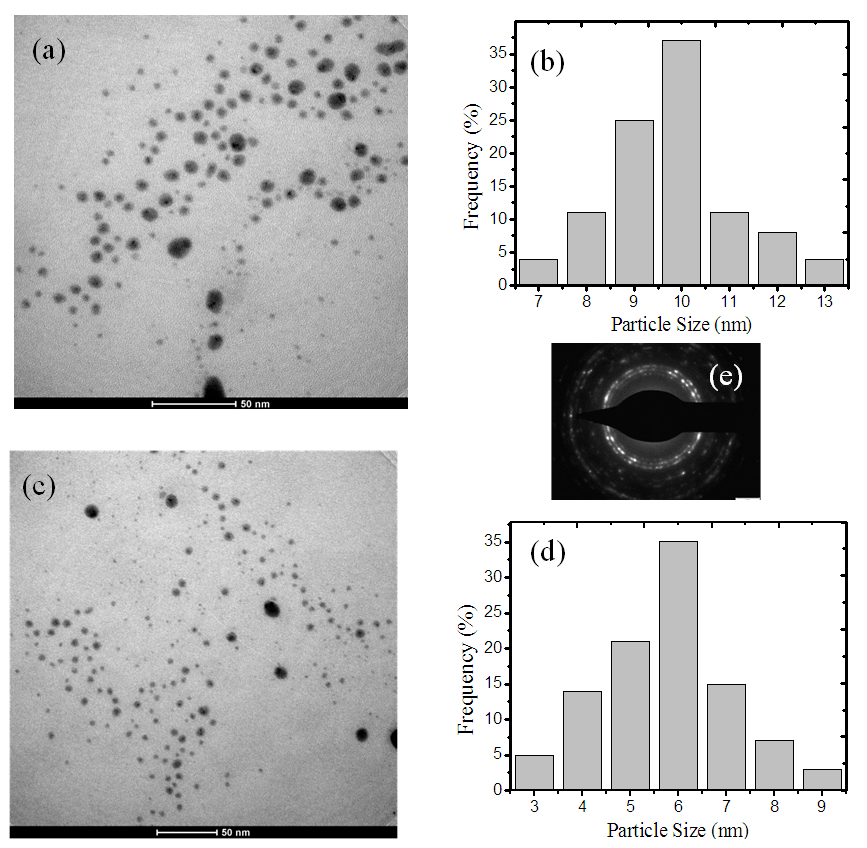 | Figure 3. (a) TEM image of Ag nano-particles stabilised in 1mM L-arginine, (b) corresponding particle size distribution, (c) TEM image of Ag Nano-particles stabilised in 5mM L-arginine, (d) represents corresponding particle size histogrames and (e) SAED pattern |
3.3. FTIR Study
- Fig. 4 Exhibits Fourier Transform infra-red spectra (FT-IR) of silver nano-colloids stabilized in the L-arginine prepared by reducing silver nitrate with sodium borohydride. The spectra reveal the interaction of silver nano-particles with L-arginine functional groups. It is observed that the intensity of different peaks reduces with an increase in L-arginine concentration suggesting the formation of strong bonding between AgNPs and L-arginine functional groups. This results in the formation of smaller size particles for higher L-arginine concentration. This, in turn, reduces
 .
. | Figure 4. FTIR spectra of silver nano colloids stabilised in 1, 2.5 and 5 mM L-arginine |
3.4. Nonlinear Optical (NLO) Study
- NLO properties of L-arginine stabilized AgNPs embedded in the PVP polymer matrix were investigated by using single beam Z-Scan technique [46-47]. Fig.5 shows the schematic diagram of the experimental setup of the Z-scan technique. The He-Ne laser with wavelength 632 nm was used as anexcitation source under CW regime.
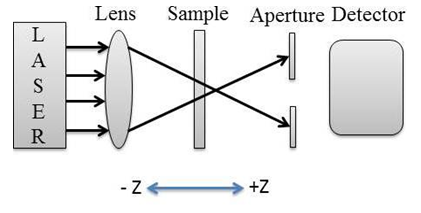 | Figure 5. Experimental Z-scan setup for closed aperture measurements |
 . It is possible to measure the nonlinear absorption by removing the aperture in the far field. In the open-aperture Z-scan experiments, the curves are symmetric with respect to the focal point, where they exhibit a minimum transmittance in the case of reverse saturable absorption and a maximum for the saturable absorption. If the materials exhibit both nonlinear refraction and absorption properties, one can obtain a pure nonlinear refractive index
  by dividing the closed aperture data by the open aperture data [48].The difference between normalized peak-valley transmittance
  can be directly measured by this technique based on equations given in [46-47]. The change in normalized peak-valley transmittance is given by
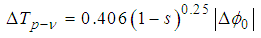 | (1) |
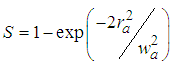 is linear aperture transmittance, where
  is aperture radius and
  is the beam waist. The maximum nonlinear phase shift
  can be obtained by the following equation:
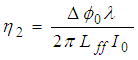 | (2) |
 is the intensity of a laser beam (13.16 MW/m2) at focus z = 0,
 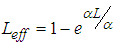 is the effective length of the sample and is the thickness of the sample,
  is the linear absorption coefficient [49]. In our experimental setup, a low power (13.16 mW) laser beam was focused by using aconvex lens with a focal length of 20 cm. The spot size at the focus was determined using CCD camera (Thorlab, BC106-VIS) and was found to be 44 μm (beam waist, ω=22 μm and Rayleigh range, z0=2.4 mm).The real and imaginary parts of the third-order NLO susceptibility (
 ) were estimated based on the nonlinear refractive index
  ,
,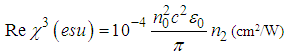 | (3) |
 is the permittivity of vacuum,
  is the linear refractive index,
  is the velocity of light in a vacuum. The absolute value of the third-order NLO susceptibility is a calculation from the real and imaginary values.The normalized transmittance is plotted against the sample position. Fig.6 shows the closed aperture normalized transmittance curves of Ag-PVP thin film. The solid lines indicate the theoretical fits.
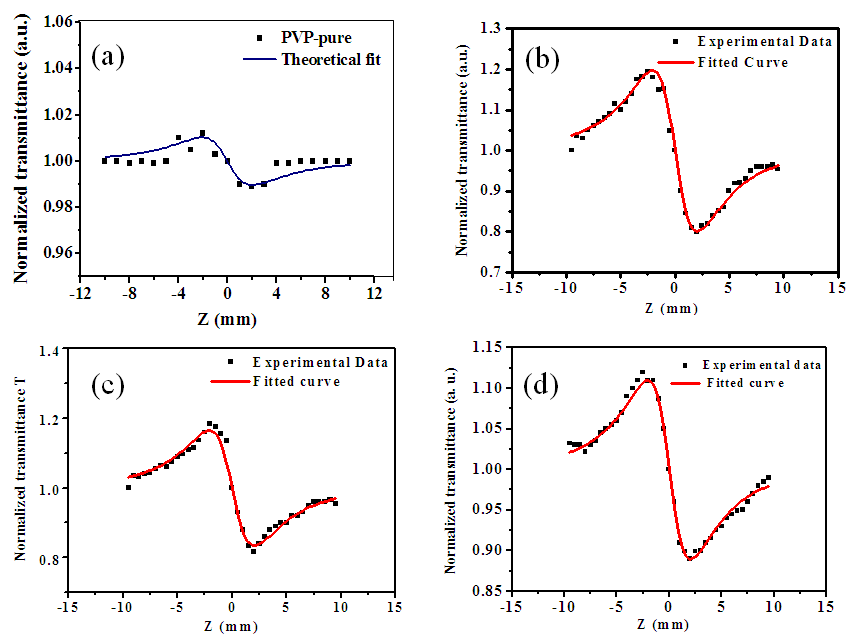 | Figure 6. Closed aperture Z-scan curves of Ag-PVP nanocomposite for (a) Pure PVP (b) 1 mM (c) 2.5 mM (d) 5 mM L-arginine concentration |
 is zero.From the peak-valley variation of the transmittance curve
 , it is possible to calculate the maximum nonlinear phase shift
  that can be used to find the nonlinear refractive index
  , by knowing the incident laser power. Nonlinear absorption measurements can be done by removing aperture in the far field. The nonlinear refractive index
  and third-order nonlinear susceptibility (
 ) are calculated for various concentrations of L-arginineand are listed in Table 1. We have also taken Z-scan measurements for pure PVP to estimate the nonlinear refractive index
  and (
and ( ). It is found that
  and (
and ( ) for pure PVP are in the order of 10-6 cm2/W and 10-6 esu, respectively, whereas for composite thin films,
  and (
and ( ) are found in the range of 10-4.R. A. ganeev et.al [50] studied AgNPs in various media such as ethanol, ethylene glycol, and water, and measured
  as high as 10-8 esu. Numerous results are reported by A. L. Stepanov [33]. Nonlinear optical responses of AuNPs in various matrices such as SiO2, TiO2, and Al2O3 are studied and third-order nonlinear susceptibility (
 ) as large as 10-7 esu and nonlinear refractive index
  up to 10-8 have been obtained. We have estimated huge enhancement in
  ≈ 10-4 esu and
  ≈ 10-4 cm2/W.Table 1 reveals that the nonlinear refractive index
  and third-order NLO susceptibility (
 ) decreased linearly with an increase in the L-arginine concentration. This may be due to the decrease in the particle size (as confirmed from TEM images) as the L-arginine concentration increases. Similar results were obtained by E. Shahriari et. al. [49] while studying the effect of concentration and particle size of gold nano-particles on the nonlinear refractive index, and found that
  decreased as the particle size/Au concentrationis reduced. In our sample,
  is reducing with the particles size. This effect is explained by Fukumi et.al [51]. They demonstrated that
  is proportional to the fourth power of particle radius, volume fraction of the metal colloid particles, and third-order susceptibility of the metal particles only,
  . Aggregation of the sample also leads to the increase of the nonlinear optical response. R. A.Ganeev et.al (2005) found that
  is increased from 10-15 esu to 10-14 esu, and
  is increased from 1.43
  10-11 to 16.0
  10-11 when aggregation rate of silver nano-particles was increased from 0 to 0.80. In our case, TEM images (fig.3) show small agglomeration for 1mM L-arginine concentration, and as the L-arginine concentration increased to 5 mM, well separated smaller AgNPs are formed [21, 50]. This can be another reason why
  is decreasing with increasing L-arginine concentration.
|
 and
and  Measured for Ag-PVP Thin Film at Different Concentration of L-Arginine and Pure PVP
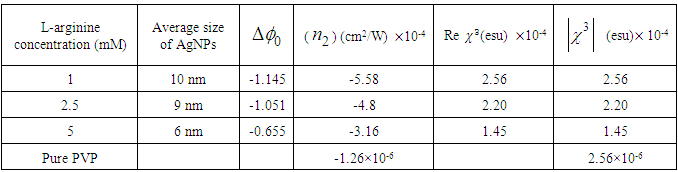
 is smallest in magnitude and inversely proportional to the cube root of the particle radius,(b) Interband transitions from the valence band to empty the conduction band occurs. For nano-particles in the range of 5 – 15 nm, interband nonlinearity near LSPR is 100 times greater than intraband nonlinearity and is also independent of the nano-particlessize, (c) electrons in the conduction band absorb a photon and get heated, yielding what is called hot electrons. The hot electron transitions are particularly strong and can be dominant in the metal cluster. This transition produces
  with a magnitude 10 to 104 times as high as intraband transitions. All the above transitions have a picosecond response time. Moreover, in the CW laser regime, the nonlinear optical response of AgNPs in the dielectric matrix is caused by thermal-induced nonlinearity, indicating a temporal variation of refractive index due to nonlinear absorption in the medium and to non-radiative relaxation down to the ground state. This thermal pulse leads to the generation of acoustic waves that change the density of medium, followed by a variation of refractive index of the medium [50, 52-53]. In our experiments, thermal nonlinearity is mainlycontributing as we used a CW laser. Opticalnonlinearity of the composite thin films constitutes thermal and electronic nonlinearity. Irradiation of samples (thin films) with CW laser causes thermal nonlinearity domination, whereas irradiation with pulsed laser having low repetition rateelectronic nonlinearity dominates the optical nonlinear phenomenon. Thermal nonlinearity can be suppressed by replacing CW laser with pulsed laser.The origin of the huge enhancement in nonlinear optical responses has been explained by several authors. K. Dolgaleva et. al. [54] predicted the ten fold enhancement in nonlinear optical responses as due to local field effects. The enhancement is specially hugein the metal-dielectric nanocomposite materials due to the combined effect of surface plasma resonances and the local field effect. In the metal-dielectric composite, surface plasmon excitations are localized in the small nano-region called hot-spots. Electromagnetic energy accumulated in the hot-spots associated with localized plasmons led to local fields that can exceed the intensity of applied field by four or five times in magnitude [55-57]. The high local fields in the hot-spots resulted in a huge enhancement in nonlinear optical responses. Local field factor also became dependent on the dielectric constant
  of dielectrichost matrix as thelocal field factor (f) takes the form of
  near SPR. Therefore, the matrix with a larger dielectric constant makes the composite gain the larger value of f, and SPR peak also shifts due to the energy dependence of dielectric constant. Hence, metal particles embedded in a composite matrix usually have larger optical nonlinear responses near their individual SPR. Specifically, third-order nonlinear optical susceptibility (
 ) becomes proportinal to the fourth power of the local field factor under the condition of low metal concentration [58-61]. Finally, the huge enhancement in the nonlinear optical responses of AgNPs embedded into PVP matrix is due to the LSPR, thermo-optic effect, and the local field factor.
4. Conclusions
- In conclusion, highly stable AgNPs were synthesized using L-arginine as a stabilizer by chemical reduction method and dispersed into the PVP matrix. The effect of the L-arginine concentration on LSPR, the size of AgNPs, nonlinear refractive index, and the hird-order NLO susceptibility were studied. A sizable enhancement in the magnitude of nonlinear refractive index
 in the order of 10-4 cm2w-1 and third-order NLO susceptibility (
 ) in the order of 10-4 esu wasdetected. The magnitude of
  and
and  was found to decreasewith an increase in the concentration of L-arginine. The negative sign of
  indicates a self-defocusing phenomenon of Ag-PVP nano-composite. The enhancement of
  and
and  in the composite film was due to the combined effect of SPR, thermo-optical phenomenonand local field factor. No nonlinear absorption was observed in all samples. The average size of AgNPs, as analysed by TEM, was found to decreasefrom 10 nm to 6 nm with anincrease in the L-arginine concentration from 1mM to 5 mM. X-RD study confirmed the presence of fcc structuredof AgNPs in thin films. The blue shift in the SPR peak position wasobserved. The strong bonding between AuNPs and L-arginine functional groups was confirmed from FT-IR study. These results demonstrate that our study has good potential in optoelectronic device applications.
ACKNOWLEDGEMENTS
- Author (A. L. Sunatkari) is grateful to the University Grants Commission (UGC) of India for providing financial assistance under Minor Research Project (File No. 47/1690/10). The Authors acknowledge the support of the Director, SAIF facility, IIT-Bombay, Mumbai for providing FT-IR and TEM facilities and Chairman, DST-FIST, SGB Amravati University, Amravati for providing XRD facility.