Ong-Hui Lin1, Jyun-Yi Lai2, Hsin-Yi Tsai2
1School of Materials Engineering, Universiti Malaysia Perlis, Malaysia
2Instrument Technology Research Center, National Applied Research Laboratories Hsinchu, Taiwan
Correspondence to: Hsin-Yi Tsai, Instrument Technology Research Center, National Applied Research Laboratories Hsinchu, Taiwan.
| Email: |  |
Copyright © 2012 Scientific & Academic Publishing. All Rights Reserved.
Abstract
Diabetes is a chronic disease related to abnormal metabolism. In this paper, a non-invasive and precise image measurement system for cutaneous blood oxygen saturation (SpO2) was constructed to monitor the peripheral blood SpO2 levels of patients with diabetes. A light control module was used to control the intensity of irradiation from light-emitting diode (LED) lamps consisted of varying wavelengths (660/890 nm and 660/940 nm). By using the reflective characteristics of skin tissue, the cutaneous blood SpO2 levels in patient extremities were obtained. The proposed non-invasive method can be employed to monitor and prevent pathological changes in the peripheral nerves of the extremities and in the blood.
Keywords:
Diabetes, Oxygen saturation, Skin images
Cite this paper: Ong-Hui Lin, Jyun-Yi Lai, Hsin-Yi Tsai, Preventing Diabetes Extremity Vascular Disease with Blood Oxygen Saturation Images, International Journal of Instrumentation Science, Vol. 2 No. A, 2013, pp. 1-7. doi: 10.5923/s.instrument.201306.01.
1. Introduction
Diabetes is a chronic disease indicating abnormal metabolism. Recently, ageing populations and dietary and lifestyle changes have increased the annual incidence rate of diabetes and lowered the age of onset. Because diabetes causes numerous subsequent complications, clinicians must endeavor to improve the control of diabetes and reduce the occurrence of complications. Patients with diabetes must continually monitor their blood glucose levels to ensure their stability. Currently, household blood glucose monitoring technology is primarily divided into electrochemical sensors and photometers. Electrochemical sensors use electrical current that is produced during the reaction detection process to obtain blood glucose levels; the sensors employ an electric current counter to read and convert the electrons produced during the enzyme and glucose reaction process to determine glucose concentration values. Photometers use the colour changes produced during the reaction detection process to obtain blood glucose levels: After the blood reacts with an enzyme on the test strip, its colour alters, and an optical lens is then used to convert the reflected or penetrated colour signals to determine the blood glucose levels. Both tests require invasive blood sampling, which occasionally reduces the willingness of patients to undergo testing. Moreover, the accuracy of the test results declines when the test strips are cross-contaminated or influenced by moisture when exposed to human touch or when they are left in an external environment for a prolonged period. The current U.S. Food and Drug Administration specifications for regulating the accuracy of blood glucose monitoring systems are as follows: An error tolerance rate of ±20 mg/dL for blood glucose levels exceeding 100 mg/dL, and an error tolerance rate of ±20 mg/dL for blood glucose levels lower than 100 mg/dL. Conversely, the International Organization for Standardization (ISO)/Draft International Standard (DIS) requires an error tolerance rate of ±20 mg/dL for blood glucose levels greater than 75 mg/dL, and an error tolerance rate of ±15 mg/dL for blood glucose levels lower than 75 mg/dL. Regardless, blood glucose levels only reflect the extent of diabetes control within a short period and are prone to influences by diet, exercise, illness, and drugs, which frequently cause erroneous readings. Glycosylated proteins, such as glycosylated haemoglobin (HbA1c), glycosylated albumin, and fructosamine, are better indicators of the long-term glycaemic control of a patient, and HbA1c is a particularly crucial indicator. Haemoglobin is a vital type of protein in red blood cells; its primary function is transporting oxygen to all parts of the body for use by tissue cells. Sugar can attach to haemoglobin, generating HbA1c. When glucose is attached to the N-terminal end of the haemoglobin β chain, the resulting product is HbA1c, which is the most important type of glycosylated protein. Higher glucose concentrations in the blood produce greater numbers of HbA1c. Once attached to haemoglobin, glucose remains attached to the host until the red blood cell dies. Because red blood cells have an average lifespan of 120 days, testing the HbA1c percentage in blood can accurately reflect glycaemic control over the past 2 to 3 months. However, because generally only hospitals are equipped to detect HbA1c, patients are required to visit the hospital for regular examinations to test their HbA1c levels.Patients with diabetes have higher glucose concentrations in their blood system and insufficient blood oxygen, which results in poor blood circulation. Poor blood circulation raises the likelihood of peripheral nerves experiencing pathological changes, such as peripheral arteriosclerosis, and consequent foot ulcerations. Foot ulcers are caused by three major factors: lower extremity vascular disease, neuropathy, and localized infections. The pathogenesis of diabetic patients with lower extremity gangrene is primarily caused by poor long-term glycaemic control, which leads to arteriosclerosis and thickening in the basal layers of blood vessel walls, and results in poor oxygen permeability. An increase in the clotting ability of the blood results in the formation of thrombus, stenosis, vascular occlusions, and lower limb ischemia. Therefore, monitoring blood glucose, measuring peripheral blood oxygen, and strict attention to foot care during the early stages of diabetes effectively reduces the risk of amputation. Patient blood oxygen saturation (SpO2) levels serve as an early warning of foot ulcerations in patients with diabetes.In order to detect blood SpO2 in patient extremities with imager, the absorption coefficients of the four elements in blood must be obtained first. The reflected images of skin tissue and the absorption spectrum of haemoglobin in the blood provide information that enables the calculation of SpO2. Meglinski et al.[1] simulated a skin model to calculate the SpO2 of blood by using the differing reflectivity of human skin in the visible and near-infrared spectral region. In their simulation, the skin was composed of water, HbO2, Hb, and haemoglobin-water free tissues; each of these has different absorption rates and scattered effects when irradiated by varying types of light, as shown in Fig. 1. These components show the reflectance spectra of skin; the measurements in vivo and those simulated by the Monte Carlo technique are similar in the visible region, but their similarities decline in the near-infrared region because of the error parameters of this model. However, the results in the visible region are beneficial and helpful for calculating SpO2 in skin model simulation. 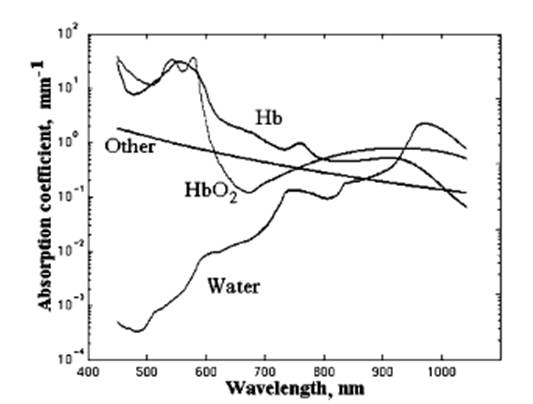 | Figure 1. The absorption coefficients of the four elements in blood[1] |
Pulse oximetry has been used to measure the SpO2 in the body in numerous studies[2-3]; the measurement position is the cutaneous vascular beds of peripheral regions, such as fingers or toes. A normal value of SpO2 is within the range of 95% to 98%. When the SpO2 is lower than 90%, blood pressure declines, and life is endangered. Because of the differing optical transmittance and absorption of HbO2 and Hb at wavelengths between 660 and 940 nm, oxyhemoglobin saturation can be evaluated when two light beams travel through a peripheral region and are received by pulse oximetry[4] on the other side. However, pulse oximetry only provides the SpO2 information at one point and the detected value can be affected by different factors, such as insufficient blood, light exposure, skin colour variation, and irregular pulsation. Zijlstra et al.[5] determined the relative absorptivity of human adult and foetal haemoglobin in blood, including HbO2, Hb, carboxyhemoglobin (COHb), and methemoglobin (MetHb), in the visible and near-infrared spectra regions by using a spectrophotometer. Their results showed that the absorptivity of HbO2 in adults and foetuses are clearly different at the visible and near-infrared spectra; however, the values at other spectra are similar. The absorptivity values of HbO2 and Hb were used as reference in this study. Shimada et al.[6] proposed a regression analysis based on the modified Beer-Lambert law[7], and assessed the Monte Carlo simulations to measure the melanin and blood concentration in human skin. They found that the absorption of chromophores increased at greater concentrations. Moreover, a strong absorption of blood and a strong scattering of the dermal phantom were apparent at shorter wavelengths. Therefore, the parameter of the path lengths of chromophores and blood were vital to accurately measure the concentrations. Huang et al.[8] presented an image analysis method to determine human health indices, such as skin tissue ageing, skin lesions, or blood SpO2, by using irradiation with LED sources at difference wavelengths (blue, green, red, or NIR). Their results showed that the surface roughness of skin is more sensitive to shorter wavelength light sources, and oxyhemoglobin has a higher absorptivity at green and NIR light. In addition, the absorption coefficient value of Hb and HbO2 is identical at a wavelength of 590 and 805 nm; this is called the isosbestic point[9] and can be used as a reference point for correcting haemoglobin concentrations. The two wavelengths of the incident lights to obtain SpO2 images must be opposite the isosbestic point (805 nm).Based on the literature, this study constructed a swift, precise cutaneous blood SpO2 image measurement system to monitor the peripheral blood SpO2 level of patients with diabetes. The system structure is shown in Fig. 2. A light control module was used to control the intensity of irradiation from light-emitting diode (LED) lamps of varying wavelengths (660/890 nm and 660/940 nm). By using the reflective characteristics of skin tissue, the peripheral cutaneous blood SpO2 level of patients was obtained. This non-invasive method was employed to monitor and prevent pathological changes in the peripheral nerves of the extremities and in the blood.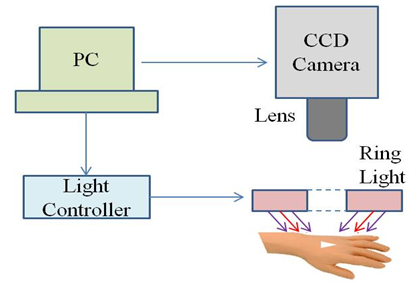 | Figure 2. Structure of the cutaneous blood oxygen measurement system |
2. Fundamental Optical Theory on Human Skin
Human skin consists of three main layers that beginning with the surface are as follows: the epidermis (approximately 100 μm thick), the dermis (approximately 1-4 mm thick), and subcutaneous fat (approximately 1-6 mm thick). When a light is used to illuminate the skin tissue, the light is diffused by the dermis, passes partly through, and is absorbed by the subcutaneous fat. In the visible spectrum, most of the incident light is reflected by the epidermal and dermal tissue; however, the light can reach the deeper layer of skin tissue when the wavelength of the incident light is increased, as shown in Fig. 5. Therefore, the intensity of the reflected light of the skin tissue can be expressed with the modified Beer-Lambert law to represent the light absorption of the haemoglobin; the formula is expressed as follows:where It is the intensity of the transmitted light, I0 is the incident light, c is the concentration of the sample, α is the absorption coefficient, and d is the optical path length. Because light will not pass through the back of a hand, the intensity of the transmitted light was considered as the intensity of the reflected light in this study.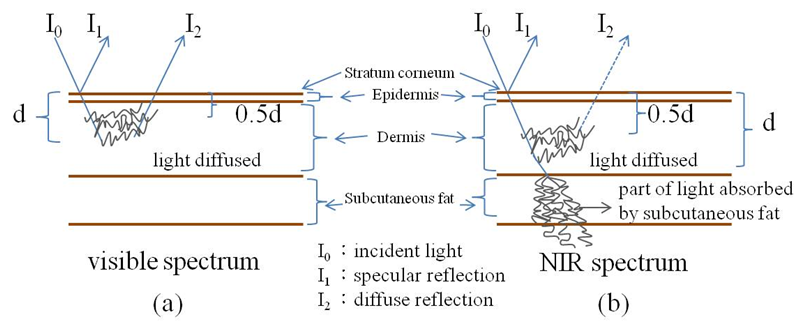 | Figure 3. The optical path of reflected light in skin tissue at (a) the visible and (b) NIR spectrum |
 | Figure 4. The relationship between light penetration depth and wavelength[11] |
The simulated composition of skin tissue by Meglinski et al.[1] was referenced; the modified optical density (OD) was defined by the intensity of the incident light as I0-I1, and the diffuse reflected light was defined at I2-I1 within the multilayer tissue, which is expressed by (1):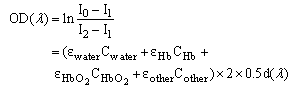 | (1) |
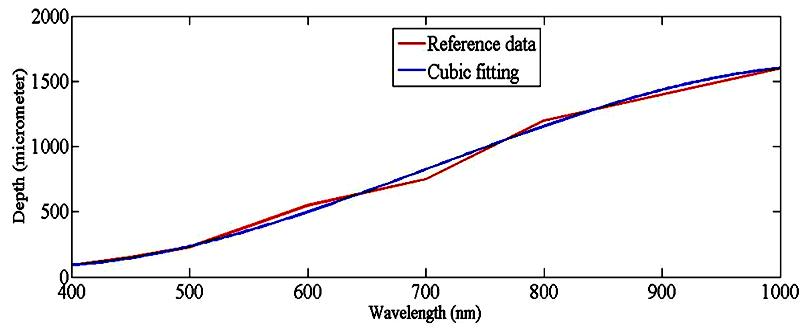
in which I0 is the incident light, I1 is the specular reflection light reflected by the stratum corneum, and I2 is the diffuse reflection light within the epidermal and dermal layers. According to the Fresnel equation[10], the intensity of the diffuse reflected light was assumed to be proportional to the intensity of the transmission light so that the OD decreased with the increasing wavelength of the incident light. The penetration depth d increased with the increasing wavelength of incident light[11] (Fig. 4); the relationship between wavelength λ and fitting depth d can be expressed as (2):  | (2) |
The blood of human skin comprises four elements: water, HbO2, Hb, and other. Based on the given absorption coefficient and OD ratio calculated by the two images at λ1 and λ2, the skin SpO2 images can be calculated by (3):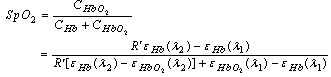 | (3) |
where R’ is the ratio of the sum absorption of Hb and HbO2 at two wavelengths of λ1 and λ2, which is expressed as (4):  | (4) |
3. Experimental Results and Discussion
To conduct the experiment, a portable blood oxygen monitor developed by the Instrument Technology Research Center was used. To photograph the experiment, the uEye UI-2230-C/M camera (25 mm focal length, F/1.4 CCTV lens, and 130 mm working distance from skin surface) was employed. To detect the cutaneous blood SpO2 level, two groups of ring-shaped LEDs (25 mm working distance from the skin surface) of varying wavelength ranges were adopted. Fig. 5 shows the structural map of the LEDs: 660/890/W and 660/940/W.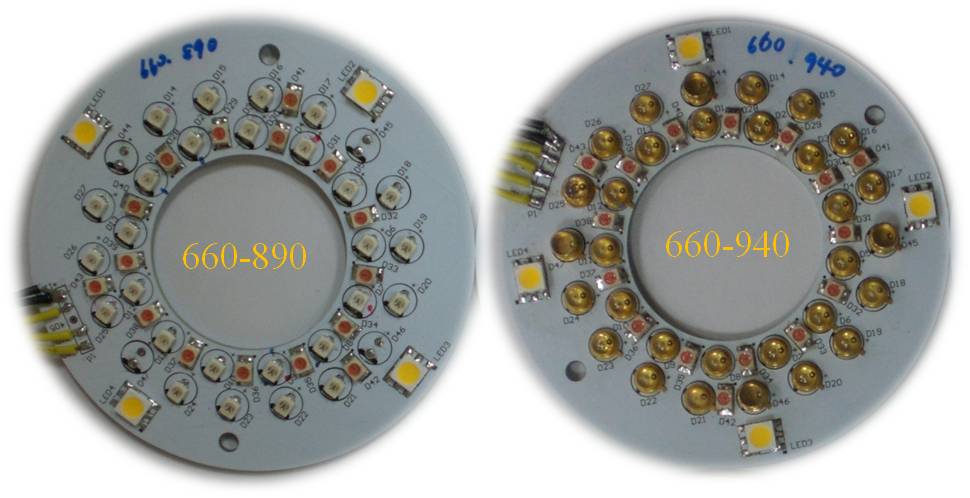 | Figure 5. Two sets of LED light modules (660/890/W and 660/940/W) |
For this experiment, images of skin tissue on the back of the hand and wrist were captured, and these are shown in Fig. 6. Triangular reference films were used to calibrate the experimental range, and images of the reference films were captured using the experimental camera combined with an integrating sphere (Perkin Elmer-Φ150 mm) to obtain the reflection intensity of the incident light on the reference films. The relationship between the light wavelengths and their reflectivity is presented in Fig. 7. The reflectivity of the light rays with a wavelength of 660, 890, and 940 nm were 73.02%, 66.65%, and 65.29%, respectively.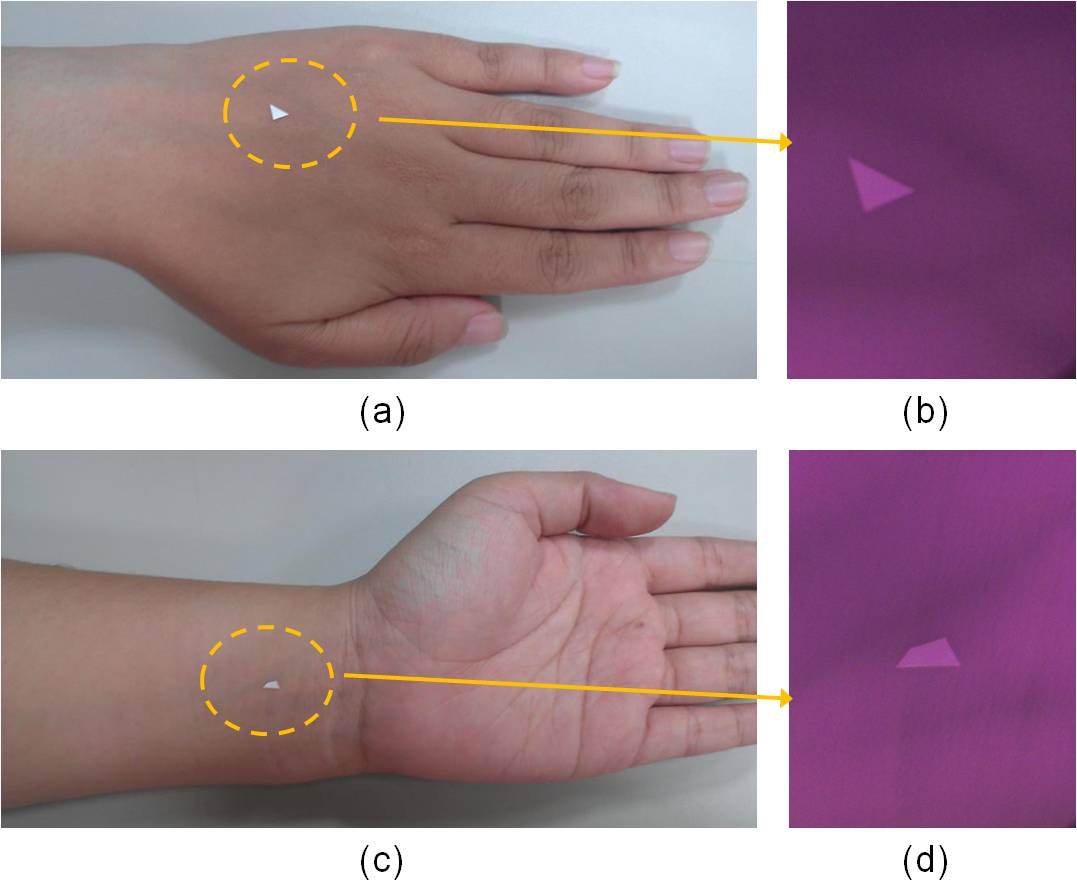 | Figure 6. The target area marked by triangle films was irradiated by NIR LED light at 890 nm |
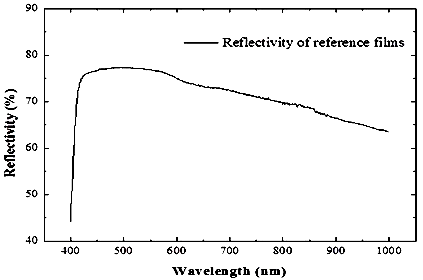 | Figure 7. The reflectivity of the reference films was measured by using the integrating sphere system |
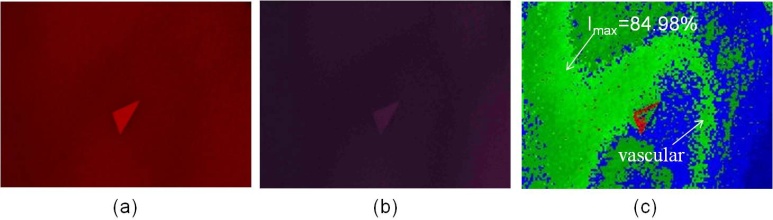
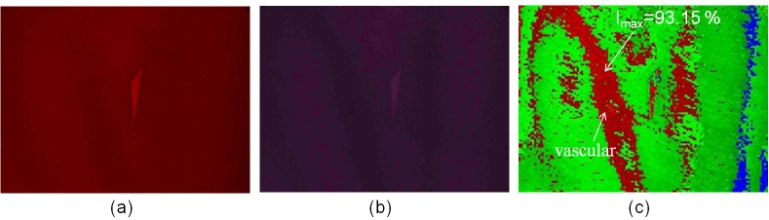
Fig. 1 shows a significant change for Hb and HbO2 at 660 nm and 940 nm. The absorption rate of Hb decreased as the wavelength increased; conversely, the absorption rate of HbO2 increased as wavelength increased, and the incident light diffused in the epidermis and dermis (Fig. 3(b)). Therefore, when the 660/940/W LED lights were used to irradiate skin tissues, the 940 nm incident light penetrated deeper into the dermis and only a portion of the incident light was reflected by the dermis and epidermis, thereby resulting in substantially lower image intensity values. Consequently, image processing technology was used to enhance the image intensity values. Figs. 7(c) and 8(c) show the composite images of the back of the hand and wrist using light sources with wavelengths of 660 nm and 920 nm, respectively; the blood SpO2 image intensity values ranged from 53.67% to 56.13% and 61.71% to 65.95%, respectively.The average values were approximately 54.95% and 64.01 %, respectively; which are slightly lower than the normal value of SpO2. In Figs. 10(c) and 11(c), the blue regions indicate that the SpO2 of the skin image is lower than 80%, and the maximum SpO2 of the back of the hand and wrist is 61.52% and 69.14%, respectively.Another set of images were then captured using a different group of LED lights (660/890/W); these images obtained a blood SpO2 level for the back of the hand and the wrist ranging from 78.09% to 81.81% and 84.69% to 88.79%, respectively (Figs. 10(c) and 11). Light sources of 660 and 890 nm were used to construct the SpO2 images of human skin because the light can completely interact with haemoglobin but does not absorbed as much as the light at 940 nm.Because arterial blood and venous blood intersects in the wrist, the SpO2 of the wrist is slightly higher than that of the back of the hand. In the SpO2 images of the wrist and the back of the hand shown in Figs. 10(c) and 11(c), the green region shows that SpO2 ranges from 80% to 89%, and the red region indicates that the value ranges from 89% to 100 %, respectively.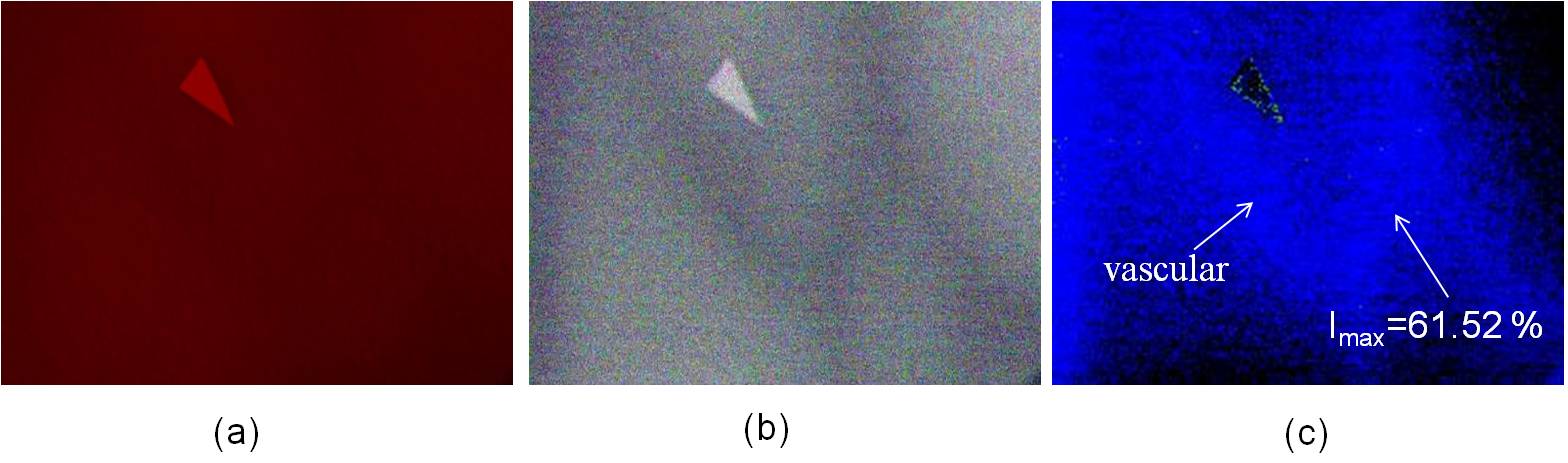 | Figure 8. The SpO2 image constructed from the skin images of the back of the hand irradiated by (a) 660 nm and (b) 940 nm LED lights |
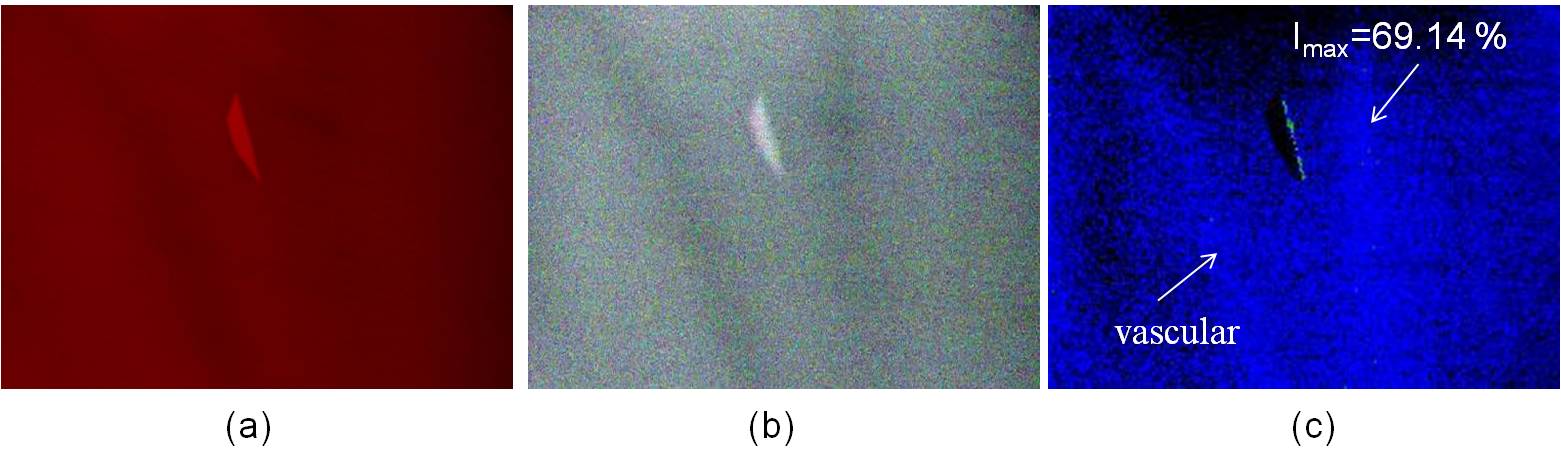 | Figure 9. The SpO2 image constructed from the skin images of the wrist irradiated by (a) 660 nm and (b) 940 nm LED lights |
 | Figure 10. The SpO2 image constructed from the skin images of the back of the hand at wavelengths 660/890 |
 | Figure 11. The SpO2 image constructed from the skin images of the wrist irradiated by (a) 660 nm and (b) 890 nm LED lights |
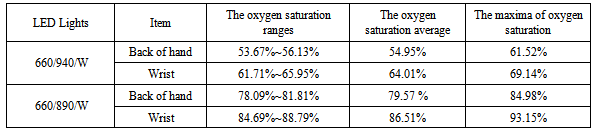
The experimental results are presented in Table 1. The experimental results show that the SpO2 distribution obtained from the skin oxygen image is similar to the result of the multi-spectral imaging method[10], and a clear location of vascular was obtained from the images concurrently. Therefore, light sources of 660 and 890 nm are more suitable for constructed SpO2 images than those of 660 and 940 nm. However, the calculated SpO2 was reduced by two factors: (1) the low intensity of the original reflected images, and (2) optical noise that was generated by processing the image.Table 1. Comparison of the blood SpO2 levels using varying LED light sources
 |
| |
|
4. Conclusions
Numerous complications arise from diabetes, including pathological changes in the coronary arteries of the heart, blood vessels in the brain, peripheral blood vessels, the retina, kidneys, and the nerves. Although diabetes is a key risk factor for cardiovascular disease, and 30% to 50% of diabetic patients die from coronary artery disease, the leading cause of hospitalization for diabetic patients is foot ulcerations, which might lead to serious consequences, such as becoming handicapped. This study used non-invasive blood SpO2 images to monitor the blood oxygen concentration in the feet of diabetic patients; this provides a painless method for detecting and preventing foot ulcerations.This study shows that diffuse reflected skin images can be applied to obtain SpO2 images of skin tissue. The SpO2 of skin tissue constructed from the reflected images at 660 and 890 nm is similar to the value measured by using a multi-spectral imaging method, and the clear location of vascular can be obtained from the SpO2 image. However, the value of SpO2 is slightly lower than the normal value when skin tissue is irradiated by 660 and 940 nm LED light because of the higher penetration depth and greater absorption occurring at 940 nm light. In addition, the clear position of the vascular is indicated by the SpO2 images constructed by skin images irradiated by 660 nm and 890 nm LED light. These results indicate that crucial information can be obtained regarding the SpO2 of skin tissue, and can be used in clinical diagnoses in the future.
ACKNOWLEDGMENTS
This work was supported in part by the National Science Council, TAIWAN, under Grants NSC 101 – 2622 – E – 492 – 004–CC3.
References
| [1] | I. V. Meglinski, and S. J. Matcher, “Quantitative assessment of skin layers absorption and skin reflectance spectra simulation in the visible and near-infrared spectral regions”, Physiological Measurement, Vol. 23, 2002, pp. 741-753. |
| [2] | G. A. Dildy, P. P. vanden Berq, M. Katz, S. L. Clark, H. W. Jonqsma, J. G. Nijhuis, and C. A. Loucks, “Intrapartum fetal pulse oximetry: fetal oxygen saturation trends during labor and relation to delivery outcome”, American Journal of Objectrics and gynecology, Vol. 171, 1994, pp. 679-684. |
| [3] | D. Álvarez, R. Hornero, D. Abásolo, F. del Campo, C. Zamarrón and M. López, “Nonlinear measure of synchrony between blood oxygen saturation and heart rate from nocturnal pulse oximetry in obstructive sleep apnoea syndrome”, Physiological Measurement, Vol. 30, 2009, pp. 967-982. |
| [4] | S. L. Schutz, ”Oxygen Saturation Montioring by Pulse Oximetry”, AACN Procedure manual for Critical Care, Fourth Edition, 2001. |
| [5] | W. G. Zijlstra, A. Buursma, and W. P. Meeuwsen-van der Roest, “Absorption Spectra of Human Fetal and Adult Oxyhemoglobin, De- Oxyhemoglobin, Carboxyhemoglobin, and Methemoglobin”, Clinical Chemistry, Vol. 37, 1991, pp. 1633-1638. |
| [6] | M. Shimada, Y. Yamada, M. Itoh and T. Yatagai, “Melanin and blood concentration in a human skin model studied by multiple regression analysis: assessment by Monte Carlo simulation”, Physics in Medicine and Biology, Vol. 46, 2001, pp. 2397-2406. |
| [7] | K. Fuwa and B. L. Valle, “The Physical Basis of Analytical Atomic Absorption Spectrometry”, Analytical Chemistry, Vol. 35, no. 8, 1963, pp. 942-946. |
| [8] | K. C. Huang, C. L. Chang, H. C. Chang and C. H. Chang, “The Image Analysis of Skin Tissue Irradiated with Difference Wavelength of LED Sources”, IEEE International Instrumentation and Measurement Technology Conference, Graz, May 13-16, 2012. |
| [9] | T. Aoyagi, “Pulse Oximetry: its invention, theory and future”, Journal of Anesthesia, Vol. 17, 2007, pp. 259-266. |
| [10] | N. Tsumura, M. Kawabuchi, Hideaki, and Y. Miyake, “mapping pigmentation in human skin by multi-visible-spectral imaging by inverse optical scattering technique”, IS&T/SID’s 8th Color Imaging Conference, Color Science, Systems and Applied, USA, Nov. 2000, pp.81-84. |
 Abstract
 Reference
 Full-Text PDF
 Full-text HTML