-
Paper Information
- Next Paper
- Previous Paper
- Paper Submission
-
Journal Information
- About This Journal
- Editorial Board
- Current Issue
- Archive
- Author Guidelines
- Contact Us
International Journal of Modern Botany
p-ISSN: 2166-5206 e-ISSN: 2166-5214
2013; 3(2A): 26-33
doi:10.5923/s.ijmb.201310.04
Genetic Architecture of Tolerance to Foliar Damage in a Salix Hybrid System
 Abstract
 Reference
 Full-Text PDF
 Full-text HTML
Cris G. Hochwender 1, Mary Ellen Czesak 2, Crystal Harmon 1, Brent Mock 1
1Department of Biology, University of Evansville, 1800 Lincoln Ave, Evansville, IN 47722, USA
2Department of Biology, Vassar College, 124 Raymond Ave, Poughkeepsie, NY 12604, USA
Correspondence to: Cris G. Hochwender , Department of Biology, University of Evansville, 1800 Lincoln Ave, Evansville, IN 47722, USA.
| Email: |  |
Copyright © 2012 Scientific & Academic Publishing. All Rights Reserved.
The release of apical dominance following the browsing of stems can alter plant architecture and provide tolerance to herbivore damage. Meristem changes are not associated with foliar damage, so tolerance responses to foliar feeding may not be robustly expressed. In this study, tolerance to foliar damage was characterized for six genetic classes of willows in an interspecific hybrid system (pure Salix eriocephala plants, pure S. sericea plants, F1 hybrids, F2 hybrids, backcrosses to S. sericea, and backcrosses to S. eriocephala). This characterization allowed the genetic architecture of tolerance to be explored. Plagiodera versicolora, a small leaf beetle, was used to inflict foliar damage. Cuttings of genetically identical plants were matched to create a metric of biomass tolerance (defined here as the ratio of biomass for a damaged plant relative to an undamaged plant). Initial size differences between cuttings influenced the relative performance of damaged/undamaged pairs, so a ratio of the cuttings (damaged/undamaged) was calculated using initial wet weights. The ratio of cutting weight explained meaningful variance in biomass tolerance (F1,68 = 71.4; P = 0.0001; r2 = 0.51). Residual variance in biomass tolerance (the variance remaining in biomass tolerance following removal of variance explained by the ratio of cutting weight) was used to reduce the effect of differences in initial plant size for damaged versus undamaged plants. Residual variance in biomass tolerance differed significantly among genetic classes (F5,64 = 2.7; P = 0.03). Using a Tukey post-hoc test, F1 hybrids had significantly greater tolerance to foliar damage than backcrosses to S. sericea. Using line cross analysis, the model expressing the genetic architecture for tolerance in this hybrid system included additive genetic effects (a) + dominance–dominance epistasis (dd). For this willow system, tolerance to damage appears to be a fundamental response, whether damage is associated with browsing or foliar damage. Given the epistatic interactions observed in the current study, coupled together with the potential complexity of growth/storage traits associated with the mechanisms of tolerance, the trajectory for the evolution of tolerance challenges easy interpretations.
Keywords: Compensation, Compensatory Response, Gene Interaction, Herbivory, Heterosis, Hybridization, Speciation
Cite this paper: Cris G. Hochwender , Mary Ellen Czesak , Crystal Harmon , Brent Mock , Genetic Architecture of Tolerance to Foliar Damage in a Salix Hybrid System, International Journal of Modern Botany, Vol. 3 No. 2A, 2013, pp. 26-33. doi: 10.5923/s.ijmb.201310.04.
Article Outline
1. Introduction
- Genetic variation in plant tolerance to damage often exists, suggesting that evolution of tolerance is a possible response to herbivores.[1,2,3,4,5] Although the majority of tolerance research has centered on herbaceous plants (see citations above), the greater apparency of woody perennials[6] should favor the evolution of increased plant tolerance to damage for woody species.[7] Moreover, woody plants accumulate and store resources over multiple years, favoring the use of stored resources to compensate for damage. Studies have documented compensatory responses across a range of woody plant species.[8,9,10] However, type of herbivory may influence whether woody plants show complete compensation, overcompensation, or undercompensation for damage.[11] For example, compensatory patterns may differ depending on whether damage is due to browsing of stems or restricted to foliar damage. Commonly, overcompensation to damage has been associated with a release of meristems after browsing. [2,12,13,14,15] Damage to apical meristems changes plant architecture by releasing apical dominance and increasing growth of axillary meristems, thereby increasing branching.[16] In contrast to apical browsing, foliar damage is not associated with the same change in meristem growth, so the compensatory response in such cases may not be as great for this damage type. Species-specific effects for tolerance have also been documented for woody;[17,18] however, information is lacking on the genetic architecture of tolerance. Populations or species can differ from each other through additive, dominance, or epistatic genetic effects on a trait, and the relative contribution of these genetic differences (i.e., genetic architecture) can be estimated by comparing means among genetic classes (i.e., pure species and hybrids[19]). Additive genetic effects alone can explain a significant proportion of the evolutionary trajectory of a trait,[20] yet non-additive genetic effects are also commonly found to explain species/populational differences. In such cases, non-additive genetic effects must be considered in models of population/species differentiation.[21,22,23,24,25] Non-additivity can arise if selection acts to favor the co-evolution of groups of alleles at different loci, either independently of the environment (co-adapted gene complexes[26]) or in certain environments (local adaptation [27]). Such gene complexes are evident when hybridization leads to the disruption of these gene complexes (i.e., outbreeding depression). Parental genomes can interact unfavorably in hybrids, either through unfavorable epistatic interactions among loci or underdominance,[28] resulting in hybrid breakdown and selection against hybrids (e.g., F2 hybrids of Mimulus guttatus and M. nasutus[29]). Alternatively, parental genomes can interact favorably in hybrids, perhaps through favorable epistatic interactions,[30] overdominance of alleles, or masking of deleterious alleles, resulting in hybrid vigor and selection for hybrids (e.g., F2 hybrids across planting location for differing populations of Chamaecrista fasciculata[21]). Salix sericea x S. eriocephala are eastern North American willow species that commonly form fertile hybrids. In this hybrid system, mammalian browsers (including white-tailed deer, rabbits, and meadow voles) can aggressively browse plants, removing up to 90% of shoot length.[31] Tolerance to browsing is high; F2 hybrid plants express overcompensation with regard to biomass tolerance and complete compensation with regard to reproductive tolerance.[10] While tolerance to browsing can be important in this system, defoliation can also occur; beetle species can greatly impact plants, sometimes completely defoliating them (CGH, pers. obs.). Tolerance responses to folivory should be examined in this system to determine whether expression of plant tolerance can be generalized across browsing and foliar damage. In this current study, six genetic classes (two pure species, F1 hybrids, F2 hybrids, and certain backcross hybrids) were examined to characterize tolerance to foliar damage. The degree to which beetle damage reduced biomass in these genetic classes was quantified to determine whether genetic classes differed in plant tolerance to damage. In addition, the genetic architecture of tolerance was examined to clarify how tolerance differs genetically between the two pure species.
2. Methods
2.1. Study Site and Species
- Salix sericea is a 0.5-4 m high shrub with lanceolate leaves and sericeous hairs on the lower leaf surface. This species commonly inhabit swamps from Canada through Northeastern USA and along the Appalachian range to Georgia. S. eriocephala reaches heights of 6 m and has narrowly oblong leaves. S. eriocephala occurs from Canada through Virginia, and as far west as Missouri. S. sericea and S. eriocephala commonly co-occur in swamps and along streams in central New York. S. sericea and S. eriocephala are known to hybridize naturally.[32]Plagiodera versicolora (Chrysomelidae) is a small leaf beetle with a metallic blue-black coloration.[33] Although these European beetles are not native to the US, they have occurred in North America for more than 100 years. P. versicolora inhabits much of New England and the Midwest. This multivoltine beetle feeds on Salix species (as well as Populus species) throughout all stages of its 23-25 day life cycle.This study was conducted in 2004 and 2005 at the Sosnowski site; this site is a low-lying swamp about 3 km from Milford, Otsego County, NY, where previous studies on field and common garden plants have been conducted. [34,35,36,37] S. sericea and S. eriocephala, and their interspecific hybrids occur naturally at the site, along with two other willow species, S. discolor and S. bebbiana.
2.2. Experimental Design
- Genetically pure plants (determined with RAPD markers[38]) were crossed in April of 1998 to create full-sib families of S. eriocephala (designated as PE) and S. sericea (designated as PS). Full-sib families of F1 hybrids were created by crossing a female S. sericea plant with a male S. eriocephala plant. The reciprocal cross does not produce viable seeds due to a pre-mating incompatibility trait in female S. eriocephala plants.[39] Full-sib families of F2 hybrids were created by crossing unrelated F1 hybrids. Backcross full-sib hybrid families were created by crossing F1 hybrid females with either male S. sericea plants (designated as BCS) or male S. eriocephala plants (designated as BCE). Males of pure species were used to create backcrosses because females of one pure species have the pre-mating incompatibility trait. In March/April of 2004, multiple cuttings were taken from individual plants to create genetically identical clones, weighed to the nearest 10 mg, and grown in the Vassar College greenhouse.[10] For each of the six genetic classes, a minimum of 4 independent, full-sib families were used to avoid anomalous results associated with having only a single genotype. In June, individuals were transported to the field site, and genetically identical ramets were paired for size. Plants were paired because tolerance cannot be quantified as a property of an individual.[11] Instead, characterizing tolerance requires evaluating fitness of individuals across of range of damage levels and requires at least two plants (a damaged and an undamaged plant). Such was the case in this experiment; each pair of willows involved identical clones that included an undamaged control plant and an experimental plant that received damage. Each individual was planted in a 3.7 liter pot with a soil mixture (4:1:1 topsoil, peat, vermiculite), given 26 g of slow release fertilizer (10:10:10 NPK), and maintained in a pot for the remainder of the experiment. Plants were grown in a fenced common garden on gravel that was removed from established field willows to reduce colonization by non-experimental herbivores. Plants were randomly arranged in their pairs, and all plants were irrigated with drip hosing. To prevent herbivore damage, control plants were sprayed with Sevin®, a carbaryl insecticide. Each experimental plant was left unsprayed to allow P. versicolora to feed on its leaves. To inflict damage on experimental plants, P. versicolora eggs and larvae were incrementally added to the willows starting in early June and going through mid-July; numbers placed on plants ranged from 60 to 130 individuals, with a mean of 94 ± 2.6 (±SE). Additions of P. versicolora were made on plants where foliar damage appeared to be less than 20%; beetles were removed from plants where damage appeared to be greater than 40%. By mid-July, all insects were removed and further damage was prevented by using Sevin® applications. To assign damage estimates accurately to damaged plants, every leaf of all damaged plants was scored for leaf damage; using visual representations of differing damage levels, every leaf on each plant was scored either 0%, 5%, 10%, 20% or another 10% increment up to 100%. For each plant, percent damage was calculated as the average damage across all leaves on a plant. Plants that experienced less than 15% damage or greater than 55% were excluded from the experiment in order to provide a narrower range for the damage treatment. To prevent additional foliar damage all plants were treated with Sevin® throughout the rest of the 2004 season and until plant harvest in late July of 2005.The majority of plants produced catkins, but reproductive responses were not examined because catkin production was low (approximately 35 catkins/plant) and quite variable (0 to 108 catkins/plant). Still, differences in biomass tolerance (defined here as the ratio of biomass for a damaged plant relative to an undamaged plant) can explain meaningful variation in reproductive tolerance (the ratio of reproductive output for a damaged plant relative to an undamaged plant),[10] making biomass tolerance a useful estimate of reproductive tolerance. Leaves, stems, and roots of harvested plants were divided into separate bags, dried in an oven at 60-70°C for 48 hours, and weighed 24 hours after being removed from the oven.
2.3. Analyses
- After eliminating paired sets of plants with non-correctable errors in their data, with missing information, or that were not within the range of 15 to 55%, 13 PE pairs, 12 PS pairs, 10 F1 pairs, 13 F2 pairs, 11 BCE pairs, and 11 BCS pairs remained (70 pairs total). For each pair, biomass tolerance was defined as the proportional change in woody biomass (i.e., biomass of the stems and roots of a damaged plant divided by the biomass of the stems and roots of the undamaged plant). Other studies have calculated tolerance as the difference in performance between a damaged and undamaged plant,[4] but using proportional changes allows the study to be framed in a reaction norm/phenotypic plasticity context.[11] Moreover, choice of scale can influence results;[40] both the damage treatment and tolerance were proportional in this study. Percent damage varied across the 70 damaged plants, so percent damage was evaluated as a potential covariate of biomass tolerance. Percent damage was not predictive of biomass tolerance (F1,68 = 1.4; P = 0.24), so this variable was not used. Initial size differences between cuttings may also have influenced the relative performance of a damaged and undamaged pair, so a ratio of the cuttings (damaged/ undamaged) was evaluated using initial wet weights. The ratio of cutting weight explained meaningful variance in biomass tolerance (F1,68 = 71.4; P = 0.0001; r2 = 0.51). Therefore, residual variance in biomass tolerance (the variance remaining in biomass tolerance following removal of variance explained by the ratio of cutting weight) was used to reduce the effect of differences in initial plant size for damaged versus undamaged plants. Because relative root:shoot ratio (the root:shoot ratio of the damaged plant divided by that of the undamaged plant) was one trait found to predict tolerance in this willow system,[10] relative root:shoot ratio was calculated for plant pairs in this system. For genetically identical pairs where relative root:shoot ratio < 1, the damaged plant invests relatively more of its resources into shoot tissue and away from root tissue than the undamaged plant. This reallocation response was predicted to be associated with greater tolerance to damage than a response where the relative root:shoot ratio > 1 (e.g., where a damaged plant shifts fewer resources from roots to shoots compared to an undamaged plant). The ratio of cutting weight did not significantly influence relative root:shoot ratio (F1,68 = 0.14; P = 0.71), so raw data were used in the analyses for relative root:shoot ratio.Instead of analyzing biomass tolerance directly, residual variance in biomass tolerance was examined using ANOVA to determine differences in biomass tolerance among the six genetic classes because the initial size of cuttings influenced the final biomass of plants.[41] ANOVA was also performed to evaluate differences among the six genetic classes for relative root:shoot ratio. Regression analysis was performed to evaluate whether relative root:shoot ratio influenced biomass tolerance. Tukey multiple comparison tests were used in all appropriate analyses.Genetic architecture of tolerance—Line cross analyses were used to evaluate the additive and non-additive genetic differences in residual variance in biomass tolerance between S. eriocephala and S. sericea (using least square means[19]). S. eriocephala and S. sericea are assumed to be completely homozygous for alleles that control tolerance. These analyses test the extent to which additive, dominance, and epistatic interactions explain the deviation of mean tolerance of these species from a theoretical mean of a population with random segregation and assorting of all alleles (F∞ population). We tested for significance of five genetic composite effects [additive (a), dominance (d), additive-x-additive epistasis (aa), additive-x-dominance epistasis (ad), dominance-x-dominance epistasis (dd)] on residual variance in biomass tolerance. An additive composite effect (a) reveals a net difference between the two species in the additive effects of their genes. The dominance composite effect (d) reveals whether genes in one species are dominant on average over genes in the other species. Epistatic composite effects (aa, ad, dd) reveal net epistatic interactions between genes from the two species. There were 32 possible linear models for estimation of five genetic composite effects of the following form:
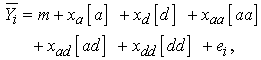 | (1) |
 is the mean of the ith genetic class (species or hybrid), m is the overall mean, [a], [d], [aa], [ad], and [dd] are the various genetic composite effects, xa, xd, xaa, xad, and xdd are the regression coefficients, and
  is the residual error. The regression coefficients are based on the expected mean of F∞ offspring as the intercept (versus F2).[19,42] This allows for the mean in linear models to represent the mean after numerous generations of inbreeding. Composite effects were estimated using a S-Plus® program[43] that used a weighted least-squares model:[19]
 | (2) |
 | (3) |
 | (4) |
 ) were used to test goodness of fit of linear models:
 | (5) |
3. Results
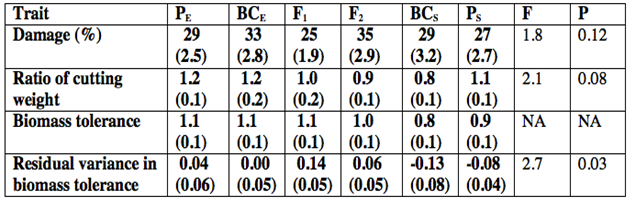
- For plants in the damage treatment, percent damage was constrained between 15-51%, with a mean of 30%. Damage did not differ significantly among genetic classes (F5,64 = 1.8; P = 0.12) (Table 1). Similarly, the ratio of cutting weight did not differ significantly among genetic classes (F5,64 = 2.1; P = 0.08) (Table 1).
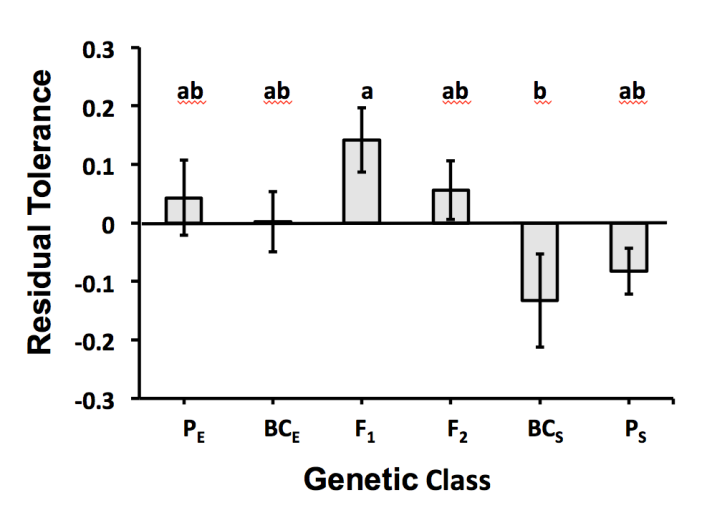 | Figure 1. Bar graph representing mean residual variance in biomass tolerance (±SE) for six genetic classes of willow plants. Salix eriocephala plants and their backcrosses are designated as PE and BCE; F1 hybrids and F2 hybrid plants are designated as F1 and F2; S. sericea plants and their backcrosses are designated as PS and BCS. Different lower case letters designate significant differences among genetic classes |
4. Discussion
- Overall, plants in this study showed full compensation to foliar damage, suggesting that tolerance traits provided the ability to compensate for damage, but not to overcompensate for damage. Biomass tolerance to foliar damage ranged greatly for willow plants, with several genetic classes presenting patterns of overcompensation (PE, F1 hybrids, and BCE plants all showed biomass tolerance measures of 1.1), while F2 hybrids showed complete compensation, and other genetic classes displayed patterns of undercompensation (PS had a measure of 0.9, and BCE plants had a measure of 0.8). In a prior study, Hochwender et al. also examined willow tolerance;[10] however, that study differed in three important ways: (1) only F2 hybrids were examined for tolerance in the earlier study; (2) the previous study examined tolerance to browsing damage, while this current study examined tolerance to foliar damage, and (3) the former study used experimental plants that grew in the ground for two full years, while the present study grew plants in pots for just 1.5 years. The results from this current study are similar to those from the previous study in that both showed a high degree of tolerance (complete compensation and overcompensation). Nevertheless, in the earlier study, F2 hybrids had a greater mean tolerance—1.2 ± 0.05 (± SE)—than the F2 hybrids here. While the differences in tolerance may be due to damage type, browsing versus foliar damage, the differences in the factors mentioned above may also have played an important role. The expression of tolerance can be influenced by environmental factors that limit plant growth,[47] so a response of full compensation instead of overcompensation is not surprising for this current study. Overall, results suggest that plant tolerance to damage is a fundamental response to herbivore damage in this willow system, whether herbivore damage is associated with browsing or foliar damage. This outcome is also notable because it suggests that compensatory responses include traits other than those associated with meristem release following browsing. Changes in relative root:shoot ratio did not provide a mechanism by which biomass tolerance was expressed. This finding differs from the earlier study.[10] In that study, relative root:shoot ratio did explain significant variation in tolerance for F2 hybrids; plants responded by shifting more resources to shoot growth following damage compared to undamaged plants. Assuming that the differences between the two experiments were caused by damage type, our findings suggest that allocation responses are insensitive to foliar damage but sensitive to browsing damage. If true, the detection of relative root:shoot ratio as a mechanism in the browsing experiment (and the stronger tolerance response observed for browsing damage) may have been because browsing causes changes in apical meristems and plant architecture, but foliar damage does not appear to cause these changes. While relative root:shoot ratio did not provide a mechanism of tolerance for foliar damage, an alternative reason for this lack of response could be environmental conditions. Specifically, pot constraints in this current experiment may have limited the degree to which plants were initially able to invest in roots, so changes in allocation patterns from those initial root:shoot ratios were limited. Still, our study may have been constrained by sample size; in this study, only 70 pairs of plants were used (and those pairs included six genetic classes) whereas the previous study involved nearly twice as many pairs (and all pairs were from the same genetic class).Hybridization has the potential to alter gene combinations with beneficial or detrimental effects on the phenotype. The hybrid fitness that results depends on a balance between the loss of favorable and unfavorable interactions within parental genomes.[48] Differences in tolerance to foliar damage were observed among the six genetic classes, but only F1 hybrids and BCS plants differed significantly (for residual variance in biomass tolerance). Even so, this outcome suggests that genetic variance in ability to tolerate foliar damage exists in this hybrid system. Moreover, line cross analyses supported the argument that non-additive genetic effects contributed to interspecific differences between means. For residual variance in biomass tolerance, F1 hybrids had a significantly higher value than expected from a purely additive model of inheritance (0.14 ± 0.05 versus the predicted value of -0.02; one sample t-test using -0.05 as μ: t9 = 2.9; P = 0.02). This outcome suggests favorable gene interactions—overdominance or masking of deleterious alleles. Indeed, non-additive genetic effects (dominance x dominance) contributed to interspecific differences between means, suggesting heterosis for tolerance. In contrast, BCS had the lowest mean residual variance in biomass tolerance of all six genetic classes; although this mean was not significantly different from the means of pure species, this result is noteworthy. In recombinant hybrids (like BCS), epistatic interactions existing in pure species can become disrupted upon hybridization. If this disruption causes lower tolerance in recombinant hybrids than in the pure species, coadapted gene complexes may have been present in pure species. Such coadpated gene complexes can arise through selection that favors the coevolution of alleles at different loci.[26]Two other studies that have examined this hybrid system shed light regarding the expression genetic architecture of tolerance. One study, which used line cross analysis to examine traits associated with plant growth, found that the expression of genetic architecture was contingent upon nutrient environment for root:shoot ratios (at least for female willow plants) (Czesak unpublished data). A second study found that the expression of non-additive genetic effects could alter the expression of shoot biomass and reproductive output among genetic classes.[23] In this second example, nonadditive genetic effects involving hybrid breakdown (and selection against hybrids) was expressed in most garden plots; however, in one plot, evidence supported non-additive genetic effects involving overdominance of alleles or masking of deleterious alleles, resulting in hybrid vigor. Given the potential complexity associated with the genetic architecture of growth/storage traits (i.e., potential mechanisms of tolerance), the epistatic interactions observed in the current study challenge easy interpretations regarding the trajectory for the evolution of tolerance. Models of selection often assume absent non-additivity, yet our ability to understand speciation based such models can be limited if non-additivity complicates responses to selection.[22] As the genetic composition of a population changes over time, non-additivity can change the additive effects of alleles, potentially changing which alleles are favored by selection[49] and thereby influencing the outcome of selection. Epistatic variance can also be converted to additive genetic variance, causing genetic variance - covariance matrices to change in response to selection.[50] Thus, the genetic factors responsible for past divergence of species may be difficult to resolve if non-additivity is ignored.
5. Conclusions
- Our findings suggest that plant tolerance to damage is a fundamental response to herbivore damage in this system, whether herbivore damage is associated with browsing or foliar damage. Biomass tolerance to foliar damage ranged greatly, with several genetic classes presenting patterns of overcompensation. In addition, the results from line cross analysis suggest that both favorable gene interactions and negative epistatic interactions influenced expression of tolerance. Given the epistatic interactions observed, as well as the potential complexity associated with growth/storage traits (i.e., potential mechanisms of tolerance), predicting the evolutionary trajectory for tolerance will be challenging.
ACKNOWLEDGEMENTS
- This work was supported by NSF Grant DEB 01-27369 to CGH. We thank Vassar College and Hartwick College for the use of their facilities. We thank RS Fritz, the Sosnowskis, M Membrano, and R Hunt for access to their property and facilities. We thank DH Cha, B Bosecker, R Tucker, and RS Fritz provided invaluable help and assistance with field work. We thank S Montgomery, C Hubbard, K Williams, and S Tran for providing valuable input during manuscript development. We appreciate the improvement that the reviewing process entailed.
References
| [1] | Mauricio R, Rausher MD, Burdick DS (1997) Variation in the defense strategies of plants: are resistance and tolerance mutually exclusive? Ecology 78:1301–1311. |
| [2] | Lennartsson T, Nilsson P, Tuomi J (1998) Induction of overcompensation in the field gentian, Gentianella campestris. Ecology 79:1061-1072. |
| [3] | Stowe KA (1998) Experimental evolution of resistance in Brassica rapa: correlated response of tolerance in lines selected for glucosinolate content. Evolution 52:703–712. |
| [4] | Hochwender CG, Marquis RJ, Stowe KA (2000) The potential for and constraints on the evolution of compensatory ability in Asclepias syriaca. Oecologia 122:361–370. |
| [5] | Fornoni J (2011) Ecological and evolutionary implications of plant tolerance to herbivory. Funct Ecol 25:399–407. |
| [6] | Feeny, P (1976) Plant apparency and chemical defense. Pp. 1–40 in: Wallace, JW and Mansell, RL (eds.) Recent Advances in Phytochemistry, Plenum Press, New York. |
| [7] | Hochwender CG, Marquis RJ, Stowe KA (2000) The potential for and constraints on the evolution of compensatory ability in Asclepias syriaca. Oecologia 122:361-370. |
| [8] | Stevens MT, Waller DM, Lindroth RL (2007) Resistance and tolerance in Populus tremuloides: genetic variation, costs, and environmental dependency. Evol Ecol 21:829-847. |
| [9] | Hódar JA, Zamora R, Castro, J, Gómez JM, Garcia D (2008) Biomass allocation and growth responses of Scots pine saplings to simulated herbivory depend on plant age and light availability. Plant Ecol 197:229-238. |
| [10] | Hochwender, CG, DH Cha, RS Fritz, ME Czesak, RR Smith, AD Kaufman, B Warren, A Neuman (2012) Protein storage and root:shoot reallocation strategies provide tolerance to damage in a hybrid willow system. Oecologia 169:49-60. |
| [11] | Stowe KA, Marquis RJ, Hochwender CG, Simms EL (2000) The evolutionary ecology of tolerance to consumer damage. Annu Rev Ecol Syst 31:565-595. |
| [12] | Hendrix SD (1979) Compensatory reproduction in a biennial herb following insect defloration. Oecologia 42:107-118. |
| [13] | Paige KN, Whitham TG (1987) Overcompensation in response to mammalian herbivory: the advantage of being eaten. Am Nat 129:407-416. |
| [14] | Pilson D, Decker KL (2002) Compensation for herbivory in wild sunflower: response to simulated damage by the head-clipping weevil. Ecology 83:3097-3107. |
| [15] | Weinig C, Stinchcombe JR, Schmitt J (2003) Evolutionary genetics of resistance and tolerance to natural herbivory in Arabadopsis thaliana. Evolution 57:1270-1280. |
| [16] | Marquis RJ (1996) Plant architecture, sectoriality and plant tolerance to herbivores. Vegetatio 127:85-97. |
| [17] | Myers JA, Kitajima K (2007) Carbohydrate storage enhances seedling shade and stress tolerance in a neotropical forest. J Ecol 95:383-395. |
| [18] | Vandenberghe C, Freléchoux F, Buttler A (2008) The influence of competition from herbaceous vegetation and shade on simulated browsing tolerance of coniferous and deciduous saplings. Oikos 117:415-423. |
| [19] | Lynch, M, Walsh, B (1998). Genetics and the Analysis of Quantitative Traits, Sinauer Associates Inc., Sunderland, MA. |
| [20] | Falconer, DS, MacKay, TFC (1996) Introduction to Quantitative Genetics 4th edition Longman, New York, NY. |
| [21] | Fenster CB, Galloway LF (2000) Population differentiation in an annual legume: genetic architecture. Evolution 54: 1157-1172. |
| [22] | Wolf JB, Brodie ED III, Wade MJ (eds.) (2000) Epistasis and the evolutionary process Oxford University Press, New York, NY. |
| [23] | Fritz, RS, Hochwender, CG, Albrectsen, BR, Czesak, ME (2006). Fitness and genetic architecture of parent and hybrid willows in common gardens. Evolution 60:1215-1227. |
| [24] | Etterson, JR, Keller, SR, Galloway, LF (2007) Epistatic and cytonuclear interactions govern outbreeding depression in the autotetraploid Campanulastrum americanum. Evolution 61:2671-2683. |
| [25] | Costa e Silva, J, Potts, BM, Tilyard, P (2012) Epistasis causes outbreeding depression in eucalypt hybrids. Tree Genet Genomes 8:249-265. |
| [26] | Waser, NM (1993) Population structure, optimal outbreeding, and assortative mating in angiosperms. Pp. 173-199 in: Thornhill NW (ed.) Natural History of Inbreeding and Outbreeding, The University of Chicago Press: Chicago, Illinois. |
| [27] | Templeton, AR (1986) Coadaptation and outbreeding depression. Pp. 105-116 in: Soulé M.E. (ed.) Conservation Biology: The Science of Scarcity and Diversity, Sinauer Associates, Inc., Sunderland, MA. |
| [28] | Schierup MH, Christiansen FB (1996) Inbreeding depression and outbreeding depression in plants. Heredity 77: 461-468. |
| [29] | Fishman L, Kelly AJ, Willis, JH (2002) Minor quantitative trait loci underlie floral traits associated with mating system divergence in Mimulus. Evolution 56: 2138-2155. |
| [30] | Lynch, M (1991) The genetic interpretation of inbreeding depression and outbreeding depression. Evolution 45: 622-629. |
| [31] | Hochwender CG, Janson EM, Cha DH, Fritz RS (2005) Community structure of insect herbivores in a hybrid system: examining the effects of browsing damage and plant genetic variation. Ecol Ent 30:170-175. |
| [32] | Argus GW (1986) The genus Salix (Salicaceae) in the southeastern United States. Syst Bot Monogr 9:1-170. |
| [33] | Wade, MJ, Breden, F (1986) Life history of natural populations of the imported willow leaf beetle, Plagiodera versicolora (Coleoptera: Chrysomelidae). Annals of the Entomological Society of America 79:73-79. |
| [34] | Fritz, RS, Crabb, BA, Hochwender, CG (2000) Preference and performance of the gall-inducing sawfly: a test of the plant vigor hypothesis. Oikos 89:555-563. |
| [35] | Fritz, RS, Hochwender, CG, Lewkiewicz, DA, Bothwell, S, Orians, CM (2001) Seedlings herbivory by slugs in a willow hybrid system: developmental changes in damage, chemical defense, and plant performance. Oecologia 129:87-97. |
| [36] | Fritz, RS, Hochwender, CG, Brunsfeld, SJ, Roche, BM (2003) Genetic architecture of susceptibility to herbivores in hybrid willows. Journal of Evolutionary Biology 16:1115-26. |
| [37] | Hochwender, CG, Fritz, RS (2004) Plant genetic differences influence herbivore community structure: evidence from a hybrid willow system. Oecologia 138:547-557. |
| [38] | Hardig TM, Brunsfeld SJ, Fritz RS, Morgan M, Orians CM (2000) Morphological and molecular evidence for hybridization and introgression in a willow (Salix) hybrid zone. Mol Ecol 9:9-24. |
| [39] | Mosseler A (1990) Hybrid performance and species crossability relationships in willows (Salix). Can J Botany 68:2329-2338. |
| [40] | Wise MJ, Carr DE (2008) On quantifying tolerance of herbivory for comparative analyses. Evolution 62:2429-2434. |
| [41] | JMP, Version 10. 2012. SAS Institute, Cary, NC. |
| [42] | Gilchrist, AS, Partridge, L (1999) A comparison of the genetic basis of wing size divergence in three parallel body size clines of Drosophila melanogaster. Genetics 153: 1775-1787. |
| [43] | Insightful Corp. 2001. S-Plus for Windows User’s Guide, Seattle, Washington, USA. |
| [44] | Bradshaw WE, Holzapfel CM (2000) The evolution of genetic architectures and the divergence of natural populations. Pp. 245-263 in Wolf JB, Brodie III, ED, Wade MJ (eds) Epistasis and the Evolutionary Process, Oxford University Press: New York, New York. |
| [45] | Bieri, J, Kawecki, TJ (2003) Genetic architecture of differences between populations of cowpea weevil (Callosobruchus maculatus) evolved in the same environment. Evolution 57: 274-287. |
| [46] | Mather K, Jinks JL (1982) Biometrical Genetics: The Study of Continuous Variation, Chapman and Hall: London, England. |
| [47] | Wise MJ, Abrahamson WG (2008) Applying the limiting resource model to plant tolerance of apical meristem damage. Am Nat 172:635-647. |
| [48] | Arnold ML (1997). Natural Hybridization and Evolution, Oxford University Press: New York, New York, USA. |
| [49] | Barton NH, Keightley PD (2002) Understanding quantitative genetic variation. Nat Rev Genet 3: 11-21. |
| [50] | Agrawal AF, Brodie III ED, Rieseberg LH (2002) Possible consequences of genes of major effect: transient changes in the G-matrix. Genetica 112-113: 33-43. |