-
Paper Information
- Next Paper
- Previous Paper
- Paper Submission
-
Journal Information
- About This Journal
- Editorial Board
- Current Issue
- Archive
- Author Guidelines
- Contact Us
International Journal of Modern Botany
p-ISSN: 2166-5206 e-ISSN: 2166-5214
2013; 3(2A): 5-14
doi:10.5923/s.ijmb.201310.02
Modeling Simultaneous Selection for Resistance and Tolerance in Goldenrod (Solidago altissima) across a Range of Spittlebug Population Densities
 Abstract
 Reference
 Full-Text PDF
 Full-text HTML
Michael J. Wise 1, 2, Warren G. Abrahamson 1
1Department of Biology, Bucknell University, Lewisburg, PA 17837, USA
2Department of Biology, Roanoke College, Salem, VA 24153, USA
Correspondence to: Michael J. Wise , Department of Biology, Bucknell University, Lewisburg, PA 17837, USA.
| Email: |  |
Copyright © 2012 Scientific & Academic Publishing. All Rights Reserved.
Plant defenses against herbivory include two main strategies: resistance (to minimize the amount of damage) and tolerance (to minimize the fitness impact of that damage). Recent studies have emphasized the need to consider both strategies simultaneously for a fuller understanding of the evolutionary and ecological dynamics of plant defense against herbivores. We used a combination of a garden study, a greenhouse experiment, and mathematical modeling to investigate resistance to and tolerance of spittlebug damage in the goldenrod Solidago altissima. In contrast to traditional expectations, the genetic correlation between resistance and tolerance was highly positive. Selection gradients indicated that directional selection would act to increase tolerance at mean spittlebug densities of more than five nymphs per goldenrod ramet. Selection for resistance was relatively weak and was likely a byproduct of selection acting directly on correlated tolerance traits. We conclude that fitness costs of resistance and tolerance limit their evolution to intermediate levels in goldenrod populations, as the costs appear to outweigh the benefits during years of low spittlebug densities.
Keywords: Cost of Resistance, Cost of Tolerance, Genotypic-Selection Analysis, Herbivory, Resistance-Tolerance Correlation, Philaenus spumarius
Cite this paper: Michael J. Wise , Warren G. Abrahamson , Modeling Simultaneous Selection for Resistance and Tolerance in Goldenrod (Solidago altissima) across a Range of Spittlebug Population Densities, International Journal of Modern Botany, Vol. 3 No. 2A, 2013, pp. 5-14. doi: 10.5923/s.ijmb.201310.02.
Article Outline
1. Introduction
- In order to survive, grow, and reproduce, plants must be able to defend themselves from the depredations of countless natural enemies that seek to eat their leaves, stems, roots, flowers, fruits, or seeds or drink their sap. The success of plantsis due in no small part to the evolution of an effective defensearsenal. These defenses are usually categorized into two main strategies: resistance and tolerance[1-7]. Resistance can also be broken down into two categories: 1) avoidance (or antixenosis), which involves traits that reduce the likelihood that a plant will be found or chosen by an herbivore, and 2) antibiosis, which involves traits like trichomes and toxic chemicals that reduce the amount of tissue an herbivore consumes once it has chosen to feed on a plant. Once a plant has suffered damage, its last line of defense is tolerance. Tolerance involves traits that help a plant to regrow, reallocate resources, or otherwise compensate for herbivory in order to minimize the effects of the damage on its fitness.The resistance of a plant is defined operationally by the amount of damage the plant incurs[8]. For example, resistance to a folivore is often calculated as the complement of the proportion of the plant’s leaf area consumed[9,10]. Tolerance is operationally defined by the effect that a given amount of damage has on a plant’s fitness. For example, tolerance of a group of plants for folivory may be calculatedas the slope of a regression of seed production on the proportion of leaf area consumed [9,11].The early decades of evolutionary ecology research on plant defense were dominated by the study of resistance [12-19]. Researchers have identified an astounding array of chemical, physical, and architectural plant traits that serve a resistance function[20-24]. In contrast, the traits that contribute to tolerance may be less obvious[25-27]. Moreover, unlike resistance, tolerance cannot be measured on an individual plant. Rather, tolerance is measured as a norm of reaction of a group of plants (often a sibship or clones of one genet) across a range of damage levels [6,11,28-30]. Therefore, the field was slow to appreciate that tolerance could be studied as a heritable trait that may be every bit as important a defensive strategy as resistance [31-33]. With this appreciation, there has been a wealth of studies on tolerance over the past decade or so that has led to a much richer and more complete view of the ecological and evolutionary dynamics of plant defense against herbivory[7,11,27,34].One of the earliest and most persistent expectations is that resistance and tolerance are functionally redundant, alternativestrategies[7,31,35-38]. Because plants have a limited supply of resources, it makes intuitive sense that increased allocation toward one strategy would come at the expense of reduced allocation to the other[33,39,40]. Indeed, there is some evidence that plant species that are more resistant to damage are less tolerant of that damage, and vice versa[35,41,42]. Such a tradeoff is also expected at the individual plant level as a result of epistatic selection[9,43]. Specifically, if a plant is highly resistant, then by definition, it will not incur much damage; therefore, selection for tolerance will be weak. Similarly, if a plant is highly tolerant, then by definition, damage will have little effect on its fitness; therefore, any selection to increase resistance will be weak. Such epistatic selection is expected to lead to linkage disequilibrium between resistance and tolerance traits, which would be observable as a negative genetic correlation between resistance and tolerance within a plant population [11]. At the same time, there are reasons to expect that resistance and tolerance might be positively correlated [29,33]. For instance, a plant trait may contribute positively to both resistance and tolerance (i.e., the trait may be pleiotropic). In addition, under certain environmental conditions, selection may favor increases in both resistance and tolerance, while in other conditions, selection may favor reductions in both defenses.Although there are now a number of solid examples of both negative and positive correlations between resistance and tolerance in a diversity of plant species, general trends have been elusive[39,44]. Researchers are thus focusing on the mechanisms that lead to correlations by studying natural selection simultaneously on resistance and tolerance traits, and in particular how selection may vary across environmental gradients[5,26,38,45-51]. Selection studies in natural systems are challenging due to the need for very large sample sizes, the difficulty in adequately measuring fitness, and the potential for environmental bias in selection coefficients[52-54]. Studies that simultaneously measure selection for resistance and tolerance are especially prone to confounding influences because the expression of one trait determines the selective environment of the other. That is, if plants are highly resistant, then they will not incur much damage, making it impossible to get a good estimate of tolerance[9,55]. Furthermore, a typical selection study provides information on the pattern and strength of selection for just one generation, or one episode of selection for a perennial plant. It is highly beneficial to know whether there is temporal or spatial variation in the plants’ environment that alters the patterns of selection. For instance, in some years or locations, tolerant genotypes may be favored, while in others, resistant genotypes may be favored. Such genotype-by-environment interactions could help explain not only negative correlations between tolerance and resistance, but also the maintenance of genetic variation for defense traits in natural plant populations[45,48,50,56].Here, we report on a study of spittlebug herbivory on the goldenrod Solidago altissima to provide insight into simultaneous selection for resistance and tolerance. This study comprises three components: 1) a common garden experiment to estimate resistance of 26 genets of S. altissima to spittlebugs, 2) a greenhouse experiment to measure fitness impact of spittlebugs on ramets of the same 26 genets, and 3) a mathematical model (parameterized with our empirical results) to investigate the strength of selection on resistance and tolerance across a wide range of spittlebug densities. With the experiments and the model, we address three main questions about this population of goldenrod: 1) Are resistance to and tolerance of spittlebug damage genetically correlated? 2) How does the strength of selection for resistance compare with selection for tolerance? and 3) How are the direction and strength of selection on resistance and tolerance expected to change across a range of spittlebug population densities?
2. Materials and Methods
2.1. Study System
- Solidago altissima L. (Asteraceae), or tall goldenrod, is a weedy perennial herb that, while native to the eastern United States, has become common throughout most of the U.S. as well as parts of Europe and Asia[57-60]. In Pennsylvania (the site of this study), shoots emerge from rhizomes in mid-spring, and flowering begins in late summer or early autumn. A mature ramet produces an inflorescence (a branching panicle) that may contain hundreds to thousands of small heads (capitula) that bear on the order of 12 to 25 florets each[61]. Each floret matures a single-seeded fruit, called an achene, that is dispersed by wind in late autumn.The goldenrod plants used in these studies originated from a 3-ha old-field population in Union County, Pennsylvania (40°57.9′ N, 76°57.3′ W). In early spring of 2003—prior to shoot emergence—we excavated rhizomes from 26 widely separated, discrete clumps of the previous year’sS. altissima stems. These rhizomes served as the source of the 26 genets used in the garden and greenhouse experiments described below. The rhizomes were taken into a greenhouse, cut into 2-cm3 segments (measured using water displacement in a 100-mL graduated cylinder) and planted in flats with commercial growing medium (ProMix BXTM, Premier Horticulture, Dorval, Quebec, Canada). After shoots emerged from the rhizomes in the flats, ramets were transplanted individually into 16.5-cm plastic azalea pots. Fifteen ramets per genet were randomly selected to be transplanted into the garden plot later that spring. At least five other ramets per genet were transplanted into 27-cm diameter pots and grown until senescence in late autumn of 2003. The rhizomes from these pots were refrigerated over winter.In the spring of 2004, 2-cm3 segments of new rhizome growth were cut from each of the 26 genets and were again grown in Pro-Mix BX™, first in plastic flats in a greenhouse, then in 27-cm plastic standard pots. These pots were placed on pallets in a semi-protected, unshaded area outside of the greenhouse until senescence in late 2004. The new rhizomes were once again refrigerated over winter and used for the greenhouse experiment in 2005.Philaenus spumarius (L.) (Cercopidae), or the meadow spittlebug, is a cosmopolitan species that can often be a serious agricultural pest[62,63]. It is extremely polyphagous, but goldenrods appear to be among its favorite hosts[62-64]. Adult meadow spittlebugs are highly mobile, jumping or flying between plants to feed upon xylem fluid. Females lay eggs in leaf litter or soil beneath potential host plants in late summer and early autumn[62]. Nymphs hatch in spring and crawl to the nearest suitable plants to begin feeding by tapping into the xylem flow. Nymphal feeding generates a mass of spittle that appears to serve a protective role against desiccation and predation[65,66]. Goldenrod populations are subject to large densities of spittlebug nymphs in favorable years[67,68], particularly those with moist springs. In excess of20nymphs may be found on a singlegoldenrod ramet, often feeding in shared spittle masses[64,69] (Figure 1). In dry periods, mortality of eggs and hatchlings is apparently quite high[62], resulting in very small populations of nymphs on goldenrod. Nymphs go through five instars over about a 3-8 week period prior to eclosion into adults[63,70].
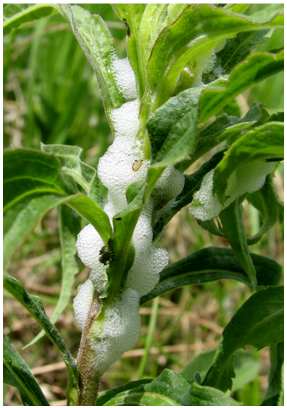 | Figure 1. Photograph of a Solidago altissima ramet being fed upon by Philaenus spumarius. Each spittle mass may include multiple nymphs. (The photograph was taken by MJW on 17 May, 2007 in Mifflinburg, Union County, Pennsylvania.) |
2.2. Garden Experiment – Goldenrod Resistance to Spittlebugs
- This experiment used the same garden plot at Bucknell University that has been described in previous articles; more details on the garden can be found by consulting those papers[76-78]. Briefly, the garden plot consisted of 390 clusters of S. altissima ramets—15 clusters each for the 26 different genets—arranged in 15 spatial blocks (one cluster per genet per block). The S. altissima ramets grew amid a matrix of weedy plants that naturally colonized the garden plot. The garden was planted in the spring of 2003, and adult spittlebugs colonized all blocks of the garden during the summer of 2003. Data on feeding by spittlebug nymphs were taken in the spring of 2004.In May of 2004, we placed wire-staked flags next to the five S. altissima ramets closest to the original planting position for the 390 clusters. Some clusters consisted of fewer than five ramets, but all clusters had at least two ramets, and the mean number flagged per cluster was 4.83(SD = 0.53). From 25 May through 3 June, we searched each of the 1883 flagged ramets and recorded the presence of established spittlebug masses or evidence of characteristic damage caused by spittlebug nymphs. We then calculated the mean proportion of ramets with spittlebugs for the 15 clusters for each genet, as well as the mean proportion of ramets with no evidence of spittlebug feeding. The former proportion served as the damage (DG) estimate, and the latter as the resistance (ResG) estimate for each genet. These values were used in the analyses described in Section 2.4 below.
2.3. Greenhouse Experiment – Goldenrod Tolerance of Spittlebugs
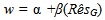
- The details of the design of this greenhouse experiment have also been described previously[76]. Briefly, in the spring of 2005, 18 ramets of each of the same 26 goldenrod genets used in the garden plot were propagated from 2-cm3 rhizome segments that were planted in flats, then transplanted into 16.5-cm plastic azalea pots filled with ProMix BXTM. The experimentaldesign consisted of two blocks, each with nine ramets from each genet randomly placed among four greenhouse benches. A spittlebug treatment of 0, 1, 2, 3, 4, 5, 6, 7, or 8 nymphs was randomly assigned to the nine ramets for each genet per block. On 3 June, early-instar, field-collected spittlebug nymphs were placed onto the ramets according to their assigned treatments. The ramets were checked the next two days to add nymphs if any did not survive the transplanting. The ramets were checked again three times daily, starting on 13 June, to collect adult spittlebugs as they eclosed, so that the ramets were exposed to feeding by nymphs only.The plants were watered regularly and fertilized as needed with 59 mL (1/4 cup) Peters Professional®15-16-17 NPK water-soluble fertilizer (J. R. Peters, Allentown, PA), which was mixed at 3.9ml of dry fertilizer per liter of water (i.e., 1 tablespoon per gallon) until senescence in autumn. Once a ramet finished flowering and started to mature its achenes, we obtained an estimate of its total seed production. Each branch of the infructescence (panicle) was removed one at a time, and the number of capitula on the branch was recorded. Thus we had exact numbers of capitula produced per ramet. Ten capitula from different areas of the infructescence were collected and dissected under a stereo microscope to calculate the mean number of seeds per capitulum—a value that has been found to vary among genets and environmental conditions[61]. The number of capitula on a ramet was multiplied by the mean number of seeds per capitulum for that ramet to obtain the best possible estimate of seed production for each ramet.For each genet, we then quantified tolerance (TolG) of spittlebug damage using a regression of seed production of each ramet on the number of nymphs that fed on each ramet:
 | (1) |
2.4. Selection Analyses
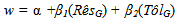
- Our main goal was to investigate how the strength and direction of natural selection acting on resistance and tolerance may change across a range of spittlebug population densities. We used a series of standardized genotypic- selection analyses to accomplish that goal[53,79]. Several steps had to be taken prior to performing the selection analysis: 1) determine the number of nymphs per ramet for each genet at a given spittlebug population density; 2) calculate the seed production per ramet at a given spittlebug population density; 3) convert seed-production values to relative-fitness values; and 4) standardize the resistance and tolerance values for the genets. The number of nymphs per ramet depends on two factors: the resistance of the genet and the population density of spittlebugs. We modeled the population densities over a range of 0 to 20 nymphs per ramet; that is, we modeled a ramet with average resistance as having from 0 to 20 spittlebugs. To do this, we converted the DG values for each genet to a relative-damage value (DamG) by dividing DG by the overall proportion of ramets damaged across all 26 genets. To determine the number of nymphs present at a given spittlebug density (SB) for the ramets of a genet, we multiplied DamG by SB as we varied SB from 0 to 20. For example, at SB of 10, a genet with average resistance (DamG = 1) would be modeled as having 10 spittlebug nymphs per ramet, while a genet twice as resistant (DamG = 0.5) would have 5 nymphs per ramet.To model the number of seeds per ramet for each genet at a given spittlebug population density, we need to know three things: 1) the number of seeds a ramet produces without spittlebugs (IntG); 2) the number of spittlebugs feeding on it (SB x DamG); and 3) how many seeds each spittlebug costs a ramet of that genet (TolG). For each SB value, in increments of one from 0 to 20, we calculated a per-ramet seed-production value (Seeds) for each genet using the following equation:
 | (2) |
 | (3) |
 | (4) |
 | (5) |
2.5. Genetic Correlation
- Finally, to estimate the genetic correlation between resistance and tolerance against spittlebugs in this population of goldenrod, we calculated the Pearson product-moment correlation between the standardized tolerance (TôlG) and standardized resistance (RêsG) valuesfor the set of 26 genets. (Standardization does not affect the magnitude or statistical significance of the correlation.) All statistical analyses in this report were performed using JMP-IN 4.0.4 (SAS Institute, Cary, North Carolina, USA).
3. Results
3.1. Garden Experiment – Goldenrod Resistance to Spittlebugs
- Spittlebug-feeding damage was detected on 720 of the 1883 ramets sampled in the garden plot. The damage estimates varied across genets from a minimum of 24% of the ramets for the most-resistant genet to 56% of the ramets for the least-resistant genet. The relative damage measurements (DamG) for the genets, calculated as described in Section 2.4, ranged from 0.63 to 1.47. Spittlebug nymphs were well distributed among the fifteen blocks of the garden: The block factor explained 9% of the variation in the proportion of ramets with spittlebug feeding, with the blocks ranging from 27% to 50% of the ramets damaged (least-squares means from ANOVA).
3.2. Greenhouse Experiment – Goldenrod Tolerance of Spittlebugs
- Across plant genets, each spittlebug nymph cost a ramet an average of 306 seeds—a relatively small but statistically significant decrement (P = 0.03). Like resistance, tolerance varied quite a bit among genets, with the least-tolerant genet losing 1299 seeds per spittlebug nymph. The most-tolerant genet actually overcompensated for spittlebug damage, producing an additional 940 seeds per spittlebug nymph.
3.3. Selection Analyses
- The strength of selection for both resistance and tolerance increased with increasing spittlebug population density (Figure 2). At the lower spittlebug densities, selection acted to decrease both resistance (at SB< 11) and tolerance (at SB< 6), based on the selection differentials (Figure 2A). Selection acting on tolerance was substantially stronger for tolerance than resistance at nearly all spittlebug densities (SB>2).The patterns of the selection differentials and selection gradients were nearly identical for tolerance. In contrast, the selection gradients for resistance were much smaller than the selection differentials (Figure 2B). The selection gradients indicated that there would be no direct selection favoring resistance, even at a spittlebug density of 20 per ramet.
3.4. Genetic Correlation
- Tolerance and resistance were positively genetically correlated in this population under the experimental conditions used, with a Pearson product-moment correlation (r) of 0.42 (P = 0.03; N = 26 genets). However, one of the genets was an outlier in terms of tolerance and was judged to be inordinately influential on the correlation, with a Cook’s D of 0.22[80]. Therefore, we reran the analysis without this genet and still found a strong positive genetic correlation (r = 0.59; P = 0.002; N = 25 genets; Figure 3).
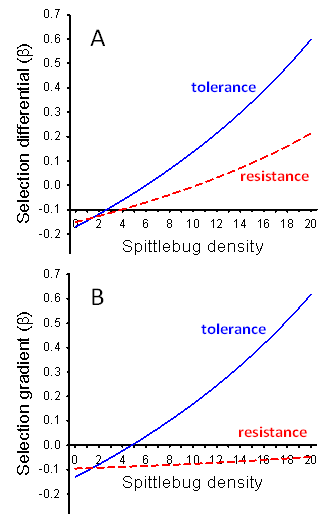 | Figure 2. Results of standardized genotypic-selection analyses on resistance and tolerance at a range of spittlebug population densities. A. Selection differentials. B. Selection gradients. Blue lines = selection coefficients for tolerance. Red lines = selection coefficients for resistance |
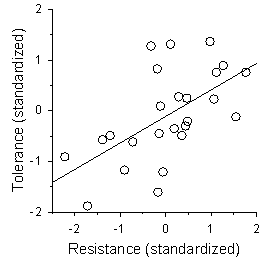 | Figure 3. Genetic correlation between resistance and tolerance. Each point represents a genet mean for the standardized operational values used in the selection analyses (r = 0.59, P = 0.002; N = 25 genets) |
4. Discussion
4.1. Joint Selection on Resistance and Tolerance
- Our analyses suggest that the density of herbivores will affect the strength of natural selection for defense. Not surprisingly, as the modeled density of spittlebugs increased, the strength of selection for resistance and for tolerance also increased. More interestingly, selection favored a decrease in both defense strategies when the density of spittlebugs fell below a level that was still rather substantial: ten nymphs per ramet for resistance and six nymphs per ramet for tolerance. This result serves as good evidence that both defense strategies are costly in terms of plant reproduction. Such costs can help explain why defense traits tend to be at intermediate values in natural plant populations[5,6,8,9,81]. Moreover, a shifting balance of costs and benefits helps explain why populations maintain genetic variation in defense traits. In particular, during years of spittlebug outbreaks, selection would act to increase the mean levels of both resistance and tolerance in S. altissima, while during years of low spittlebug population density, selection would favor plants with low resistance and low tolerance[cf. 48,51,82,83,84].Notably, there was no indication of a tradeoff in selection for resistance versus tolerance with respect to spittlebug density. That is, we did not see any evidence that one strategy was favored at one density range and the other strategy was favored at another density range. In general, either both strategies were selected for or both were selected against. There was good evidence that selection was stronger for tolerance than resistance, and the discrepancy grew as the modeled spittlebug density increased. The selection gradients in particular indicate that S. altissima is much better off tolerating spittlebug damage than resisting spittlebugs. Interestingly, in a recent study of leaf herbivory on S. altissima, Hakes and Cronin[49] also found that there was strong selection for increased tolerance and but decreased resistance to leaf damage. These results may suggest a reason why spittlebugs and leaf-feeding beetles can reach such high densities in goldenrod populations[68].We found a rather strong positive genetic correlation between resistance to and tolerance of spittlebugs in the goldenrod population under the environmental conditions considered. This result suggests that resistance and tolerance are not alternative, mutually exclusive strategies in S. altissima’s defense arsenal.That is, a plant does not have to be bad at one strategy to be good at the other. Such a positive genetic correlation could result from at least two distinct mechanisms: pleiotropy (i.e., a gene influences both resistance and tolerance traits) or linkage disequilibrium (resulting from simultaneous direct selection acting in the same direction on tolerance and resistance)[11,85]. Our selection analyses can lend some insight into which mechanism is more likely.We included two types of selection analyses because the selection differentials and the selection gradients provide different information that together gives a more complete picture than either could alone. The selection differentials (from Equations 3 and 4) show that selection would indeed act to increase both tolerance and resistance at high spittlebug densities and to decrease both defenses at low spittlebug densities. The selection gradients (from Equation 5) show that while selection acting directly on tolerance is strong, selection acting directly on resistance is negligible. Because there is no evidence for simultaneous selection for separate resistance and tolerance strategies across the range of spittlebug densities, it is unlikely that linkage disequilibrium would be able to build up between resistance and tolerance. Thus, the positive genetic correlation between resistance and tolerance is not likely to be a result of the selection pattern. Instead, it is more likely that the positive correlation is related to selection acting on one or more pleiotropic traits that affect both operational resistance and operational tolerance. At high spittlebug densities, the trait(s) are selectively favored because they confer the plants with tolerance, while operational resistance is indirectly selected for because of its correlation with tolerance.
4.2. Model Assumptions
- Our selection models involve a number of assumptions that are worth addressing explicitly. We contend that these assumptions were necessary and reasonable. Moreover, the main strength of the model is its ability to incorporate empirical data into a simple set of equations that lead to readily interpretable results. We discuss the assumptions and limitations below.A core assumption of the model is that tolerance of spittlebug feeding follows a linear function. This is a common assumption in studies of tolerance; in fact, tolerance is most often defined operationallyas the slope of a linear regression of fitness on damage[11,28,29]. With a linear regression, each additional spittlebug was assumed to stress the plant’s reproductive capacity the same amount as every other spittlebug (i.e., their impact was additive). Importantly, because the damage metric was on an additive scale, our fitness measurement (number of seeds) was on an additive scale, rather than being log-transformed. This match of scales is important when making tolerance comparisons [86]. In reality, it is likely that there are aspects of spittlebug feeding (such as facilitation or competition) and plant responses (such as thresholds in capacity to reallocate resources) that will add some nonlinearity to the relationshipbetween damage and fitness[5]. However, as long as these complications do not change the monotonic relationship between damage and seed production, then they are not likely to change the overall pattern of the results of our selection analyses. A second important assumption in our model is that the relative resistance ranks of the genets would remain stable across the range of modeled spittlebug densities. For instance, the most-resistant genet during an average spittlebug year would also be the most-resistant genet during a spittlebug outbreak and during a spittlebug population crash. Empirical results in other plant-herbivore systems suggest that this relationship may not always hold perfectly [10,87,88]. In a prior study on S. altissima, Maddox and Cappuccino[89] found that the relative suitability of four plant genets for aphid growth depended on how much water the plants were given. Thus, genotype-by-environment interactions in the expression of resistance or tolerance may affect predicted evolutionary responses in plant populations. However, unless the resistance ranks of genotypes were completely independent across environments, then this kind of genotype-by-environment interaction would mainly just add a bit of noise onto the overall pattern of selection for defenses.We used separate experiments to measure resistance and tolerance. Again, if there are major genotype-by- environment interactions in expression of these defenses, then measuring resistance in the field and tolerance in the greenhouse could have obscured the relationships between the defense strategies. Importantly, we used clonal progeny of the same set of goldenrod genets in both experiments. The large genetic correlation we found between resistance and tolerance argues that the relationships were not obscured by using different environments. In fact, our use of separate experiments was an intentional choice to avoid the complicated, confounding issues inherent in measuring resistance and tolerance in a field setting on the same individuals[55]. For example, one cannot estimate the tolerance of highly resistant individuals because these individuals will not have enough damage[9]. Measuring tolerance in the greenhouse enabled us to use the same range of damage for all genets and to isolate the effects of spittlebug feeding by controlling extraneous factors that would be encountered in the field. Our study involved operational measurements of resistance and tolerance. As such, we did not identify any specific traits that confer resistance or tolerance. The identification of the mechanisms of resistance to and tolerance of spittlebugs would certainly be a valuable addition, or next step to this study[cf. 26,48,49,90]. Here, we focused on operational measures because theyintegrate the total effect of all the various component traits that constitute resistance and tolerance[1,44]. The operational measurements, therefore, allowed us to focus on the evolution of overall patterns of defense strategies. Finally, each of our separate selection analyses (i.e., at each spittlebug density) was relatively small in terms of the sample size of 26 genets. Phenotypic-selection analyses generally include measurements of many hundreds or even thousands of individuals. Our experiments did include a large number of individuals, with 1883 ramets measured in the garden plot and 468 ramets in the greenhouse experiment. However, we used genotypic-rather than phenotypic- selection analyses. Part of this decision was practical: Tolerance is a norm of reaction and thus cannot be quantified on single individuals[28]. The resistance measure we used was also quantified on a per-genet basis. The clear patterns we observed in our results suggest that our sample sizes were large enough to see the effect of spittlebug density on selection for resistance and tolerance. Moreover, genotypic-selection analyses essentially eliminate the risk of environmental bias and thus provide selection coefficients that are more directly applicable to evolutionarily relevant variation in the selected traits[52,53].
5. Conclusions
- The meadow spittlebug is among the most cosmopolitan and polyphagous of herbivorous insects, and goldenrods, particularly S. altissima, have served as model plant species for evolutionary-ecology studies. Nevertheless, this is the first study that has looked simultaneously at the two main categories of goldenrod’s defense against spittlebugs. Through a combination of empirical data and modeling, we found that both tolerance and resistance against spittlebugs entail costs that may limit their evolution in goldenrod. Our results suggest that at high spittlebug densities, there is strong directional selection to increase tolerance, but only weaker, indirect selection to increase resistance. The indirect selection for resistance may be a result-rather than a cause-of the large positivegenetic correlation between resistance and tolerance in this goldenrod population. We conclude that selection for tolerance rather than resistance, in addition to the costs of defenses, may help explain the maintenance of large populations of fitness-reducing insect herbivores in natural plant populations.
ACKNOWLEDGEMENTS
- We would like to acknowledge the numerous Abrahamson Lab members who assisted in collecting spittlebug nymphs in the field, taking measurements in the garden, propagating plants, capturing eclosing spittlebug adults in the greenhouse, and counting goldenrod capitula and seeds for the studies included in this paper: B. LaFlamme, N. Dorchin, P. March, J. Partelow, D. Kieffer, R. Fox, K. Everson, and A. Snyder.We thank Rolf and Anick Helbig for permission to collect goldenrod rhizomes on their property andthe New York Department of Environmental Conservation for permission to collect spittlebugs at the Upper and Lower Lakes Wildlife Management Area.Our work was supported financially by the David Burpee Endowment of Bucknell University and National Science Foundation grants (DEB-0515483) to WGA and MJW and (DEB-0343633) to WGA and J.T. Irwin.Any opinions, findings, and conclusions expressed in this material are those of the authors and do not necessarily reflect the views of the National Science Foundation.