-
Paper Information
- Previous Paper
- Paper Submission
-
Journal Information
- About This Journal
- Editorial Board
- Current Issue
- Archive
- Author Guidelines
- Contact Us
International Journal of Finance and Accounting
p-ISSN: 2168-4812 e-ISSN: 2168-4820
2016; 5(5A): 49-58
doi:10.5923/s.ijfa.201601.04

Empirical Research on Depreciation of Business R&D Capital
 Abstract
 Reference
 Full-Text PDF
 Full-text HTML
Akiyuki Tonogi1, Michiyo Kitaoka2, Wendy C. Y. Li3
1Visiting Fellow, Economic and Social Research Institute, Cabinet Office, Japan and Lecturer, Institute of Economic Research, Hitotsubashi University, Japan
2Research Officer, Economic and Social Research Institute, Cabinet Office, Japan
3Research Economist, Bureau of Economic Analysis, Department of Commerce, United States of America
Correspondence to: Akiyuki Tonogi, Visiting Fellow, Economic and Social Research Institute, Cabinet Office, Japan and Lecturer, Institute of Economic Research, Hitotsubashi University, Japan.
| Email: |  |
Copyright © 2016 Scientific & Academic Publishing. All Rights Reserved.
This work is licensed under the Creative Commons Attribution International License (CC BY).
http://creativecommons.org/licenses/by/4.0/

The Japanese Government is planning to change the estimation methods of the Japanese System of National Accounts (JSNA) in 2016, from the 1993 System of National Accounts (SNA) to the 2008 SNA. Following this change, research and development (R&D) expenditures will be counted as investments, and will be capitalized in GDP account. To capitalize R&D expenditures, we need to estimate R&D capital stock; hence, the methods of estimating R&D depreciation rates are critical. Consequently, this paper investigates R&D depreciation in the JSNA based on the methodology developed by Li (2012a). By adopting Li’s model and using data on industry outputs and R&D investments from Japan, we estimate R&D depreciation rates for 20 Japanese industries. Our estimates are consistent with the results of prior studies and recent survey results reported by Miyagawa et al. (2014).
Keywords: Intellectual property product, Intangible asset, Research and development, Depreciation rate
Cite this paper: Akiyuki Tonogi, Michiyo Kitaoka, Wendy C. Y. Li, Empirical Research on Depreciation of Business R&D Capital, International Journal of Finance and Accounting , Vol. 5 No. 5A, 2016, pp. 49-58. doi: 10.5923/s.ijfa.201601.04.
Article Outline
1. Introduction
- Numerous economists have recognized the importance of intangible capital for a country’s economic growth. Corrado et al. (2009) point out that, in the U.S.A., the contribution of intangible capital to economic growth has been on par with that of tangible capital after the 1990s. Moreover, McGrattan and Prescott (2010) include intangible capital in a standard real business cycle model, and the modifications to the model improve business cycle accounting for the U.S.A.In response to these research trends, the United Nations Statistical Commission formulated a new System of National Accounts (SNA) standard, the 2008 SNA, to replace the 1993 SNA. One major feature of the 2008 SNA is that it provides guidelines on measuring the investment and stocks of intangible capital. Particularly, it includes research and development (R&D) expenses, which were mainly classified as intermediate consumption in the 1993 SNA, as investments that contribute to the knowledge stock. In July 2013, the U.S. Bureau of Economic Analysis (BEA) started capitalizing intellectual property investments, including R&D one. On the other hand, the European Union (EU) formulated the European System of Accounts 2010 (ESA 2010), which is consistent with the 2008 SNA, and all EU members began implementing the ESA 2010 in September 2014.In Japan, the Department of National Accounts, Economic and Social Research Institute, Cabinet Office offers guidelines on how to prepare for the introduction of the 2008 SNA to the National Accounts of Japan in December 2016. Additionally, the Department of National Accounts published the “R&D Satellite Account” in 2011 (DNA, 2011), which presents guidelines for Japan’s survey on R&D and for preliminary estimation methods to measure R&D investments and capital in the Japanese SNA (JSNA). Although guidelines for data collection and measurement methods are included in this publication, Shigeno (2012) argues that three major challenges need to be addressed before R&D investments can be capitalized in the Japanese SNA. The first challenge is the availability of basic statistics related to R&D investments for quarterly and revised estimates. To address this challenge, Tonogi et al. (2014) suggested the basic statistics and estimation methods of quarterly and revised estimates. The second challenge is measuring the price deflator of R&D assets. However, the statistical agency plans to use cost price indices as basic statistics for the deflator. The third challenge estimating the depreciation rate of R&D assets.When estimating R&D capital stock using real R&D investment data and the perpetual inventory method, R&D capital depreciation rate is the most important factor for determining the level of R&D capital stock. The “R&D Satellite Account” (DNA, 2011) calculates R&D capital stock using three sets of R&D depreciation rates: 11%, 15%, and the obsolescence rates, which vary across economic activities and are based on the survey results published by the National Institute of Science and Technology Policy in 1999(NISTEP, 1999). The first two depreciation rates (11% and 15%) are obtained from two previous studies on the U.S. R&D satellite account, Carson et al. (1994) and Mead (2007). In the U.S.A., the BEA adopted Li’s (2012a) forward-looking profit model to estimate industry-specific depreciation rates for business R&D capital. The required data are industry output and R&D investments. Therefore, for measuring R&D capital stock in the JSNA, we use Japanese data on industry-specific R&D investments and outputs, and we apply Li’s (2012a) model to estimate Japan’s industry-specific R&D depreciation rates. The data cover 20 industries, and the estimates are consistent with the recent survey results reported by Miyagawa et al. (2014).
2. Model for Implementing Forward-Looking R&D Investment
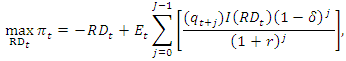
- In this section, we describe Li’s (2012a) forward-looking profit model and our modification of the estimation of one model parameter.The profit function of a representative firm for R&D investment in period t is as follows:
 where
where  is the term profit of the firm,
  is the R&D cost,
  are the future sales in period j, r is the discount rate, and
  is the R&D depreciation rate.
  is the increase in a firm’s profit rate due to the R&D investment in period t. R&D capital depreciates because its contribution to a firm’s profit declines over time, and the rate of decline is
  . A profit-maximizing firm will choose an R&D investment amount that maximizes the sum of the discounted present value of future profits minus R&D costs in period t.The increase in profit rate due to R&D investment is formulated as follows:
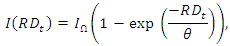 where
where  is the upper limit of the R&D contribution to the profit rate increase, and
  is the R&D scale adjustment parameter. The function satisfies the following properties:
  and
and  . Li’s formulation (2012a) of the
  function is inspired by a similar approach in Cohen and Klepper (1996).The first-order condition of the profit function is
 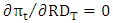 , that is,
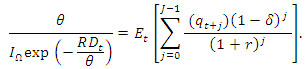 Assuming a sufficiently large projection period, J, the distance function for the estimation of
  can be specified as:
  Since the distance function is non-linear, we solve the minimization problem using numerical nonlinear minimization techniques.To solve the distance function numerically, we determine the values of r and
  . First, we determine the strategy to evaluate the discount rate, r, which is an opportunity cost of R&D investment. Since tangible capital investment is considered an alternative investment opportunity for R&D investment, we adopt the average rate of return on tangible capital as the discount rate.Second, we determine how to evaluate the upper limit of the R&D contribution to the profit rate increase
  . Following Li (2012a), we use the average rate of return on tangible capital. Third, we define the strategy for evaluating the R&D scale adjustment parameter
  . Since the R&D scale adjustment parameters vary by industry and period, we use the estimated time trends of the R&D investments for each industry.In Li (2012a), the first-order time trend of the R&D investment of industry i is:
 However, we use the second-order time trend of the R&D investment of industry i, which is formulated as:
 The fitted values of the second-order time trend regression are adopted as
  in our study, to fit the hump-shaped time-series of Japan’s R&D investments:
 If we have data for
  and
and  , we can estimate the R&D depreciation rate and
  using the estimated values of r and
  .
.3. Data
- To estimate industry-level R&D depreciation rates by the model described in the previous section, we construct a dataset of sales and R&D investments of Japanese industries from the Scientific Research and Development Survey (SRD), conducted by the Statistics Japan and the Japan Industrial Productivity (JIP) Database and compiled by the Research Institute of Economy, Trade and Industry, Japan. The dataset is compiled based on the industry classification presented in Table 1.
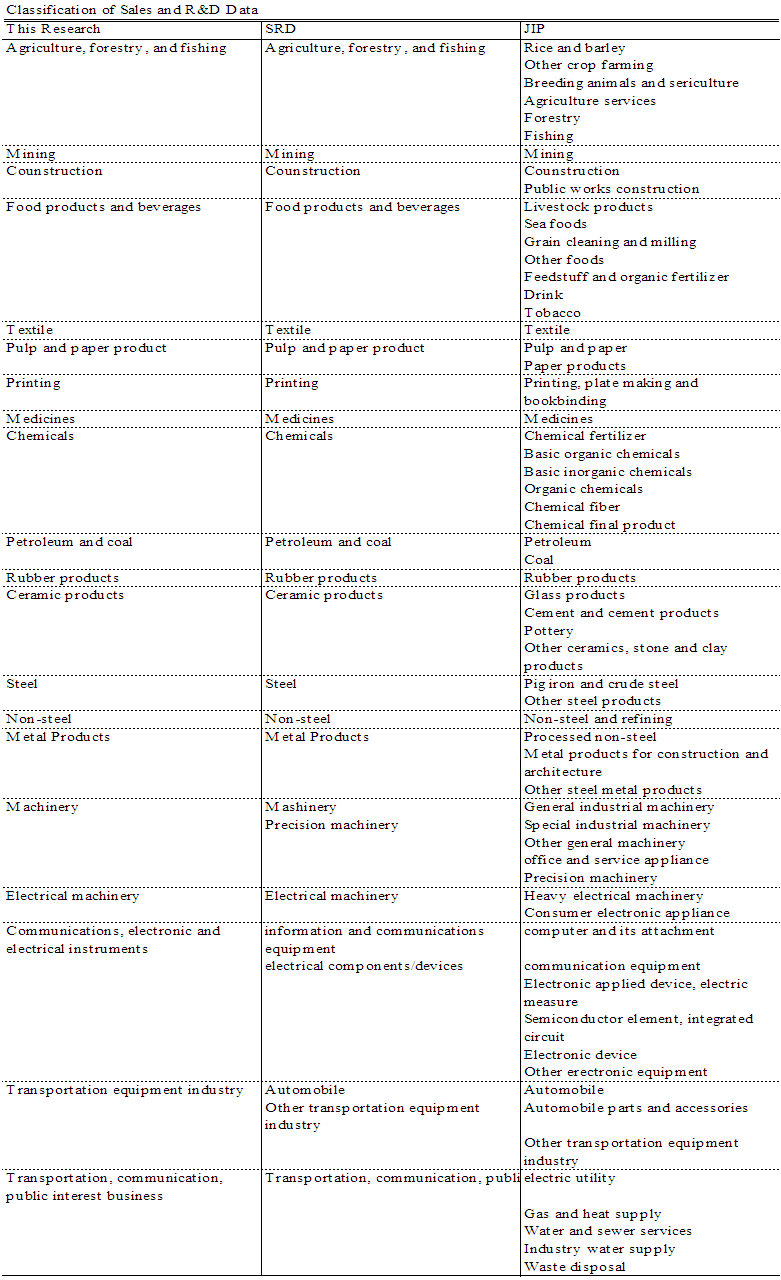 | Table 1. Industry Level Classification of Sales and R&D Data |
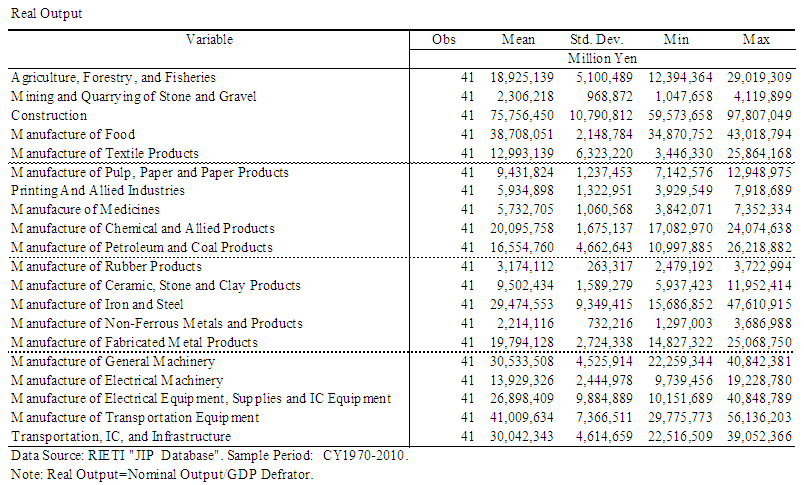 | Table 2. Summary of Industry Level Sales Data |
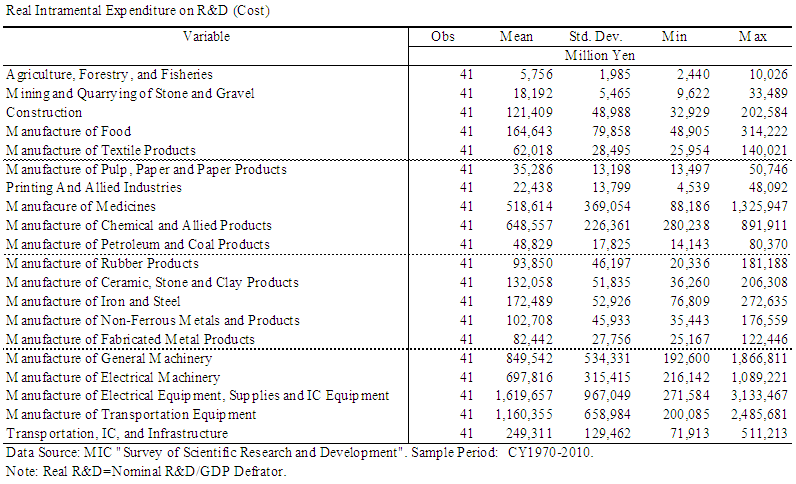 | Table 3. Summary of Industry Level R&D Investment Data |
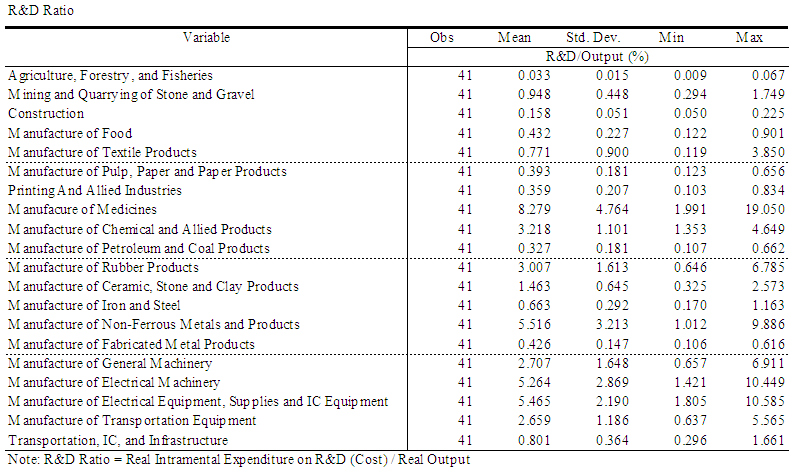 | Table 4. Summary of R&D Intensity |
4. Empirical Analysis
- We estimate industry-specific R&D depreciation rates under two assumptions. First, we assume that the firms have perfect foresight in sales forecasting. Under this assumption, we can use R&D investment data for only 21 years (1970–1991) in our distance function data calculations because, in our estimation, the firm’s prediction terms are considered to be for the subsequent 20 years. In the second setting, we assume that firms are supposed to forecast future sales with an autoregressive model. We generate 1,000 samples of the sales forecasts using stochastic simulations during the 1991–2030 period, and minimize the distance function using the 20-year sample period 1991–2010 to obtain the average and standard deviation of the R&D depreciation rates by industry. The second assumption is consistent with the method used by Li (2012a). Before the estimation, we set
 (i.e., scale adjustment parameter). We use the second-order trend fitted value of R&D investment as
  , as described in the previous section. Figure 1 shows the trend and the actual industry R&D investment data.
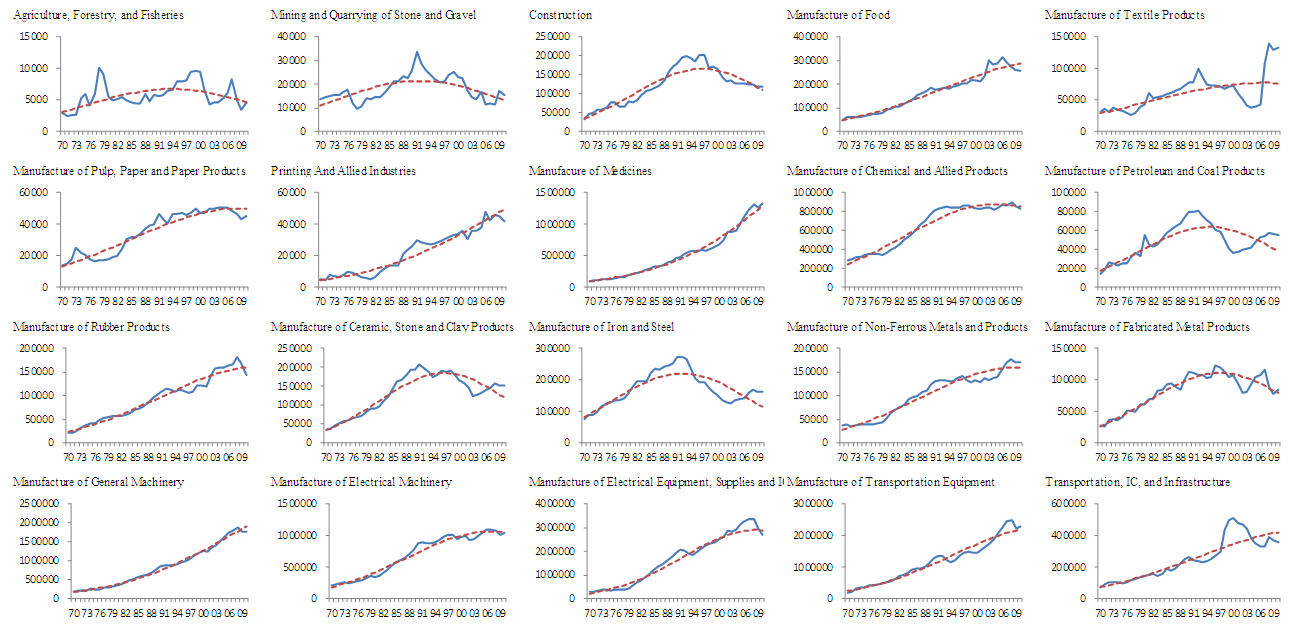 | Figure 1. R&D Investment and Second-Order Time Trend |
 (i.e., upper limit of the contribution function) and r (i.e., discount rate of future sales) in the distance function. We also use several settings of
  in our estimations because the upper limit of the contribution function is not available. It is possible that the average rate of return on all capitals in Japan
  could be too low to serve as the upper limit of contribution for R&D investment. Therefore, we test the estimation with a higher upper limit of contribution, using the average rate of return on all capitals in the U.S.A.
  and the average rate of tangible capital user cost in Japan
  . Furthermore, we test the estimation using actual time series for tangible capital user cost in Japan for the upper limit. We check the four cases for discount rates because the true discount rate is not identified. We report the estimated results in Table 5.The estimates indicate that the R&D depreciation rates of R&D-intensive industries are lower than those of non-R&D-intensive industries. However, non-R&D-intensive industries have R&D depreciation rates above 0.5, which implies that service lives of the R&D assets in these industries are short. When both the discount rate and the upper bound of return rate are lower, the R&D depreciation rates are lower as well. Nonetheless, given the same discount rates, when the upper bound of the return rate is lower, the R&D depreciation rate is lower. With the standard setting of
  , the R&D depreciation rates for R&D-intensive industries are in the range 0.19–0.61.
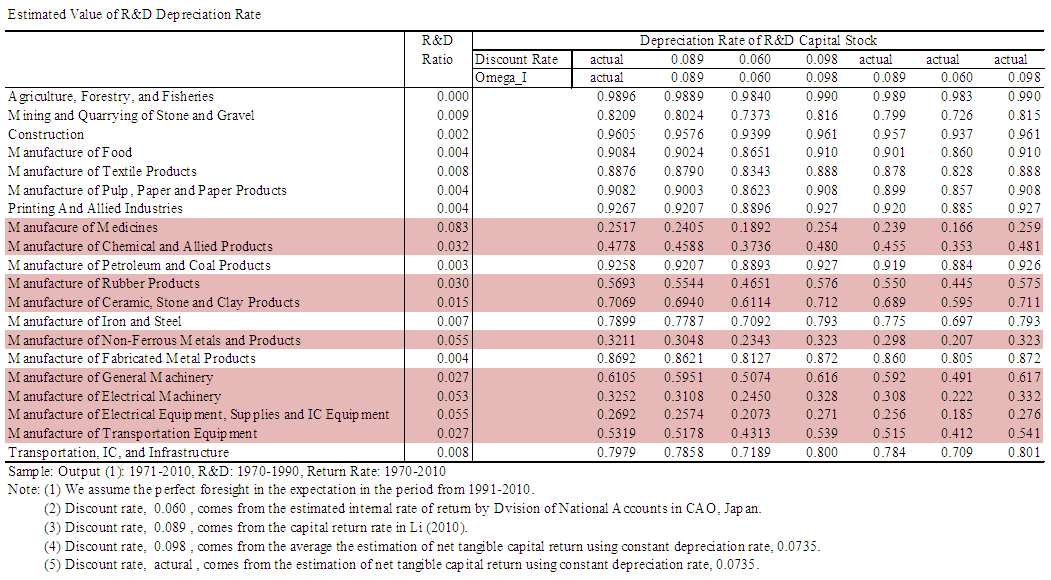 | Table 5. Estimated Values of R&D Depreciation Rates (Perfect Foresight) |
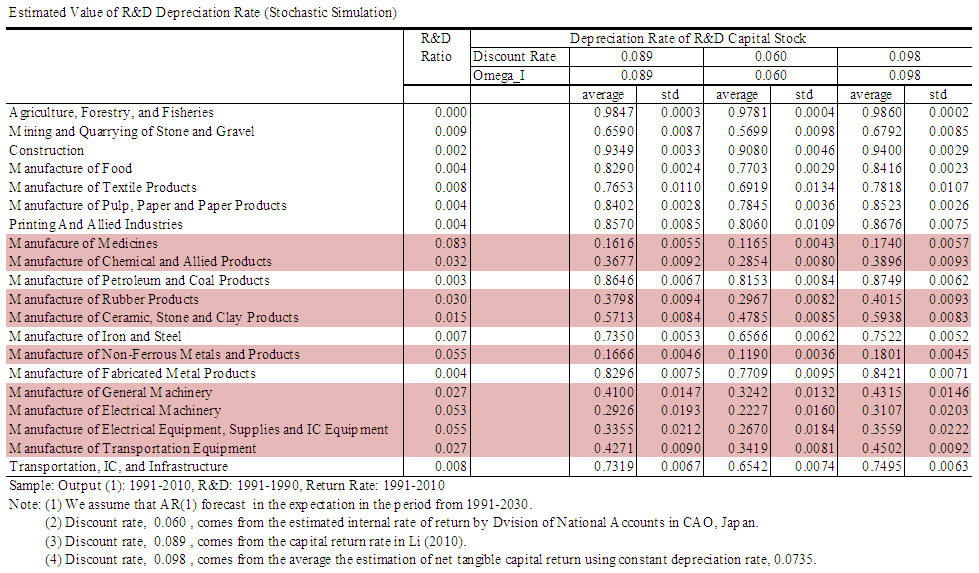 | Table 6. Estimated Values of R&D Depreciation Rates (Stochastic Simulation) |
 . We infer that the differences are mainly because of the difference in the sample periods. Despite differences in the level of R&D depreciation rates for the perfect foresight method and that of the stochastic simulation method, their values are similar in both estimates.Miyagawa et al. (2014) conduct an R&D survey on Japanese firms and report that scientific R&D service lives are between two and seven years. If the inverse of the duration is interpreted as depreciation rate, the implied R&D depreciation rates would be between 14% and 50%, approximately. Table 7 presents the industry level comparison of the estimated R&D depreciation rates based on the stochastic simulation method, and the implied ones based on the Miyagawa et al. (2014) survey. The relative industry rankings in terms of the corresponding R&D depreciation rates are similar for the two methods.
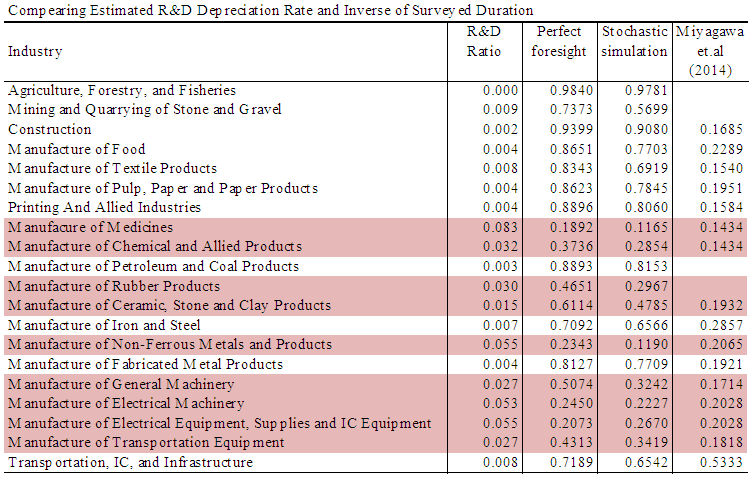 | Table 7. Comparison of Estimated R&D Depreciation Rate and Inverse of Surveyed Duration |
5. Conclusions
- In this study, we adopt the forward-looking profit model of Li (2012a), and use Japanese data on industry R&D investments and outputs to estimate industry-specific R&D depreciation rates for 20 industries. Our estimates are consistent with the results of previous studies (Hachiya, 2005; NISTEP, 1999) and the recent survey results reported by Miyagawa et al. (2014). As such, the estimated R&D depreciation rates for non-R&D-intensive industries are greater than 0.5. The relatively higher R&D depreciation rates for non-R&D-intensive industries may reflect the fact that firms in these industries cannot better appropriate the returns from their R&D investments compared to their counterparts in R&D-intensive industries. The estimated R&D depreciation rates for R&D-intensive industries are in the 0.12–0.48 range; these rates are not very different from the U.S. R&D depreciation rates estimated based on Li’s model (2012a). These results could indicate that Japanese and U.S. high-tech firms have similar technological competitiveness. Additionally, the abilities of these firms to appropriate the returns from their investments in R&D are similar across industries. Moreover, since most previous econometric models cannot provide a good methodology for estimating R&D depreciation rates, the OECD Intellectual Property Product manual (OECD 2010) recommends the use of expert opinions or surveys to estimate R&D depreciation rates (Peleg, 2008). On one hand, the fidelity of past surveys has been seriously questioned. For example, a large-scale survey of 39,968 U.S. firms conducted in 2010 received an extremely low response rate (2.45%) (Li, 2012b), while a U.K. survey of 1,701 firms conducted in 2012 showed very high uncertainty (Ker, 2014). Expert opinions, on the other hand, can vary significantly, and no known method can reconcile these differences. Therefore, neither suggested methods can provide a true solution. Given these difficulties, the OECD (2010) further suggests that a single average service life of 10 years should be retained if no good solution can be found. This implies that both developed and emerging countries have the same R&D productivity growth, which contradicts common sense. Moreover, it is incorrect to assume that all countries and industries have the same technological progress pace. Therefore, in this paper, we applied Li’s model (2012a) and uses data from Japan to estimate the R&D depreciation rates for 20 Japanese industries. The estimates we obtain are consistent with industry observations and results of past studies. There are several tasks that need to be analyzed in future research. In this paper, we assume that R&D investments affect current and future sales. Generally, R&D investments are assumed to affect added value or profit because they are implemented in order to cut costs rather than increase sales. As such, further consideration of firm expectations may be required. We use actual data in the perfect foresight case as expected sales and simulated data in the stochastic simulation case. However, the R&D depreciation rate estimated with the forward-looking model might be far from actual expectations of Japanese firms. To validate the results, future research could use the survey of the expectations of firms. Furthermore, the functional form of sales contribution needs to be examined. The functional form of sales contribution in this research is a hypothetical one. As such, the relation between R&D investments and future sales or profit needs to be investigated using firm micro data (such as financial statements).
ACKNOWLEDGEMENTS
- The authors would like to thank Tsutomu Miyagawa and the participants of the ESRI Seminar from February 18, 2015 for their helpful comments. This research is financially supported by the Grant-in-Aid for Research Activity Start-up (Research Project Number: 25885032).
Notes
- 1. Miyagawa and Hisa (2013) estimate the intangible assets based on Japan Industrial Productivity (JIP) database.2. Hachiya (2005) estimates the business R&D depreciation rate to be 20.2%, based on the survey in NISTEP (1985), by considering a scrap value. NISTEP (1999) reports that the average profit duration of business R&D is 8.7 years, based on a survey of 515 firms.