Keiichi Shima
Faculty of Humanities, Law and Economics, Mie University, Tsu, Japan
Correspondence to: Keiichi Shima, Faculty of Humanities, Law and Economics, Mie University, Tsu, Japan.
| Email: |  |
Copyright © 2016 Scientific & Academic Publishing. All Rights Reserved.
This work is licensed under the Creative Commons Attribution International License (CC BY).
http://creativecommons.org/licenses/by/4.0/

Abstract
This article explores the empirical relationship between market conditions and capital investment. We extend the q investment model to the circumstances of oligopolistic market competition. Several regression models are employed to investigate the possible difference between firms with large and small market shares. We find that industry concentration has a negative influence on investment by firms with small market shares and little influence for large-share firms. This result is consistent with the preemptive investment hypothesis. This paper also examines the investment bandwagon hypothesis. We find that firms with smaller market shares are more likely to “hop on the investment bandwagon”.
Keywords:
Capital Investment, Industry Concentration, Bandwagon Effect
Cite this paper: Keiichi Shima, Market Structure and Investment, International Journal of Finance and Accounting , Vol. 5 No. 5A, 2016, pp. 30-35. doi: 10.5923/s.ijfa.201601.02.
1. Introduction
Industrial organization literature has attempted to explain the determination and adjustment of capacity investment. One of the central issues concerns the determinants of market structure. The structure of an industry plays a fundamental role in the determination of a firm’s investment. Market competition might influence a firm's investment decision, and the link between market structure and investment is important. One of the facts found in the literature is that there is a tendency for oligopolistic markets to exhibit excess capacity. Oligopoly theory has viewed strategic investment in capacity as an important element to explain the oligopolistic interdependence between firms. The scale of investment can depend on a firm's existing position in the industry. Firms with large market shares can influence the market outcome through their choices of capital stock.Theoretical work offers predictions about the effects that capacity competition in oligopoly markets have on firm investment. Several studies focus on the firm’s capacity choice to preempt rivals or deter entry. Spence (1977) and Dixit (1980) describe an industry where incumbents hold enough idle capacity to threaten potential entrants. Excess capacity makes the entry unprofitable. There are a number of empirical papers on preemptive investment. However, the results of these papers are mixed. Hilke (1984) finds a negative but insignificant relationship between entry and excess capacity. Masson and Shaanan (1985) find that greater excess capacity inhibits entry. Lieberman (1987) finds no evidence of entry deterrence or accommodation by incumbents.Gilbert and Lieberman (1987) find that the pattern of capacity investment by larger firms is consistent with market share maintenance, while smaller firms have a tendency to invest simultaneously with rivals. The tendency to maintain market shares implies that preemptive investment does not appear to play a significant role in market competition. The latter tendency is referred to as a bandwagon effect or information cascade (e.g., Bikhchandani et al., 1998). That is, smaller firms rely on rival investment as a signal of market opportunities.Arrow (1962) and Reinganum (1983) argue that incumbent monopolist firms will invest in innovation less than entrants due to the incumbent's tendency to hold back its current innovation effort, to avoid losing its current profit. If innovation is analogous to capital investment, one predicts that firms with dominant positions might invest less than challenger firms. From a different viewpoint, Dixit (1987) considers strategic commitment in contests between a favorite and an underdog and argues that firms with large market shares will overcommit effort more than small-share firms.As the literature suggests, there is a potential role for market conditions variables to influence investment. It remains an open question whether firms' investments are sensitive to market conditions. This paper explores the empirical relationship between market conditions and capital investment. We extend the q investment model developed by Eberly (1997) and Abel and Eberly (2002) to the circumstances of oligopolistic market competition. Several regression models of investment are employed to investigate the possible difference between firms with large and small market shares. The existence of such difference is predicted by theoretical work of preemptive investment stressing the role of excess capacity.
2. Econometric Model
We follow Eberly (1997) and Abel and Eberly (2002) in defining an optimal investment. Firms choose the scale of investment to maximize the value of investment less the cost of investing. The adjustment cost of investing consists of linear costs and convex costs. The linear costs,  are proportional to investments such as the acquisition cost of capital itself. The convex costs of adjusting the capital stock are as in the traditional q theory. The adjustment cost is expressed by
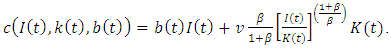 | (1) |
The optimal level of investment  maximizes the excess of
  over
over 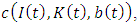 i.e.,
i.e., | (2) |
where  is a shadow price of investing. The first order condition is
 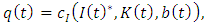 where
where 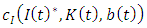 is the marginal cost of investing. The optimal investment can be written in the log form as
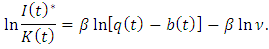 We then empirically investigate if market structure variables affect the level of investment at the firm level. Strategic investment literature suggests that market conditions can influence a firm’s decision to invest in the oligopolistic markets. We introduce strategic effects of market structure variables on investment by
  where x is a market condition vector. The level of investment of firm i in industry j can be expressed by
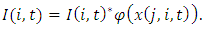 If firms with dominant market shares tend to commit investment in excess capacity, it leads to larger
  augmenting
  When a firm has not established a dominant position in the industry, its capacity expansion might be forestalled by rivals with large market shares. In that case, we expect smaller
  diminishing
  even though investment in extra capacity up to
  is optimal.We use accounting data, which is on an annual basis, to estimate the investment function. We consider the time to build of investing, and investment is the end-of-period value. Capital stock
  the denominator of investment rate, and
  the shadow price of investing, are the beginning-of-period values (values for the previous period). Linear adjustment costs are based on the relative price of capital goods
  which is adjusted by capital depreciation allowances. We follow Eberly (1997) and Salinger and Summers (1983) to calculate
  Details are provided in the next section.We assume that the adjustment cost technology is identical to all firms. For firm i, industry j, at time t, the investment equation in the log form is
 | (3) |
 is assumed to follow a normal distribution with a mean of zero and variance of
  We include industry dummies
  at the two-digit industry level to control for industry specific effects not captured by the other explanatory variables.
  is defined by
 | (4) |
where  is excess capacity,
  is total industry investment, H is the Herfindahl-Hirschman index of industry concentration, and MS is the firm's market share.Assuming
  where V is value added (sales minus material inputs) and no adjustment costs,
 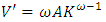 equals the user cost of capital r. The desired capital stock
  is then
  excap is calculated at the industry level by
 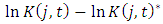 , where
 is industry investment except firm i and is calculated by
 is firm i's share of total industry sales.
  is calculated by
  The parameters in the investment equation are estimated by the maximum likelihood method.
3. Data
We use annual firm-level data from the Development Bank of Japan's Corporate Finance Databank. The data consists of financial statements for publicly-traded firms listed on either the first or second sections of the Tokyo, Osaka, and Nagoya stock exchanges. We construct a panel data set of the Japanese firms in manufacturing industries covering the period of 1970-2010. The manufacturing industry is classified into 17 sectors at the two-digit level and 237 sectors at the four-digit level.Firm level variables are based on the following definitions.  is installed capital expenditures (gross increases in fixed assets).
  is the net fixed assets in the balance sheet. We use the market-to-book ratio as a proxy for the shadow price of investing.
  is calculated as the market value of total assets divided by the book value of total assets, and the market value of total assets is equal to the market value of total equity (the share price multiplied by the number of outstanding shares) plus the book value of total debt.In Eq. (3),
  is the tax-adjusted relative price of capital. We follow Eberly (1997) and Salinger and Summers (1983) to calculate
  is defined as
  where
where  is the statutory marginal corporate tax rate,
  is the present value of depreciation allowances per unit of investment in industry j,
  is a capital price deflator, and
  is a GDP price deflator.The statutory marginal corporate income tax rate is calculated as
 where
where  denote, respectively, the prefectural, city and national tax rate, and
  is a discount rate. We use the 10-year government bond yield minus the annual change rate of GDP price deflator for
  Then,
Then,  is calculated according to
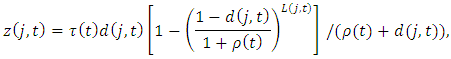 where
where  is a capital depreciation rate and
  is the useful life of capital in industry j. We denote the book value of depreciation for firm i at time t by
  is computed as
 Using the double-declining balance method, the depreciation rate is obtained by
  The market structure variables are constructed as follows.
  is aggregate investment except firm i at the four-digit industry level.
  is the rate by which all firms other than firm i collectively increased their capital stock during the observation year. The variable is introduced by Gilbert and Lieberman (1987) to examine investment bandwagon behavior.
 represents excess capacity evaluated at the four-digit industry level. We define the variable as the log difference between the actual capital stock and the desired capital stock in industry j. To construct the desired capital stock
  we assume
  where
where  is the industry level value added (sales minus material inputs) and no adjustment costs. In the long run,
  equals
 where
where  denotes the user cost of capital. We use the discount rate plus the depreciation rate for the user cost of capital
  is estimated by OLS at the four-digit industry level. Then,
  is computed as
  Aggregate value added is calculated as
 where
where  is value added for firm i at time t.Market share for firm i is calculated according to
  where
where  is firm i's sales at time t. The Herfindahl-Hirschman index is calculated as the sum of squares of market shares for firm i in industry j:

 and
and  are constructed at the four-digit industry level. Firms are also ranked according to their market shares in each industry, and we denote the variable by
  The beginning-of-period values of market structure variables are used in the estimation of Eq. (3).We consider only positive investment rates in the estimation, and to avoid possible estimation problems caused by outliers, any observations more than 5 standard deviations away from the means of
  and
and  are eliminated. In addition to eliminating outliers in
  and
and  observations with missing values for investment and its shadow price, capital stock, and market structure variables are excluded from the sample. The remaining sample consists of 44,402 firm-year observations.
4. Results
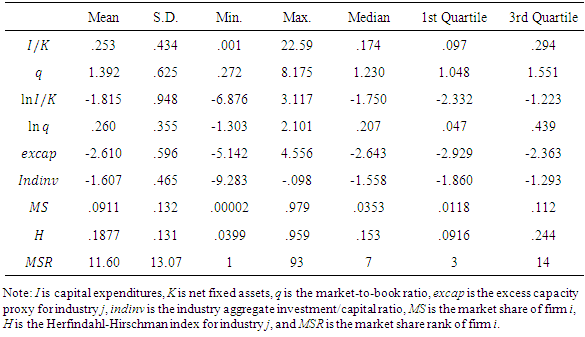
The summary statistics are provided in Table 1. Table 1 also presents the median and first and third quartile values for each variables. The mean, median, and third quartile values of excap are negative, meaning that capacity is likely to be less than optimal in most industries. Market shares for half of the sample firms are about 4% measured at the four-digit industry level. Meanwhile, 25% of the sample include top 3 firms (50% include top 7 firms), according to their market shares.Table 1. Summary Statistics
 |
| |
|
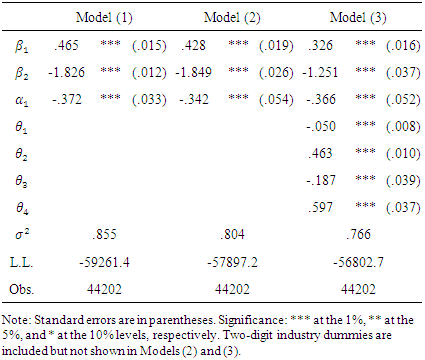
Table 2 shows the maximum-likelihood estimates of parameters of the log investment equation. Only baseline parameters  are estimated in Model (1), while Model (2) includes industry dummies in estimation. By definition,
  is positive, and
  and
and  are negative. The parameter estimates are all significant with the predicted signs. Estimated baseline parameters between the two models do not seem to change much.Model (3) includes the market structure variables as in Eq. (3). Adding
  in the investment equation yields smaller values of
  and
and  (in absolute value).
  and H have negative and significant effects on investment. The negative sign of
  suggests that high concentration decreases investment at the firm level. Firms likely invest less when faced with excess capacity at the industry level. indinv and MS have positive and significant effects on investment. Industry-wide capacity expansion amplifies and synchronizes firms’ investments. We thus confirm the bandwagon effect reported in previous studies (e.g., Gilbert and Lieberman, 1987; Bikhchandani et al., 1998) from the Japanese firm data. The result also shows that firms with large (small) market shares tend to invest more (less). This suggests that investment conducted by firms with small market shares is likely to be preempted.
Table 2. Preemtive Investment and Market Structure
 |
| |
|
These findings suggest that competition, insufficient capacity, and bandwagon behavior in the industries push firms to invest more. Meanwhile, market shares of firms have a positive relationship with investment. H, excap, and  are market condition variables, whereas
  is a firm level variable. From Table 2, the link and interaction of market conditions and the firm's market share are still missing. To further clarify the effects of market conditions on investment behavior of firms with different degrees of market power, we continue our analysis by splitting the pooled sample into quartiles based on their market shares. We then label quartile subsamples as the top, 2nd, 3rd, and bottom quartiles respectively and construct the corresponding dummy variables. We propose the following formula to estimate the interaction:
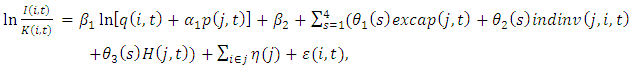 | (5) |
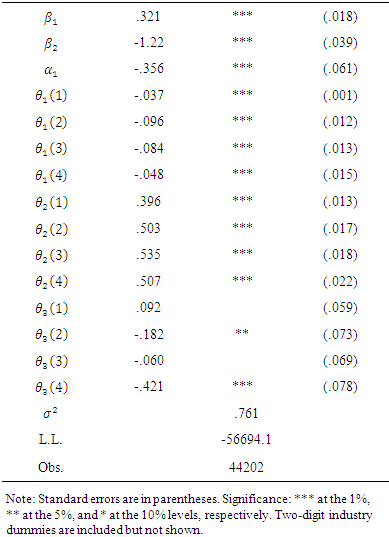
where  corresponds to the parameters in Eq. (4) and s is the quartile number.Table 3 shows the estimation results of Eq. (5). The sensitivity of investment to excess capacity varies across quartiles. The coefficients on excap are all negative and significant. The top quartile has the lowest sensitivity, meaning that dominant firms are least likely to reduce investment when they face a larger amount of capacity compared to the desired level. However, they show a U-shaped relationship between market power and excess capacity sensitivity. The coefficients on indinv are all positive and significant. Firms with smaller market shares are more likely to “hop on the investment bandwagon”. This is precisely consistent with Gilbert and Lieberman (1987).
Table 3. Estimation of Eq. (5): Market Share Quartiles
 |
| |
|
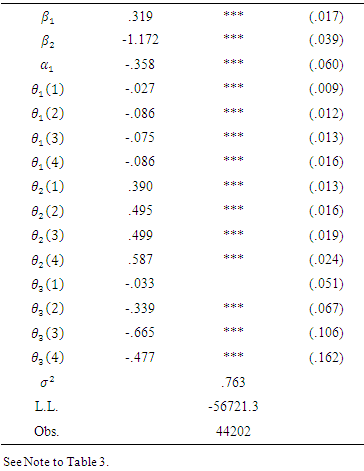
Industry concentration measured by the Herfindahl-Hirschman index has no significant effects on investment for the top and 3rd quartile firms, while it is significant for the 2nd (at the 5% level) and the bottom quartiles (at the 1% level). This indicates that dominant firms conduct investment regardless of industry concentration, but small-share firms reduce investment due to higher concentration. The negative relationship between the Herfindahl-Hirschman index and investment of small-share firms implies that investment of small-share firms is forestalled or deterred by predominant firms in the industry. The behavioral difference between the top and bottom quartiles is consistent with Dixit (1987) in the context of contests: dominant firms invest more, and underdog firms invest less. In addition, the result is not exact, but something similar to the accordion effect demonstrated by Bouis et al. (2009), where firms invest under uncertainty in oligopoly.We repeat our analysis by splitting the pooled sample into quartiles according to their market share ranks. The empirical results are shown in Table 4. The results do not change much when we use quartile subsamples sorted by market share rank to control for the market power difference.Table 4. Estimation of Eq. (5): Market Rank Quartiles
 |
| |
|
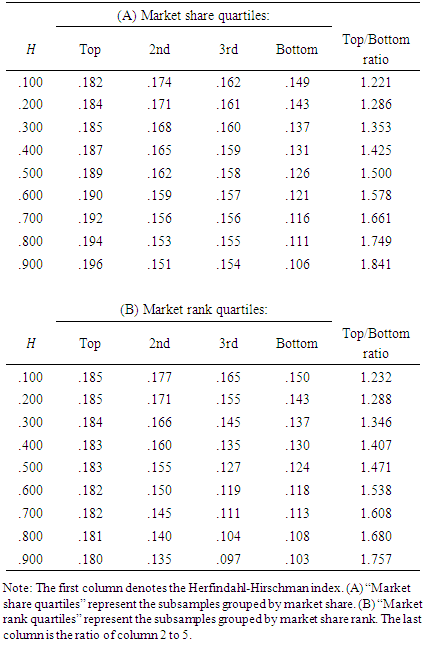
Finally, we compare investment rates by different market power and industry concentrations using quartile subsamples in Table 5. Investment rates are computed by using estimated parameters and mean values of dependent variables (from Tables 1, 3, and 4) for each grid. The first column of Table 5 denotes different ranges of industry concentration. Investment rates for each quartile and each concentration level are given in column 2 through 5. We find rather flat investment rates in the top quartile subsample. In contrast, we observe that investment rates decrease in proportion as industry concentration increases in the lower quartiles. We confirm that the top/bottom quartile ratio of investment rates has an upward slope. In other words, higher levels of industry concentration result in fewer investment rates carried out among small-share firms. Thus, a high level of industry concentration reduces small-share firms' motivation to compete aggressively. The results indirectly support the theory proposed by Spence (1977) and Dixit (1980).Table 5. Investment Rate by Market Power Quartiles
 |
| |
|
5. Concluding Remarks
This paper presents empirical evidence on the effect of market conditions on capital investment. We take into account the importance of market conditions in the dynamic investment model built on the q theory. To integrate implications of oligopoly theory that use investment as an instrument of competition with dynamic investment, we construct several market structure variables and plug them into a log-form investment function proposed by Eberly (1997).We find that industry concentration has a negative influence on investment by firms with small market shares and little influence for large-share firms. This result is consistent with the preemptive investment hypothesis. This paper also examines the investment bandwagon hypothesis. We find that firms with smaller market shares are more likely to “hop on the investment bandwagon”. The result is consistent with Gilbert and Lieberman (1987).
ACKNOWLEDGEMENTS
The author acknowledges the financial support and assistance from the Joint Usage and Research Center, Institute of Economic Research, Hitotsubashi University’s Fiscal 2014 Project Research Program.
References
| [1] | Abel, A.B. and Eberly, J.C., 2002, Investment and q with fixed costs: an empirical analysis. Working Paper, University of Pennsylvania. |
| [2] | Bikhchandani, S., Hirshleifer, D. and Welch, I., 1998, Learning from the behavior of others: conformity, fads, and informational cascades. The Journal of Economic Perspectives, 3, pp.151-170. |
| [3] | Bouis, R., Huisman, K.J. and Kort, P.M., 2009, Investment in oligopoly under uncertainty: the accordion effect. International Journal of Industrial Organization, 27, pp.320-331. |
| [4] | Dixit, A.K., 1980, The role of investment in entry deterrence. Economic Journal, 90, pp.95-100. |
| [5] | Dixit, A.K., 1987, Strategic behavior in contests. American Economic Review, 77, pp.891-98. |
| [6] | Eberly, J.C., 1997, International evidence on investment and fundamentals. European Economic Review, 41, pp.1055-1078. |
| [7] | Gilbert, R.J. and Lieberman, M.B., 1987, Investment and coordination in oligopolistic industries. Rand Journal of Economics, 15, pp.197-212. |
| [8] | Hilke, J.C., 1984, Excess capacity and entry: some empirical evidence. Journal of Industrial Economics, 33, pp.233-240. |
| [9] | Lieberman, M.B., 1987, Excess capacity as a barrier to entry: an empirical appraisal. Journal of Industrial Economics, 35, pp.607-27. |
| [10] | Masson, R.T. and Shaanan, J., 1985, Excess capacity and limit pricing: an empirical test. Economica, 53, pp.365-378. |
| [11] | Salinger, M. and Summers, L.H., 1983, Tax reform and corporate investment: a microeconometric simulation study. In M.S. Feldstein (ed.), Behavioral simulation methods in tax policy analysis. University of Chicago Press, pp.247-288. |
| [12] | Spence, A.M., 1977, Entry, capacity, investment and oligopolistic pricing. Bell journal of Economics, 8, pp.534-544. |

 Abstract
 Reference
 Full-Text PDF
 Full-text HTML