Jan Czerwinski1, Andreas Mayer2, Norbert Heeb3
1AFHB, Laboratory for IC-Engines and Exhaust Emission Control, University of Applied Sciences, 2500 Biel-Bienne, Switzerland
2TTM, Technik Thermische Machinen, Fohrhölzlistrasse 14b, 5443 Niederrohrdorf, Switzerland
3EMPA, Überlandstrasse 129, CH-8600 Dübendorf, Switzerland
Correspondence to: Jan Czerwinski, AFHB, Laboratory for IC-Engines and Exhaust Emission Control, University of Applied Sciences, 2500 Biel-Bienne, Switzerland.
| Email: |  |
Copyright © 2012 Scientific & Academic Publishing. All Rights Reserved.
Abstract
The combined exhaust gas aftertreatment systems (DPF+SCR) are the most efficient way and the best available technology (BAT) to radically reduce the critical Diesel emission components particles (PM&NP) and nitric oxides (NOx). SCR (selective catalytic reduction) is regarded as the most efficient deNOx-system, diesel particle filters are most efficient for soot abatement. Today, several suppliers offer combined systems for retrofitting of HD vehicles.Quality standards for those quite complex systems and especially for retrofit systems are needed to enable decisions of several authorities and to estimate the potentials of improvements of the air quality in highly populated agglomerations.The present paper informs about the VERTdePN *) quality test procedures, which were developed in an international network project with the same name (dePN … decontamination, disposal of PM / NP and of NOx) 2007-2011. Some interesting results of research on the engine dynamometer from the last test period 2011-2013 are given as a complement of the already published results.The objective to introduce the SCR-, or combined DPF+SCR-systems in the VERT verification procedure was accomplished.During the tests additionally to the regulated gaseous emissions several unregulated components such as NH3, NO2 and N2O were measured. The analysis of nanoparticle emissions was performed with SMPS and NanoMet.The most important statements are:•the procedures for the quality verification of SCR-, or (DPF+SCR) - systems are developed and confirmed,•these test procedures on HD-chassis dynamometer and on-road are useful for OEM- and for retrofit systems,•engine dynamometer testing enables the deepest insight in the investigated system concerning: secondary- and non-legislated emissions, variations of feed factor, analysis on different sampling positions and at specific engine operating conditions (like legal test procedures),•testing on HD-chassis dynamometer can partially replace the engine dynamometer depending on the possibilities of the installation,•testing of SCR-systems on vehicle is important, because of urea dosing, urea mixing and electronic control, •the filtration efficiency of a DPF is independent of the operating condition (except of regeneration period, or passing over the maximum space velocity),•the NOx reduction efficiency of SCR-systems is dependent on the operating conditions, because of the optimaltemperature window of the SCR-catalysis; at the conditions with exhaust temperature below 200°C the urea dosing is stopped.There is an intense further development of those aftertreatment systems and their electronic control, which opens further potentials of improvements.
Keywords:
SCR … Selective Catalytic Reduction, Quality Procedures, Retrofitting, DPF … Diesel Particle Filter
Cite this paper: Jan Czerwinski, Andreas Mayer, Norbert Heeb, Quality Test Procedures & Emissions with DPF+SCR Systems, Energy and Power, Vol. 4 No. 1A, 2014, pp. 11-31. doi: 10.5923/s.ep.201401.02.
1. Introduction & Objectives
The use of deNOx (especially SCR) systems and the combinations with DPF’s offer a large number of variants and technical complexity representing new challenges not only for the manufacturers, but also for the users and for the responsible authorities.Retrofit with those combined systems is quite challenging and it is possible, in general opinion, mostly through incentives, or restrictions with respect to low emission zones LEZ,[1] and regulations of the respective authorities.The Swiss Federal Office of Environment BAFU and the Swiss Federal Roads Office ASTRA decided to support the activities of VERT to develop appropriate testing procedures and to define the quality criteria of dePN systems.Laboratories for IC-Engines and Exhaust Emission Control of the University of Applied Sciences Biel, Switzerland (AFHB) participate since 1992 at the Swiss activities about nanoparticle analytics and DPF verification and since 2006 about the quality of SCR- and (DPF+SCR) - systems.The need of testing the SCR-systems together with vehicle became stronger and the supporting Federal Offices accorded a supplementary project TeVeNOx (Testing of Vehicles with NOx reduction systems). In this project 2012-2013 several HD vehicles with SCR (OEM and retrofit) were tested and the test methods on HD chassis dynamometer and on-road were confirmed.There is an intense research and development of SCR systems and their implementation,[2-13]. As effect significant reduction of the target emission parameters is possible.The objectives of this paper are to show the last state of the VERTdePN testing procedures and to represent some new findings from different research subjects on engine like:•results in different test cycles,•secondary nanoparticles,•comparison of different aftertreatment systems,•demonstration of NH3-storage,•cleaning of the system,•results at different steptests,•secondary emissions with Cu-Fe-zeolithes,•quality of a retrofit system after 1000 hours.
2. VERTdePN
A general objective of VERTdePN is to include the SCR-, or the combined DPF+SCR systems in the test procedures, which were previously developed for DPF retrofitting.
2.1. The Subjects & Procedures
For the VERT DPF quality procedure (SN 277206),[14] the research objectives are:•filtration quality•durability•control - & auxiliary systems•secondary emissions.The objectives for a SCR system in the VERTdePN tests are:•NOx reduction efficiency•NO2- and / or NH3- slip•emission of N2O•operating temperature window•dynamic operation•field application & durability•auxiliary systems•further secondary emissions.The main structure of VERTdePN tests for combined DPF-SCR is similar, as the preceding VERT activities for DPF.Fig. 1 shows the scheme of the product standard testing and the main performed subprojects.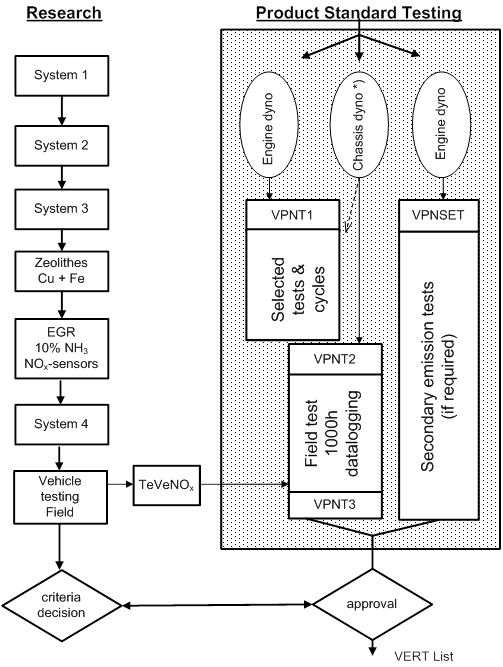 | Figure 1. VERTdePN Testing Procedure for DPF+SCR Combisystems Product Standard (DPF VERT certified) |
There are following test procedures:1) VERTdePN test 1 (VPNT1) on engine dynamometer, or on chassis dynamometer with equivalent measuring possibilities. VPNT1 contains stationary engine operation in step test, including load transitions and urea switch on & off. Additionally to the reduction efficiencies of NOx & NO2, the measurement of some non-legislated emission components is required. These components are: Ammonia NH3 and nitrous oxide N2O.If the tested DPF is not yet approved by VERT/OAPC, the measurements of nanoparticles and the estimate of PCFE are necessary.The demonstration of deNOx-efficiency at dynamic operation (ETC, WHTC, or FIGE) is recommended.2) VERTdePN Secondary Emissions Test (VPNSET) is applied, if necessary, to state, if there are any potentials of secondary emissions of dioxines and furanes, which are considered as particularly toxic.VPNSET needs for the analytics of traces a long and well controlled sampling procedure. For this purpose an ISO 8178 8-pts tests, including the load transitions is used. VPNSET can only be performed on engine dynamometer.3) VERTdePN Test 2 (VPNT2) is performed on vehicle. This is a preliminary control before field test and a real world durability test of 1000h, or 50’000 km.The preliminary control has to be performed on a HD chassis dynamometer at stationary OP’s with SWON & SWOFF and with exhaust gas measuring technics, which enable at least the estimate of the deNOx-rate (KNOX). Also the datalogging, which is prepared for the field test shall be applied and evaluated. The results of the preliminary control are reference values for the final control after field test (VPNT3).During the field operation a continuous datalogging of NOx-signals before and after system with periodical controls has to be performed. All results of controls, service & maintenance, or failures shall be documented in a log-book.4) VERTdePN Test 3 (VPNT3) is a repetition of the preliminary control of VPNT2 on the same chassis dynamometer, at the same operating conditions (OP’s & tamb) and with the same measuring apparatus, in order to demonstrate the system efficiency after the long run.These test procedures can be used to recognize a product standard and to recommend the retrofit systems to the users.The formal procedures of approval and the used criteria are to be decided by the implementing authority and are not a subject of this paper.From the technical points of view some flexibilities of implementing of these test procedures are possible in view of promotion of the retrofitting. This concerns first of all the acceptance of other tests, which were already performed by the manufacturer and which deliver similar information about the system.It is also to consider that the retrofitting can be done only for certain fleets, which are handled by specialized personal, which usually have their own quality control and do not need such rigorous OBD measures, like those introduced recently for OEM-SCR applications.For each retrofitted SCR-system, which is put into operation a simplified acceptance test on vehicle has to be performed. This test consists of checking the datalogger and the urea SWON & SWOFF during a short road trip and standstill.
2.2. Test Cycles
For the research on engine dynamometer different steady state test procedures can be used. The main objective is to have at least one urea switch-on (SWON) and at least one high load OP during the test.The first 4-pts test proposed for VPNT1 is represented in Fig. 2,[15].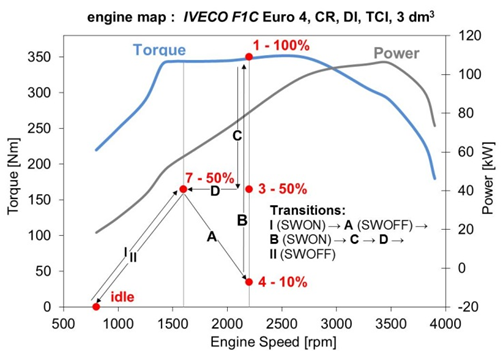 | Figure 2. Engine map of the IVECO F1C engine and 4-points test for SCR-investigations |
The four operating points were chosen in such way, that the switching “off” and “on” of the urea-dosing is included in the tests (pt. 7 → pt. 4 and pt. 4 → pt. 1).For basic research of SCR-systems a 6-pts test at constant engine speed was used, Fig. 3. This enabled the representation of results in function of exhaust gas temperature.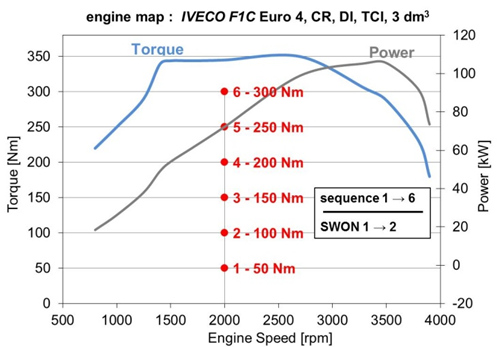 | Figure 3. Engine map of the IVECO F1C engine and 6-points steptest for SCR-investigations |
If the DPF of a combined system has also to be approved it is necessary to apply the OP’s according to the norm,[14]. This requirement leads to the 6-pts test, Fig. 4. In following the result of 4-pts test (Fig. 2) and 6-pts test (Fig. 4) will be compared.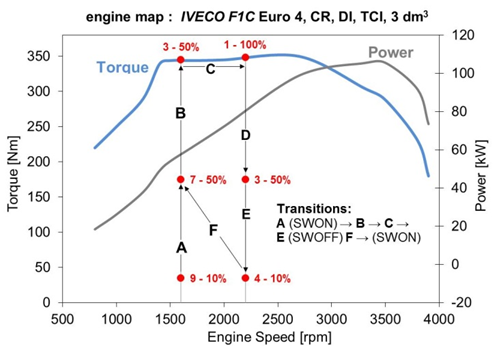 | Figure 4. Engine map of the IVECO F1C engine and 6-points test for DPF and SCR-investigations |
During the long-duration sampling for VPNSET the ISO 8178 8-pts test is used,[15]. The dynamic testing was started with the European Transient Cycle ETC and continued with the WHTC (worldwide heavy duty transient cycle), Fig. 5. Also two city-bus cycles: NYCC (New York City Cycle) and Braunschweig Bus Cycle were investigated. All these cycles were defined on the basis of the full (non-limited) engine map. They cause very different operating conditions of the engine, which is depicted with different profiles of exhaust gas temperatures at the tailpipe (Fig. 5, bottom).The tests were performed after a warm-up phase, when the engine coolant temperature and lube oil temperature reached their stationary values (stationary points tests).Before starting a dynamic cycle the same conditioning procedure was used to stabilize the thermal conditions of the exhaust gas aftertreatment system. This conditioning was: 5 min at point 1 (2200 rpm/FL) and 0.5 min of idling.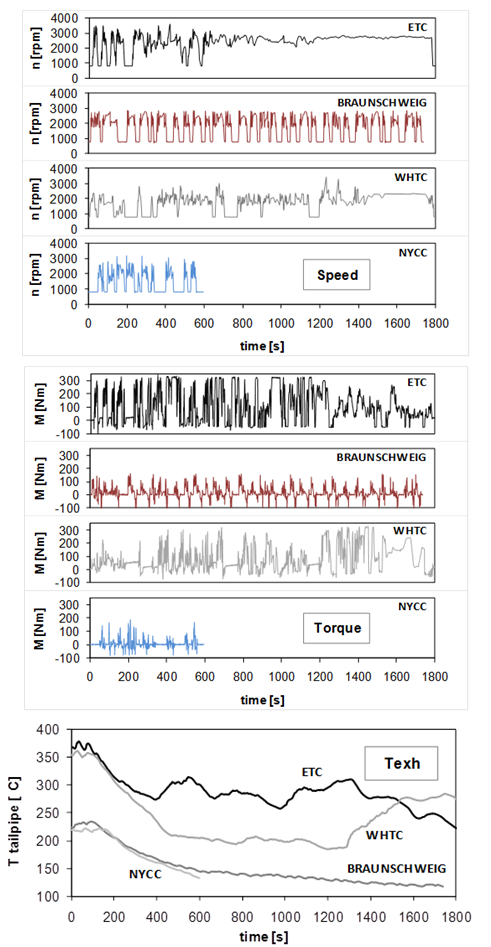 | Figure 5. Speed, torque and exhaust temperature in the investigated dynamic test cycles |
For the low-load cycles (NYCC and Braunschweig), the conditioning was: 5 min 1600 rpm / 165 Nm and 0,5 min idling.For the dynamic testing on engine dynamometer the European Transient Cycle (ETC) is mostly used, Fig. 5.All tests are performed in the warm state of the engine and of the exhaust system. As conditioning for a dynamic test cycle the same cycle is used. Different sampling positions (SP) were used to analyse exhaust compositions and temperatures in more detail (see Fig. 8): •SP 0 sampling engine out w/o aftertreatment system•SP 1 sampling engine out with aftertreatment system•SP 2 sampling after DPF (before urea dosing) with aftertreatment system•SP 3 sampling at tailpipe with aftertreatment system.This designation of sampling positions is used in the presented figures and in the discussion of results.Another useful procedure is the urea switch-on test (SW). This test consists of a warm-up of the engine in a low load operation point, without any urea injection, and then increasing the engine load in a controlled way to an engine load where urea injection starts.This quite simple procedure can be repeated during each warm-up of the engine and of the exhaust system. The SW-test can be joined with the OEM datalogging and it gives additional information on the extent of emissions and NOx reduction efficiency. The urea switch-on test is considered as a simple and reliable check of SCR quality on vehicles (chassis dynamometer).For the preliminary control on vehicle (VPNT2) and for the final control (VPNT3) a simple 2-pts test is used, Fig. 6.This test is easy to perform on a HD chassis dynamometer in a braking mode. The constant speeds in the range of 50 km/h and 80 km/h can be slightly adapted according to the best feasibility. The transition from idling to the OP1 provokes the increase of the exhaust temperatures and consequently urea switch-on (SWON), see Fig. 6. The transition from OP2 to idling can be used for retrofit systems as a repetitive switch-off (SWOFF).During the tests of VERTdePN and TeVeNOx several road tests were performed. These results and experiences are reported separately.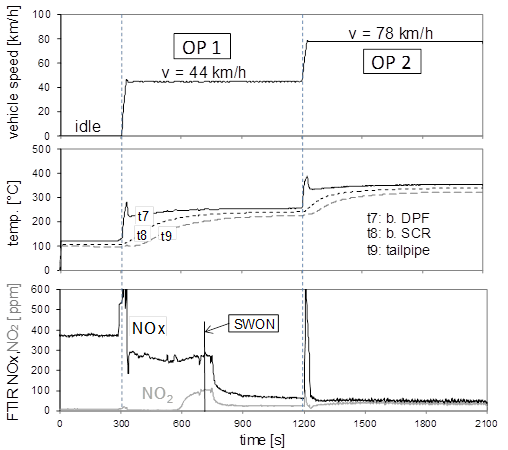 | Figure 6. 2-points test for SCR quality control on HD chassis dynamometer |
2.3. Previous Results
Following most important findings from previous VERTdePN activities,[15] are: •the investigated combined dePN systems (DPF+SCR) for dynamic engine application efficiently reduce the target emissions with deNOx-efficiencies up to 92% (if operated in the right temperature window) and particle number filtration efficiency up to 100%,•the particle number filtration efficiency, which is verified at stationary engine operation, is valid also at the transient operation,•the OEM NOx-sensors of the investigated systems are appropriate tools for the in-use control.
3. Tested Engine, Fuel, Lubricant
3.1. Test engine
Manufacturer: Iveco, Torino ItalyType: F1C Euro 3 / Euro 4Displacement: 3.00 LitersRPM: max. 4200 rpmRated power: 100 kW @ 3500 rpmModel: 4 cylinder in-lineCombustion process: direct injectionInjection system Bosch Common Rail 1600 barSupercharging: Turbocharger with intercoolingEmission control: noneDevelopment period: until 2000 (Euro 3)Fig. 7 shows the engine and the apparatus for nano-particle analytics SMPS & NanoMet in the laboratory for IC-engines, University of Applied Sciences, Biel-Bienne.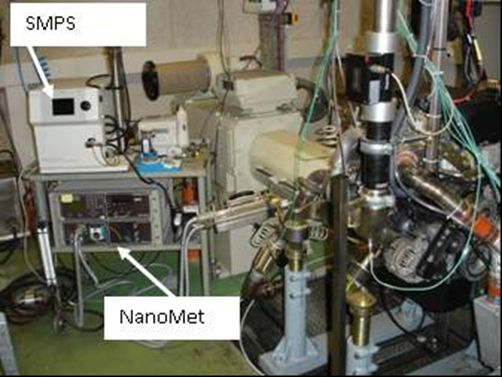 | Figure 7. IVECO engine F1C and equipment for nanoparticle measurements in the engine room |
3.2. Fuel
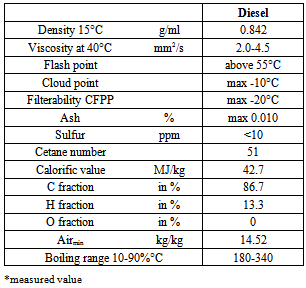
Following Diesel fuel was used for the research (Table 1):Table 1. Fuel properties as per EU-standards
 |
| |
|
•Shell Formula Diesel fuel Swiss market summer quality (10 ppm S) according to SN EN 590Table 1 represents the most important data of the fuel according to the standards.
3.3. Lubricant
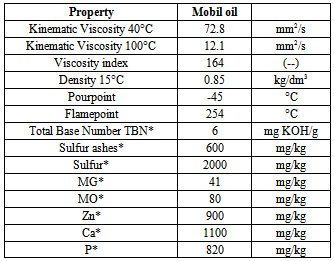
For all tests a special lubeoil Mobil 1 ESP Formula 5W-30 was used.Table 2 shows the available data of this oil, ACEA classes: C3, A3, B3/B4, API classes: SL / SM; CFTable 2. Data of the utilized oil (* analysis, others: specifications)
 |
| |
|
3.4. Engine Version Euro 4
In collaboration with the engine manufacturer the research engine version Euro 3 was upgraded to the version Euro 4. The new engine equipment consisted of:•EGR valve (high pressure EGR), (see sketch Fig. 8)•EGR cooler, •throttle valve at intake, •air mass flowmeter at intake,•injectors,•new engine calibration (ECU) for modifications of injection timing and injection mode (pre-/post- injections).The principal influences on engine combustion and emissions are given trough the:•HP EGR regulated continuously in the engine map,•further use of potentials of CR-injection system (pressure, timing, shaping, strategies).The EGR is regulated by means of simultaneous positioning of the EGR-valve and of the throttle valve with air mass flow as guiding parameter. The total injected fuel quantity is adapted to the air mass flow.The ECU-engine calibration is given in two versions: for HD- and for LD-application. In the present work only the HD-version was used.The research laboratory received access to the ECU with the possibility of switching on/off EGR.The engine version Euro 4 with EGR is shortly called E4 and the same version with EGR switched off is called E(4).
4. Measuring Set-up and Instrumentation
4.1. Engine Dynamometer and Standard Test Equipment
Fig. 8 represents the special systems installed on the engine, or in its periphery for analysis of the regulated and unregulated emissions.Laboratory equipment employed:•Dynamic test bench Kristl & Seibt with force transducer HBM T10F•Tornado Software Kristl & Seibt•Fuel flow measurement AIC 2022 •Air mass meter ABB Sensiflow P•Pressure transducers Keller KAA-2/8235, PD-4/8236•Thermo-couples Type K.
4.2. Test Equipment for Exhaust Gas Emissions
Measurement is performed according to the exhaust gas emissions regulations for heavy duty vehicles which are also in force in Switzerland (Directive 2005 / 55 / CE & ISO 8178):•Standard exhaust gas components:-Horiba exhaust gas measurement devices Type: VIA-510 for CO2, CO, HCIR, O2, Type: CLA-510 for NO, NOx (this standard hot analyser with one reactor is marked in this report as “1 CLD”)-Amluk exhaust gas measurement device Type: FID 2010 for HCFID,•NH3 and N2O: With SCR several unregulated and secondary pollutants can be produced. The slip of gaseous components such as ammonia NH3 and nitrous oxide N2O was measured by means of: -Siemens LDS 6 Laser Analyzer 7MB 6021, NH3 -Siemens ULTRAMAT 6E 7MB2121, N2O-Eco physics CLD 822 CM hr with hot line for NO,NO2, NO3, NH3 (this analyzer with two reactors is marked in this report as “2 CLD”)•FTIR (Fourier Transform Infrared) Spectrometer (AVL SESAM) with the possibility of simultaneous, time-resolved measurement of approximately 30 emission components – among those validated are: NO, NO2, NOx, NH3, N2O.
4.2.1. Particle Size Analysis
The particle size and number distributions were analysed with following apparatus, Fig. 7:•SMPS – Scanning Mobility Particle Sizer, TSI (DMA TSI 3071, CPC TSI 3025 A)•NanoMet – System consisting of:- PAS – Photoelectric Aerosol Sensor (EcoChem PAS 2000) indicates the carbonaceous total surface of the aerosol- DC – Diffusion Charging Sensor (Matter Eng. LQ1-DC) indicates the totale surface of the aerosol independently of the chemical properties- MD19 tunable minidiluter (Matter Eng. MD19-2E)The nanoparticle results represented in this paper are obtained with sampling at tail pipe with MD19 and with thermoconditioner (300°C). The nanoparticulate measurements were performed at constant engine speed (warm) with SMPS and NanoMet.During the dynamic engine operation NanoMet and CPC were used.
5. (DPF+SCR) Systems
A combined system consisting of a DPF upstream of the urea dosing point and a vanadium-based SCR catalyst downstream of the filter was used (as in Fig. 8).A mixing tube of 1.0m, without mixer was used between the DPF and SCR.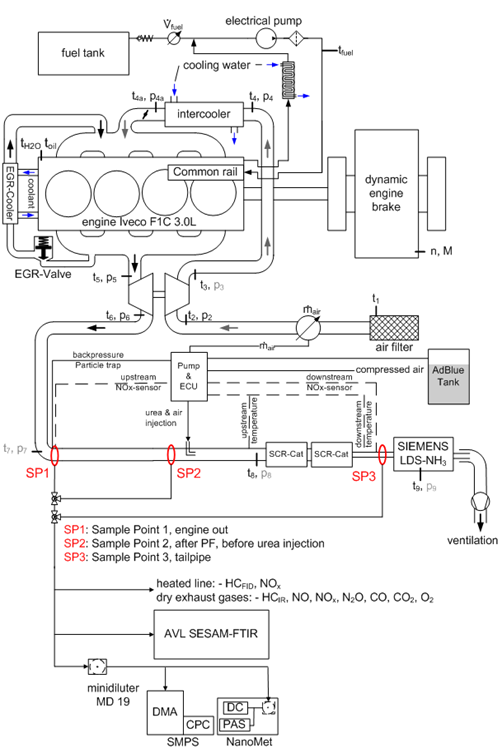 | Figure 8. Engine dynamometer and test equipment |
In certain experiments, an ammonia slip catalyst was used at the tail pipe. The combined DPF+SCR system is designed for transient application with an electronic control unit, using the signals of: air flow, NOx before/after system, and temperatures before/after the SCR catalyst.Following three variants were investigated:•PF1 + SCR•PF1 + SCR + slip cat.•PF3 + SCRPF1 is a catalytically coated Cordierite DPF, PF3 is a uncoated SiC DPF with FBC (40 ppm Fe, double dosing for testing purposes).Both DPF’s are VERT-approved with average NP filtration efficiencies FE > 99%.A feed factor of α= 0.9 was generally used (during investigations on secondary nanoparticles in Fig. 11 & 12 a feed factor α = 1.0 was applied).
6. Results
Following the results of some specific research subjects, which may complete or enlarge the present state of knowledge, will be shortly presented.
6.1. Different Test Cycles
Tests were performed with different driving cycles with non limited engine map (NEM).The exhaust temperatures at the tailpipe over cycle time for all investigated test cycles are given in Fig. 5 together with engine speed and torque.Fig. 9 summarizes average exhaust concentrations for the different test cycles and Fig. 10 shows the conversion efficiencies in different driving cycles.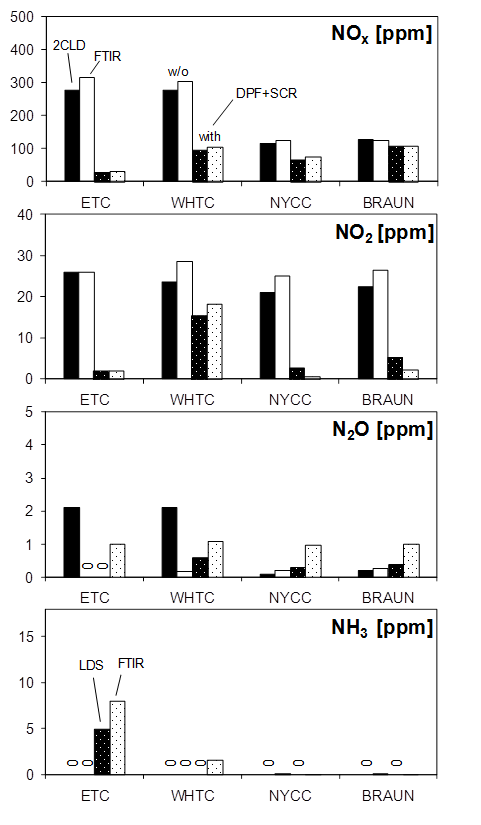 | Figure 9. Integral average emission values in dynamic cycles, PF1+SCR, α=0.9 |
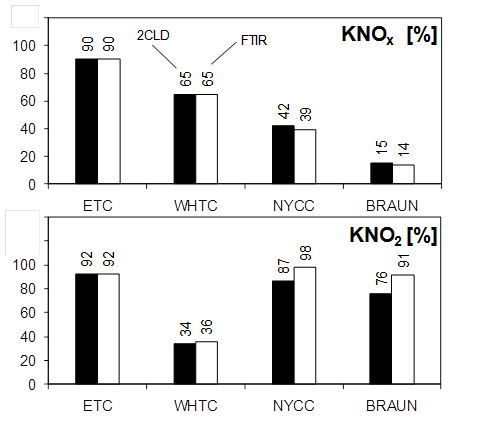 | Figure 10. Comparison of reduction efficiencies in dynamic cycles, PF1+SCR, α=0.9 |
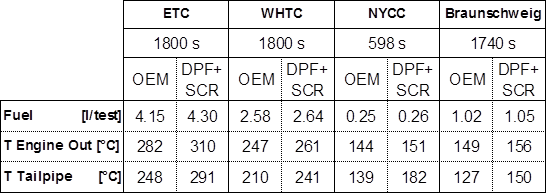
In Table 3 the fuel consumption and the average exhaust temperatures in all driving cycles are represented.Table 3. Fuel consumption and average exhaust temperatures in different driving cycles, PF1+SCR, α=0.9
 |
| |
|
The New York City Cycle (NYCC) and the Braunschweig cycle (BRAUN) are low-load cycles, which were developed in those cities and represent the city bus driving.Exhaust temperatures in these low load cycles are too low (< 200°C) to enable the full working potential of the SCR-system. The urea injection is usually cut off at texh 190-200°C to prevent the deposition of solid matter in the system. Average NOx emissions in the low load cycles are lower too, but there is also a poor NOx-conversion due to the urea dosing strategy.N2O emissions are generally very low (< 2 ppm) and NH3 was found only in ETC with SCR NH3 but its concentrations are typically < 8 ppm at urea feed factors of 0.9.Comparing different measuring techniques as shown in Figures 9 & 10one can conclude:•good correlation of NOx & NO2 measured with FTIR and with two CLD,•good correlation of NH3 measured with FTIR and with LDS,•poor correlation of N2O measured with FTIR and with ULTRAMAT; This is the case, because N2O concen-trations are low – mostly at the detection limits of the analytical devices,•the relative values, like conversion efficiencies Kx are well correlated with all measuring methods.These conclusions are supported from several other internal investigations not presented in this paper.Finally we conclude that the investigated SCR-system has low NOx conversion efficiencies of 40 and 15% in both low-load city driving cycles. This has been observed before, when comparing the NOx emissions of the high-load-ETC (non-limited engine map NEM) with those in the low-load-ETC (limited engine map LEM[15]).
6.2. Secondary Nanoparticles
The production of secondary nanoparticles downstream of the urea dosing point was noticed earlier[15]. Such nanoparticles are possibly formed during the deNOx process. The chemical composition of these particles is yet unknown and further investigations are on the way. They may consist of unreacted urea or derivatives thereof such as cyanuric acid, or salts from acidic and basic compounds such as ammonium nitrite, nitrate, and sulfates and others.In the present status of these investigations, the objective was to systematically study the number and particle size of these secondary NP by means of PM, SMPS and NanoMet at sampling positions SP2 & SP3, (SP2 ... after DPF & before urea dosing, SP3 ... after SCR).SMPS measurements after the DPF (SP2) and after the SCR (SP3) confirmed the presence of secondary nanoparticles in all load stages of the 4-points test.Fig. 11 shows an example of the SMPS size distributions and the integrated particle number in different parts of the size spectra at 2200 rpm / 50%. The increase of particle mass emissions between SP2 and SP3 as a result of a secondary particles formation was noticed as well.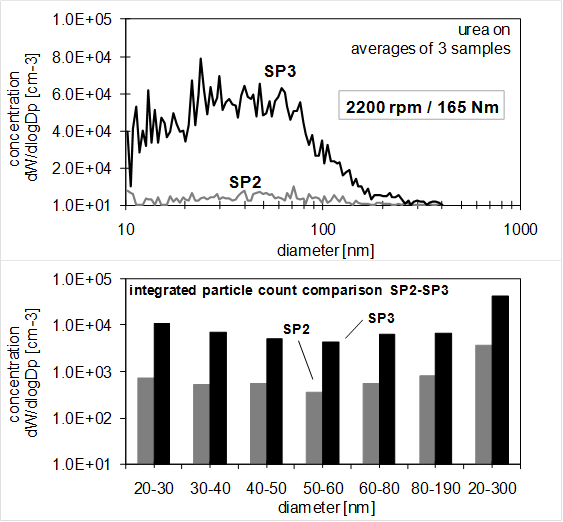 | Figure 11. SMPS-size spectra at SP2 & SP3, PF1+SCR, α=1.0 |
Fig. 12 represents the particle mass PM, the mass-related filtration-efficiency PMFE and the particle number related filtration efficiency PCFE in all operating points and at all sampling positions SP0, SP2 & SP3. At two OP’s, there is a little, but consistent increase of PM between SP2 and SP3. This causes a significant reduction of PMFE, but no significant reduction of PCFE. This indicates that these secondary particles mainly contribute to particle mass but not much to particle numbers.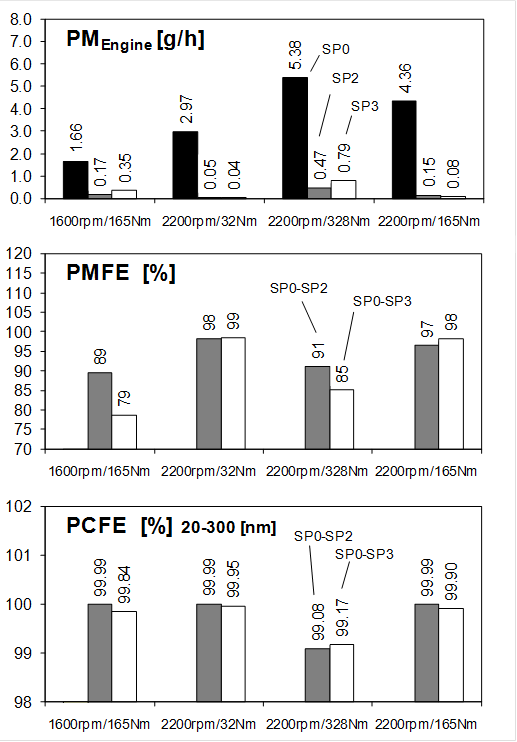 | Figure 12. Particle mass and counts reduction in the 4 points test, PF1+SCR, α=1.00 |
It can be summarized that the presence of secondary nanoparticles after the SCR-system was confirmed. In some cases, secondary NP contribute to an increase of the particle mass.
6.3. Comparisons of Different Aftertreatment Systems
Fig. 13 represents the conversion efficiencies of regulated gaseous components with the investigated aftertreatment systems in the 4- points test.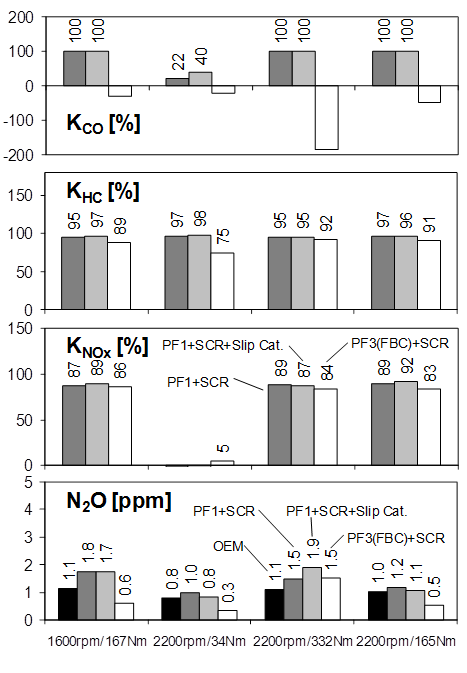 | Figure 13. Conversion efficiencies of regulated pollutants and N2O in the 4-points test with different DPF+SCR systems |
With uncatalysed PF3, negative CO conversion efficiencies were noticed, mostly at the highest OP, with the highest backpressure. HC is also converted in a vanadium-based SCR-catalyst, and there are as high conversion efficiencies KHC in combination with the PF3 system (FBC).NOx is not reduced at the lowest OP due to urea switch-off. At higher OP’s, with acitve SCR catalyst, there is a tendency of slightly lower KNOX-values with the fuel-borne catalyzed PF3. The principal reason is the lower NO2 concentration after this filter.Emissions of nitrous oxide N2O are very low (< 2 ppm) and deviate less than 1 ppm from values without aftertreatment (OEM).Emissions of ammonia NH3 are not represented, since they are generally at zero level, except of one value (10 ppm) for the PF1 (cat.) + SCR at the highest OP (2200 rpm / 332 Nm).Fig. 14 compares the different exhaust aftertreatment systems in the steps-test at 2200 rpm. Following effects were observed:• reduction of NOx at texh ≥ 190℃,• emission of NO2 increase with PF1 (cat) in the texh range 240-340℃• emission of NH3 increase up to 8 ppm with PF3 in the texh range 240-340℃• emission of NH3 increase up to 10 ppm with PF1 in the texh range < 390℃• NOx conversion starts at slightly lower texh ,with PF1 than with the fuel-borne catalyzed PF3 (Δt ≈ 10-15℃),• similar maximum conversion efficiencies KNOX were found for both systems.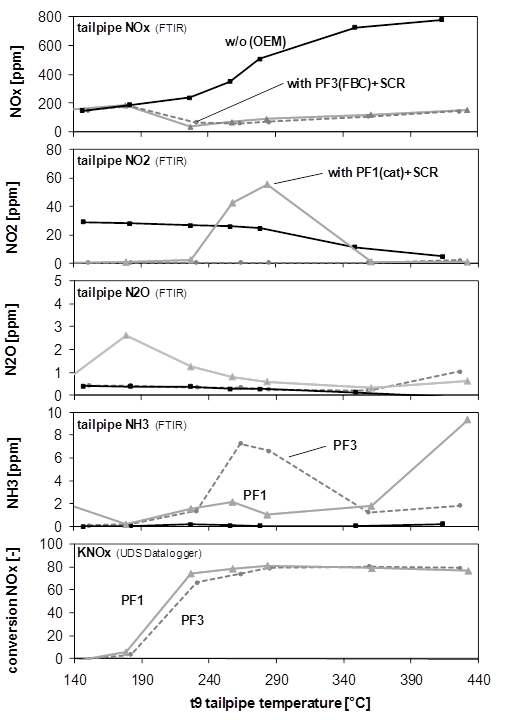 | Figure 14. Reference - PF1(cat.)+SCR - PF3(FBC)+SCR, 60s average values of stationary operating |
6.4. Demonstration of NH3-storage
For the electronic control of AdBlue dosing of SCR systems several physico-chemical processes have to be considered, like: Ad-Blue mixture preparation, transformation of AdBlue in Ammonia (thermolysis & hydrolysis) and store /release of Ammonia in the SCR-catalyst. The best AdBlue dosing is reached, when with the variable engine-out NOx emissions in the engine map and also in transient engine operation the maximum NOx conversion rates with possible no NH3-slip are reached.The effects of NH3-storage were studied and an example of the most significant results is represented here. Fig. 15 shows urea switching on and off at constant low-load OP 2200 rpm / 80 Nm. The objective was to leave enough time to stabilize the emissions after urea switch on (SWON). The diagram represents 1 hour run.In the short time (approximate 20s) after SW on there is a “quick” reduction of approximate ¾ of initial NOx and totality of NO2. NO2 supports the quicker deNOx-reactions and from the instant, when NO2 is consumed the further NOx-reduction slows down – the last quarter of NOx-reduction takes the time “t2” (approximate 13.3 min).After the time “t1” (approximate 7.5 min) NH3 starts to increase. It is no more totally needed for deNOx-reactions, part of it is stored in the SCR-catalyst, part of NH3 is available for the negligible production of Formic Acid and the rest is emitted. It can be assumed that after time “t3” (approximate 32 min), when the NH3-emission level stabilizes, the storage capacity is filled out.The increase of NOx- and NO2- concentrations (CLD) after time “t2” is due to the presence of NH3 and to the crossensitivity of CLD against NH3.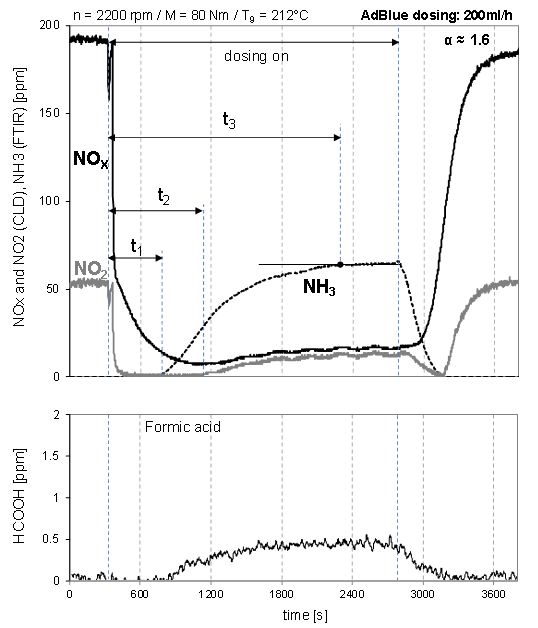 | Figure 15. Urea dosing SWON & SWOFF at low-load OP. DPF & SCR-catalyst, AdBlue ; IVECO F1C, E(4), ULSD |
Some tests were performed, when after NH3-storage period and after SWOFF at lower OP1 (80 Nm) time was left to stabilize the emission and after that a load jump to the higher OP2 (250 Nm) was performed, still without RAI (see Fig. 16). This provoked a sudden increase of NOx-emissions, but due to the increasing temperature and some release of NH3 there is a break-down of NOx-emissions during certain time period after the maximum of NOx, Fig. 16. This was a clear and repetitive demonstration of NH3-release. Similar tests were performed without previous urea dosing and consequently without NH3-storage.Fig. 16 shows NOx-emission at load-jump with and without NH3-release. The lower NOx-values are an effect of NH3-release. This is particularly visible, when there is significant increase of exhaust temperature. When the temperature starts to stabilize, the NH3-release stops.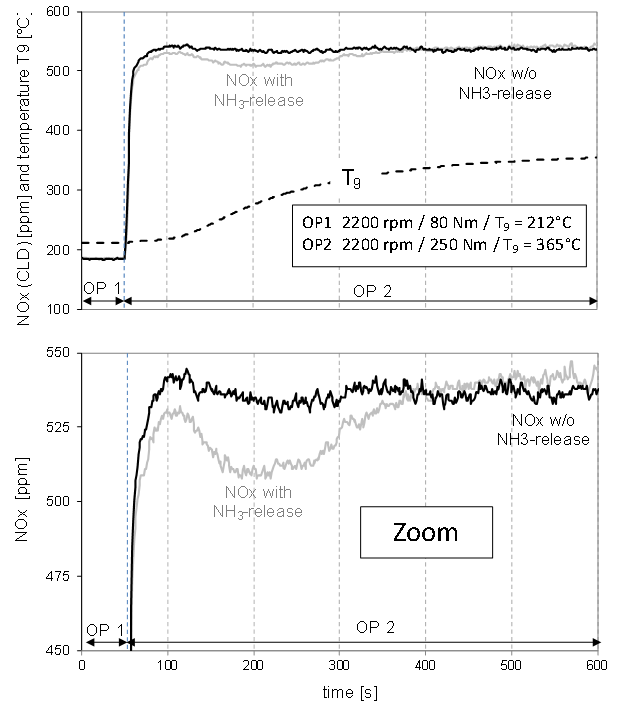 | Figure 16. Ammonia storage: NOx at load-jump with / without NH3-release. DPF & SCR-catalyst, AdBlue dosing off; IVECO F1C, E(4), ULSD |
6.5. Cleaning of the System
Dependent on temperature different solid residues can be created from the injected urea. According to[16] these are: 130-230°C crystals of Urea & Biuret200-350°C Cyanuric Acid200-450°C Ammelid, Ammelin, Melanin Urea crystallization typically takes place at low temperatures. If there is insufficient mixture preparation and wall wetting, than it is very likely that crystallization happens. The activation of RAI at 200°C is first of all to prevent the crystallization at lower temperature.At higher temperatures other residues can be created. Some of them can be melted and evaporated and take part on the chemical reactions. Some others are difficult to remove even at high temperatures.In a research work on one of the investigated SCR-systems different dosings (and also overdosings) of AdBlue happened. In the following 4-pts test exceptionally high peak values of some unregulated emissions resulted (Formaldehyde, Hydrocyanic Acid and Isocyanic Acid).After “cleaning” of the system – heating up at full load during ½ hour, without urea dosing – the test was repeated.Fig. 17 shows the results: after cleaning there are no significant emissions of the critical components.The cleaning is recommended at the beginning of every basic test on the engine dynamometer.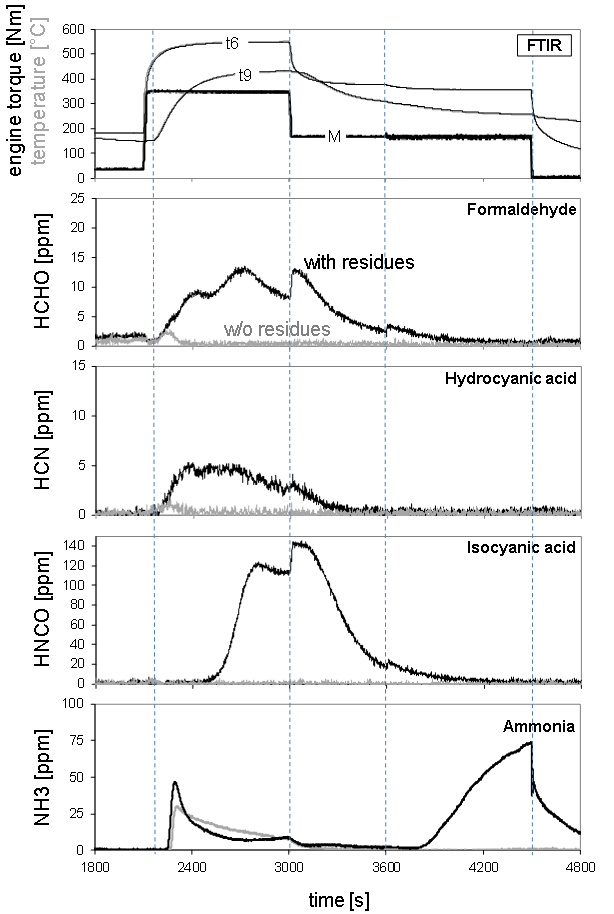 | Figure 17. Comparison of Unregulated Emissions in 4 Pts-TEST with & without residues, SCR with AdBlue Injection, Iveco F1C E(4); ULSD |
6.6. Results at Different Steps Tests
The validation of KNOX in 4-pts or in 6-pts test is represented in Fig. 18.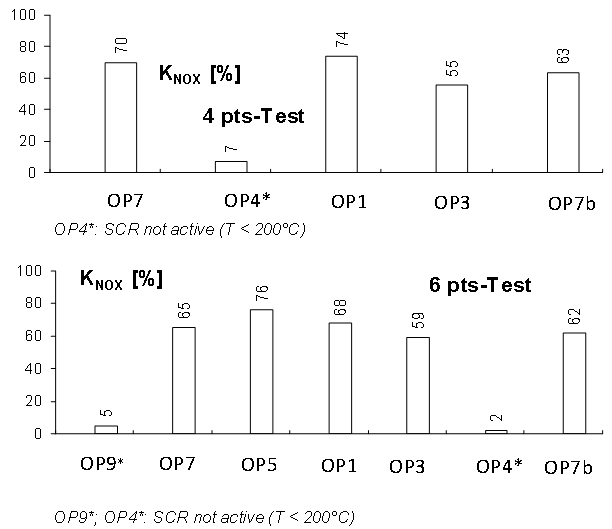 | Figure 18. Validation of the NOx-reduction rate in 4-points- and in 6-points test |
At low-load OP’s with deactivated RAI the NOx reduction rate is near to zero. At higher OP’s the full efficiency is attained.Principally there is no difference for the validation to apply any of those steps tests. For reasons of comparability it is recommended to always use the same test schedule for the same tested system.In this schedule the same duration of “cleaning” and the same sequence and duration of the load steps should be applied.
6.7. Secondary Emissions with Cu- & Fe-zeolithes
Secondary emissions and traces are investigated as a part of VERT / LRV quality verification procedure for DPF- and SCR-systems. The sampling and analytics are performed by a specialized team of EMPA Analytical Laboratory for Organic Chemistry. There are 3 groups of secondary emissions, which are known as very carcinogen and toxic:-Polycyclic Aromatic Hydrocarbons PAH, 12 substances *),[µg/L],-Nitro-PAH, 22 substances *),[µg/L],-Polychlorinated Dibenzodioxins PCDD and Polychlorinated Dibenzofurans PCDF, 33 substances *),[pg/L],VERT Secondary Emissions Tests were performed with urea based SCR systems (without DPF).One of the systems used a Cu-zeolithe and the other one a Fe-zeolithe as SCR-catalyst.Samples were taken continuously proportional to the actual gas flow (aliquot) from the undiluted hot exhaust gas. A volume of typically 5-8 Nm3 was collected through a validated sampling arrangement over 200 Minutes driving cycle time (2 full ISO 8178/4 C1-cycles).The sampling device consists of a sampling sonde, cooler, condensate separator, filter stage and two-stage adsorber unit (XAD-2). The sampling apparatus, made from glass is extensively cleaned and heated to high temperatures prior to each sampling (heating in steps up to 450°C). Using marked PCDD-standards in this investigation the recovery was found to be 65 + 10 %. The same sample was used to determine the PCDD/F as well as the PAH.PCDD/F-analysis was performed by separating the toxicologically relevant PCDD/F isomers using gas chromatography followed by high resolution mass spectrometry. After chromatographic work-up quantitative analysis of the PAH and Nitro-PAH were also performed using capillary gas chromatography high resolution mass spectrometry.
6.8. PCDD/F-Analysis
The following graph, Figure 19, shows the overall results.PCDD/F emissions (TEQ sum) of the engine accounted for 80±40 pg-TEQ/L with reference fuel (best case) and 90±50 pg-TEQ/L with chlorine-doped fuel (worst case). As shown in Fig. 19, PCDD/F emissions of configurations with iron- and copper-zeolites are at or below respective engine-out emissions. Even under worst case conditions, when using chlorine-doped fuels, no substantial increase of the PCDD/F emissions was noticed.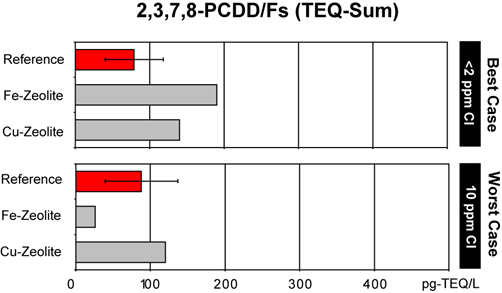 | Figure 19. Emission factors for the weighted sum of 2,3,7,8-substituted PCDD/Fs (TEQ sum) in pg/L. Emissions of iron- and copper-zeolites are compared with engine-out emissions (reference) for fuels with chlorine levels of <2 and 10 μg/g |
6.9. PAH-Analysis
PAH were analysed from the same sample as the PCDD/F.The following graph, Fig. 20, summarizing the data for the carcinogenic PAH according to the IARC-definition shows the overall results. The analysis of the broad class of polycyclic aromatic hydrocarbons (PAHs) was limited to those 4- to 7-ring PAHs, which are rated to be carcinogenic to humans by the US EPA. Among these compounds, we quantified emissions of benzo(a)an-thracene, benzo(b)fluoranthene, benzo(k)fluoran-thene, benzo(a)pyrene, di-benzo(a,h) anthracene, indeno (1,2,3-c,d)pyrene, and chrysene.Fig. 20 illustrates the effects on genotoxic PAH emissions when applying both deNOx systems. Compared to the reference configurations, the iron-zeolite reduced the emissions of carcinogenic PAHs by about 70%, whereas the copper-zeolite did not convert these PAHs. The chlorine-doped fuel had no substantial effects on emissions of these PAHs.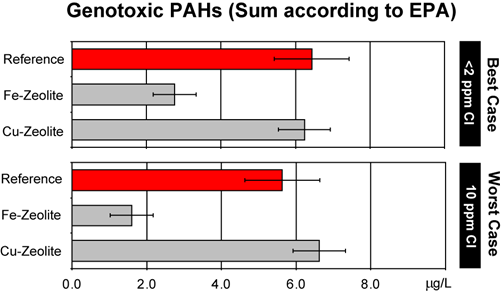 | Figure 20. Emission factors for the sum of carcinogenic PAHs (EPA) in µg/L. Emissions of iron- and copper-exchanged zeolites are compared with engine-out emissions (reference) for fuels with chlorine levels of <2 and 10 μg/g |
6.10. Quality of a Retrofit System after 1000h
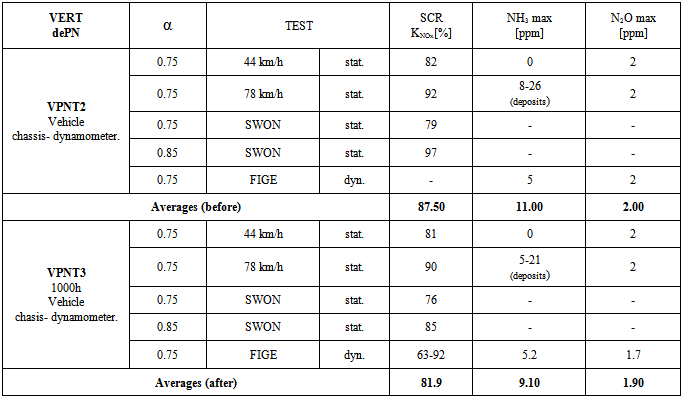
DPF+SCR) system retrofitted on bus was measured on a HD chassis dynamometer before and after the durability test of 1000h road application. Table 4 summarizes the most important results: there is a negligible reduction of the deNOx-efficiency and there are no significant secondary emissions of NH3 & N2O. It can be stated, that there is no deterioration of the SCR-system after 1000h. The used DPF was VERT/OAPC approved and always had the excellent particle counts filtration efficiency of 99.6%.Table 4. Efficiency and non-regulated emissions of a retrofit VSCR system before and after 1000h field test; overall average PCFE = 99.6%
 |
| |
|
7. Conclusions
Following conclusions can be pointed out:VERTdePN•the procedures for the quality verification of SCR-, or (DPF+SCR) - systems are developed and confirmed,•these test procedures on HD-chassis dynamometer and on-road are useful for OEM- and for retrofit systems,•engine dynamometer testing enables the deepest insight in the investigated system concerning: secondary - and non-legislated emissions, variations of feed factor, analysis on different sampling positions and at specific engine operating conditions (like legal test procedures),•testing on HD-chassis dynamometer can partially replace the engine dynamometer depending on the pos-sibilities of the installation,•testing of SCR-systems on vehicle is important, because of urea dosing, urea mixing and electronic control,•the filtration efficiency of a DPF is independent of the operating condition (except of regeneration period, or passing over the maximum space velocity),•the NOx reduction efficiency of SCR-systems is dependent on the operating conditions, because of the optimal temperature window of the SCR-catalysis; at the conditions with exhaust temperature below 200°C the urea dosing is stopped.
7.1. Different test cycles
•in the low-load transient cycles (NYCC & Braun schweig), there are rather low NOx conversion efficiencies due to low exhaust gas temperatures and limited urea dosing,•the SCR-systems in the tested configuration has moderate deNOx efficiencies at low-load city driving, but substantial deNOx efficiencies were found at higher engine loads e.g. at highway conditions,•the average NOx conversion rate at transient operation strongly depends on the operation load profile, on the exhaust gas temperature and the resulting urea dosing control.
7.2. Secondary Nanoparticles
•secondary nanoparticles are produced due to urea injection, they nevertheless do not impact significantly the overall filtration efficiency of the system (here: DPF upstream & SCR downstream, differences of PCFE in the range of 0.1%).
7.3. Different Aftertreatment Systems
•the system with catalyzed DPF (upstream) attains slightly higher overall deNOx-efficiencies due to NO2-production in the DPF,•for the investigated systems there are no critical emissions of unregulated components, NH3 & N2O.
7.4. NH3-storage
•at low-load OP1 with RAI there is a storage of NH3 in the SCR catalyst,•after load increase to OP2 there is NH3 release due to the increasing exhaust temperature; this release is indicated by transitory NOx-reduction effect without RAI.
7.5. Testing
• cleaning of the SCR-system from the possible residues (FL w/o RAI) is recommended at the beginning of test on the engine dynamometer,• it is possible to use different stationary steps tests – for reasons of comparability it is recommended to always use the same test schedule for the same tested system,• there were no significant secondary emissions of traces (PCDD/F), or genotoxic PAHs with all investigated SCR-catalysts (V, Cu & Fe),• an excellent quality of a retrofitted VSCR-system after 1000h durability test was confirmed.
ACKNOWLEDGEMENTS
The authors want to express their gratitude for the financial support and realisation of the project to the: •Swiss Federal Office of Environment BAFU, Mr. D. Zürcher•Swiss Federal Office for Roads ASTRA, Mr. Th. Gasser•Swiss Occupational Insurance SUVA, Mrs. I. Schärli Further thanks are expressed to:•IVECO Switzerland for the research engine and help with engine setting Mr. M. Signer, Mr. E. Mathis, Mr. R. Zellweger
Abbreviations
AEEDA Association Européenne d’Experts en Dépollution des Automobiles, BelgiumAFHB
 Abgasprüfstelle FH Biel, CHAir min
 stoichiometric air requirementASTRA
 Amt für Strassen, CH, Swiss Federal Office of RoadsBAFU
 Bundesamt für Umwelt, CH (Swiss EPA, see FOEN)BAT
 best available technologyBRAUN
 Braunschweig test cycleCDI
 Common Rail Diesel InjectionCFPP
 cold filter plugging pointCLD
 chemoluminescence detectorCNC
 condensation nuclei counterCPC
 condensation particle counterCPK
 supplier of datalogging equipmentCR
 common railDC
 Diffusion Charging SensordePN
 de Particles + deNOxDI
 Direct InjectionDMA
 differential mobility analyzerDPF
 Diesel Particle FilterECU
 electronic control unitEGR
 exhaust gas recirculationEMPA
 Eidgenössische Material Prüfund Forschungsanstalt (Swiss Federal Laboratories for Testing & Research)EPA
 Environmental Protection AgencyETC
 European Transient CycleFBC
 Fuel born catalystFE
 filtration efficiencyFID
 flame ionization detectorFIGE
 a non-standardized vehicle version of ETC, created by Forschungsinstitut für Geräusche und ErschütterungenFL
 full loadFOEN
 Federal Office of Environment (BAFU)FTIR
 Fourrier Transform Infrared SpectrometerHD
 heavy dutyHP
 high pressureIARC
 International Association of Research on CancerKNOx
 NOx reduction rateLD
 low dutyLDS
 Laser Diode Spectrometer (for NH3)LEZ
 low emission zonesLRV
 Luftreinhalteverordnung (see OAPC)ME
 Matter EngineeringMD19
 heated minidiluterNanoMet
 NanoMetnanoparticle summary surface analyser (PAS + DC + MD19) PAS + DC + sampling & dilution unitNP
 nanoparticles < 999 nm (SMPS range)NYCC
 New York City CycleOAPC
 Swiss Ordinance on Air Pollution Control (LRV)OBD
 on-board diagnosticsOEM
 original equipment manufacturerOP
 operating pointPAH
 polycylic aromatic hydrocarbonsPAS
 Photoelectric Aerosol SensorPC
 particle countsPCDD/F
 polychlorinated dibenzodioxines & furanesPCFE
 particle counts filtration efficiencyPM
 particulate matter, particle massPMFE
 particle mass filtration efficiencyPSD
 particle size distributionRAI
 reduction agent injectionSCR
 selective catalytic reductionSMPS
 Scanning Mobility Particle SizerSP
 sampling positionSUVA
 Schweiz. Unfallversicherungs-Anstalt (Swiss Occupational Insurance)SW
 urea switch on/ofSWON
 urea switch onSWOFF
 urea switch offTC
 thermoconditioner.TCI
 turbocharging & intercoolingTeVeNOx
 Testing of Vehicles with NOx reduction systemsTEQ
 toxicity equivalenceTTM
 Technik Thermische MaschinenULSD
 ultra low sulfur DieselVERT
 Verminderung der Emissionen von Realmaschinen in Tunelbau Verification of Emission Reduction TechnologyVERTdePN
 VERT DPF + VERT deNOxVPNT1
 VERTdePN Test 1VPNT2
 VERTdePN Test 2 - field durability 1000hVPNT3
 VERTdePN Test 3 - check after field test chassis dynamometerVPNSET
 VERTdePN secondary emissions test - engine dynamometerVSCR
 Vanadium-based SCRVSET
 VERT Secondary Emissions TestWHTC
 worldwide HD transient cycleα
 feed factor of urea dosing;
 ratio: urea injected / urea stoichiometric; calculated by the ECU.
References
| [1] | www.lowemissionzones.eu |
| [2] | Jacob, E.; Müller, R.; Scheeder, A.; Cartus, T.; Dreisbach, R.; Mai, H.-P.; Paulus, M.; Spengler, J.: High Performance SCR Catalyst System: Elements to Guarantee the Lowest Emissions of NOx. 27. |
| [3] | Cartus, T.; Schüssler, M.; Herrmuth, H.; Giovanella, M.: SCR and DPF – From Concept to Production. Mastering Complex, Mutli-Dimensional Challenges. 28. Intern. Wiener Motorensymposium 2007. Bd.1. |
| [4] | Pischinger, S.; Körfer, T.; Wiartalla, A.; Schnitzler, J.; Tomazic, D.; Tatur, M.: Combined Particulate Matter and NOx Aftertreatment Systems for Stringent Emission Standards. SAE Techn. Paper 2007-01-1128. |
| [5] | Hosoya, M.; Kawada, Y.; Sato, S.; Shimoda, M.: The Study of NOx and PM Reduction Using Urea Selective Catalytic Reduction System for Heavy Duty Diesel Engine. SAE Techn. Paper 2007-01-1576. |
| [6] | Lopez, M.: HDD On- & Off-Road SCR Systems – Euro 6/Stage IV and Beyond. International CTI Conference “SCR Systems”, Munich, D, July 2012. |
| [7] | Folic, M.: Combined Systems Relying on SCR for Efficient DeNOx: Results and Prospects. International CTI Conference “SCR Systems”, Munich, D, July ‘12. |
| [8] | Robb, L.; Görsmann, C.: Retrofit SCRT System with Optimised Secondary Emissions. International CTI Conference “SCR Systems”, Munich, D, July 2012. |
| [9] | Müller-Hass, K.; Holz, O.: High-Performance SCR Technology with Ultra-Low NOx Emissions for Future Regulations. International CTI Conference “Emission Reduction for Off-Highway Applications”, Lindau, D, Sept. 2012. |
| [10] | Larsen, L. Ch.: Development of a Future Complete Exhaust System Solution including a SCR-F based on High Porous Silicon Carbide Filter Substrates. International CTI Conference “Emission Reduction for Off-Highway Applications”, Lindau, D, Sept. 2012. |
| [11] | Zimmermann, F. P.: SCR Technologies in Comparison: A detailed Investigation of the Influence of Feed Gas Composition on NOx Conversion Comparing Three Series SCR Technologies. 3. VDI-Fachkonferenz“Abgasnachbehandlungssysteme 2012” Stuttgart, D, Dec. 2012. |
| [12] | Balenovic, M.: Stretching the Challenge for SCR Based Aftertreatment Systems. 3. VDI-Fachkonferenz “Abgas- nachbehandlungssysteme 2012” Stuttgart, D, Dec. 2012. |
| [13] | Görsmann, C.; Rawson, S; Robb, L.; Taylor, M.: Retrofit-SCRT®-System with Minimised Sekondary Emissions (NH3, NO2, N2O). 10th FAD Conference, Dresden, Nov. 2012. |
| [14] | Testing particle filter systems for internal combustion engines. Swiss Norm SNR 277 205, Sept. 2007, final version SN277206, Feb. 2011. |
| [15] | Czerwinski, J.; Zimmerli, Y.; Mayer, A.; Heeb, N.; Lemaire, J.; D’Urbano, G.; Bunge, R.: Testing of Combined DPF+SCR Systems for HD-retrofitting – VERTdePN. SAE technical Paper 2009-01-0284, Detroit April 2009. |
| [16] | Dorenkamp,R.; Hadler,J.; Rudolph, F.; Bühren, F.; Düsterdiek, Th.; Gehrke, V.; Kösters,M.; Kuiken, S. R.; Schütte, Th.: The New 2,0I TDI-Engine from Volkswagen to master Lowest Emissionsstandards in Europe. 17. Aachener Kolloquium Fahrzeug- und Motorentechnik 2008, p.1197. |
 Abstract
 Reference
 Full-Text PDF
 Full-text HTML