Andreas Mayer1, Markus Kasper2, Jan Czerwinski3
1TTM, Technik Thermische Machinen, Fohrhölzlistrasse 14b, 5443 Niederrohrdorf, Switzerland
2VERT Association, 5400 Brugg, Switzerland
3AFHB, Laboratory for IC-Engines and Exhaust Emission Control, University of Applied Sciences, 2500 Biel-Bienne, Switzerland
Correspondence to: Jan Czerwinski, AFHB, Laboratory for IC-Engines and Exhaust Emission Control, University of Applied Sciences, 2500 Biel-Bienne, Switzerland.
| Email: |  |
Copyright © 2012 Scientific & Academic Publishing. All Rights Reserved.
Abstract
Investigations of emissions from three modern HD vehicles (HDV) were carried out on a chassis-dynamometer. One of the vehicles uses PM-Kat and is certified according to EURO4. The second one is EURO5 compliant and uses SCR. The third one is was a EURO3 HDV, which was tested with and without VERT-certified DPF. The investigation focussed on solid particles in the mobility size range of 10-400nm. The instruments were SMPS, NanoMet, PASS and ELPI. Sampling conformed to PMP for SMPS and NanoMet, PASS and ELPI were used with FPS-dilution. Metallic emissions were measured using ICP-MS. Also measured were inherent secondary emissions, especially NO2 and NH3. Compared to EURO3 without DPF a moderate curtailment of nanoparticle emissions was observed for the majority of operating points for EURO4 with PM-Kat and EURO5 with SCR. However, at full load the EURO5 engine emitted higher concentrations than a EURO3 engine without DPF. A stochastic particle release was observed from the PM-Kat of the EURO4 engine. Its penetration scatter was very much dependant on the soot burden and the testing history. Compared to a EURO3 engine with a DPF conforming to VERT criteria, both modern engines EURO4 and EURO5 emitted 100-500 times more nanoparticles. Very good results of the gaseous emissions – a significant reduction of NOx – showed the EURO5 engine. There were no deleterious effects observed due to the SCR. The concentrations of NH3 and N2O remained close to the detection limit. However, the EURO4 engine emitted rather high concentrations of NO2 at about half load range. Emissions of Vanadium with EURO5 and Platinum with EURO4 were low in both cases, even below detection limit.
Keywords:
Nanoparticles, DPF… Diesel Particle Filter, Retrofitting DPF on Trucks, Emissions HD Diesel
Cite this paper: Andreas Mayer, Markus Kasper, Jan Czerwinski, Nanoparticle Counts Emissions of Trucks: EURO 3 with and without DPF Compared to EURO 4 and EURO 5, Energy and Power, Vol. 4 No. 1A, 2014, pp. 1-10. doi: 10.5923/s.ep.201401.01.
1. Introduction
Solid state particles occur in IC-engine exhaust at concentrations of 107 – 108 particles per cm3. Their pertinent size range is about 10 - 400 nm and the average size is 60 – 80 nm. Particles of this size intrude the alveoli. Subsequently, they rapidly infiltrate the cell membranes and are transported into human organs, even penetrating the blood/brain barrier and the placenta-barrier. Apart from causing cancer, nanoparticles may trigger a variety of diseases, e.g. cardiac infarct, Alzheimer and Parkinson decease[1]. In 1989 the WHO classified these particles as carcinogenic. Indeed, P. Pott observed soot to be carcinogenic already in 1775 during his famous studies with chimney sweeps. Researchers and authorities in occupational health[2] recognised the importance of particle size as early as 1910. Environmental legislation mandates minimizing such emissions using the best available technology BAT,[3].Separation into solid state particles and condensed droplets, characteristic for IC engine exhaust when cooling down, is reliably done using the PMP-measuring method evaluated by UN-ECE-GRPE in 2002-2006[4].European legislation, for IC-engine exhaust, initially specified the EURO-1 particle emissions limits in 1992 using the US EPA definition of PM, dating from 1982. PM is a metric that does not differentiate according to particle size or chemical composition. Hence, it is not well suitable for toxicity evaluations. The Swiss metric for DPF-evaluation is the number concentration of solids in the nanoscale range[6].European Union legislation also does not limit secondary noxious pollutants, unlike the US Clean Air Act 202 which precludes the release of poisonous by-products[5], when deploying new technologies. Since 1990, the Swiss also require testing of possible secondary emissions if there are catalytic processes involved in the engine exhaust[7]. DPF retrofit of construction equipment or off road vehicles is only acceptable when the filter systems comply with both the filtration and secondary emission criteria according to best available technology.Meanwhile, European emission criteria have been tightened but the PM metric is still inappropriate. The EU assumes that curtailing particle mass automatically decreases the number of particles also. To answer the question whether reducing mass does automatically reduce particle concentration or not, two representative HDV certified according to EURO4 and EURO5 were selected. Their nanoparticle and secondary emissions were compared to a corresponding EURO3 vehicle with and without DPF. The fundamental question was: “Are DPFs, complying with the VERT standard, still necessary in future despite the emissions progress from EURO3 to EURO4 and EURO5 engines?”
2. Test Vehicles
Test-vehicle EURO-3Manufacturer: Mercedes BenzType: 1846 LS-O3Engine: OM 4001 LA.III/9Power rating: 355 kW at 1695 rpmMaximum torque:2335 Nm at 1196 rpmPrior usage: 49,051 kmEmission reduction: Retrofit DPF by HJS CRT-system, sinter-metal-filter(VERT No. B159/03.05)Test-vehicle EURO-4Manufacturer: MANType: TGA 18.430 4XBLSEngine:D 2066LF 11, EURO-4Power rating: 316 kW at 1900 rpmMaximum torque:2212 Nm at 994 rpmPrior usage: 31,196 kmEmission reduction: EGR cooled, PM-KatPM-Kat is a bypass-filter system where at clean conditions about 50% of the gas flow is through a metal fibre filter fleece layer. The flow ratio varies with soot load. Regeneration is with NO2 from an upstream oxidation catalyst[12].Test-vehicle EURO-5Manufacturer Mercedes BenzType 1896-LS EURO-5Engine:OM 5001 LA.V5Power rating: 348 kW at 1796 rpmMaximum torque:2221 Nm at 1097 rpmPrior usage: 2,863 kmEmission reduction: SCR with Adblue TechnologyFuelCommercial Diesel fuel as per SN 181 160-1:2005Sulphur content: 10 -15 mg /kg fuelEURO4 and EURO5 substantially curtailed particulate mass emissions PM compared to EURO3. The PM limit is diminished from 100 mg to less than 20 mg/kWh within the ESC driving cycle. Engines do not “smoke” any more. However, tailpipes are still blackened by soot. Moreover, NOx limits were curtailed tremendously. Nevertheless, the permissible NO2/NO ratio is yet unspecified. The EURO5 and EURO3 tests were performed sequentially. The EURO-4 vehicle was tested some months later.
3. Test Set-up and Instrumentation
Chassis-dynamometer of LARAG AG, Wil, SwitzerlandThis test bed can be set to any steady state operating point of the engine within the entire operating range. Load steps can be performed including free accelerating conditions. Determination of gaseous emissionsConcentrations of CO2, CO, NO2 and NO were determined in the heated and permeation dried gas using non-dispersive IR analysis (NDIR) and a two-channel chemo-luminescence analysis (CLD). To avoid loss of substance due to permeation-drying, volatile organic substances, hydrocarbons, N2O, NH3 SO2 were determined in the hot and humid exhaust using flame-ionisation spectroscopy (FID) and Fourrier Transform Infrared Spectrometry[25]. Determination of metallic emissionsThe EURO-5 vehicle (SCR equipped) was tested for emissions of Vanadium, the EURO-4 vehicle (PM-Kat equipped) was tested for emissions of Platinum. Over the entire driving cycle, an aliquot proportional to volume of exhaust was absorbed in acid aqueous solution, which was finally analyzed using plasma-mass spectroscopy (Q-ICP-MS).Particle-analyticsThe following measuring methods were used:• SMPS (TSI)• NanoMet with PAS and DC sensors ( Matter Engineering)• PASS (AVL)• ELPI ( DEKATI)Sampling for SMPS and NanoMet was performed acc. to PMP. The sampling line was heated to 300°C, to prevent condensation and diluted using the MD19 rotating disc diluter (ME) at ratios of > 100[21].FPS (DEKATI) injector dilution was used for PASS and ELPI because of the higher sampling gas volume, dilution ratio was 30-70 and the sampling line was not heated.These measurement methods were selected for the following reasons:SMPS is a widely used method for the fine analysis of size distributions. Its disadvantage is the limitation to the size range of at maximum 1000 nm. Consequently agglomerates, to be expected in partial filters, cannot be observed[9]. SMPS can also be used to calculate overall particle volume and, applying unit density (1g/cm3) particle mass. The SMPS is not suitable for transients.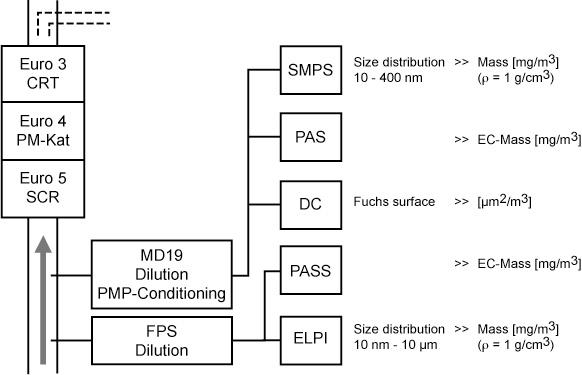 | Figure 1a. Schemes for measuring: particle-analytics |
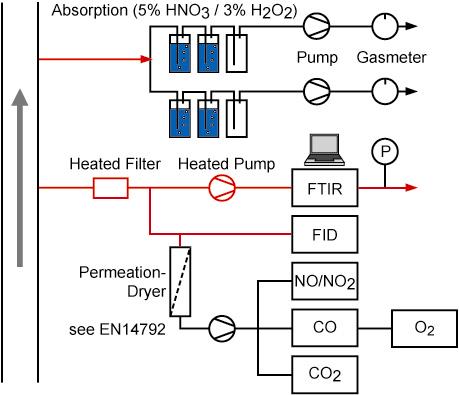 | Figure 1b. Gas- and metal-analytics |
NanoMet provides data about the total active particle surface (Fuchs surface) using the two sensors PAS and DC. The mobility size range is below 1 µm. Additionally, there is some information on chemical composition. PAS signals correlate well with EC. Both sensors are suitable for transients and, even in free acceleration, particle emissions can be recorded.PASS provides an integrated value for total EC mass over a very wide size-range, limited by sampling only.ELPI yields a rather broad classification of size ranging from about 30 nm to 10 µm (aerodynamic diameter). It also enables on-line recording of the electric signal. ELPI and PASS were only used for measuring the EURO4-HDV.PMP sampling heats the sample to 300°C and the subsequent dilution may be selected freely to several hundred times. That reliably separates solid particles and volatile aerosols[15].
4. Operating Points
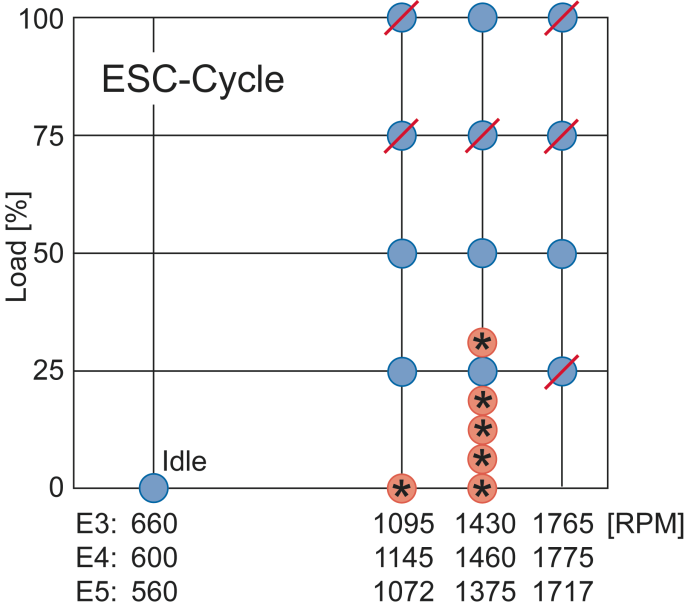 | Figure 2. Operating points : the crossed out test points were cancelled to avoid excessive tire-abrasion - they were not the focus anyway. The operating points marked with asterisks were tested in addition to the standard test cycle, to better understand the response at low loads |
Measuring points in steady-state operation were selected close to the ESC testing cycle. In the low load range, smaller steps were chosen to address some weak points of the systems: - the SCR System is less effective at low loads, at little activity of the catalyst and when urea injection is completely stopped at about 220°C. - the PM-Kat exhibits weakness, if regeneration is inhibited due to insufficient NO à NO2 conversion. Transient responses were investigated at free accelerations from low rpm (idling) and low load, as also using supplementary loads starting from other operating points.The particle filters were not conditioned or regenerated at the beginning of the test nor between the test points but soot loading was monitored by backpressure.
5. Particle Emissions at Steady State
Figure 3 shows particle size distributions, measured with SMPS of the four HDV candidates investigated at zero-load, at 25% load, at 50% load and at full load, all at 1400 rpm. Decisive for the cycle are the three part-loads. Evidently, both EURO4 and EURO5 are distinctly improved compared to EURO3. This effect is more pronounced for larger particles, in the size range 200-400 nm, than for smaller particles. This agrees with the agglomeration model, when concentration of primary particles is diminished. Large particles dominate particle mass, which is reduced by a factor of 5 from EURO3. The overall response of EURO4 and EURO5 is quite similar.3 observations deserve attention:§ At full load, EURO-5 without any filtering aftertreatment emits more nanoparticles than EURO-3. § The poor behaviour of the PM-Kat is evidenced by the increasing penetration with reducing size.§ Deploying a DPF complying with the VERT-standard enables 2 to 3 orders of magnitude (100-500 times) less nanoparticle emissions than the very latest HDVs .Results for EURO-5 were well repeatable. Average standard deviation SDV for SMPS upstream DPF was 5.3%, downstream DPF at very low concentrations 47.2%, which is excellent. Average standard deviations for DC and PAS upstream DPF were 6.7% and 5.5% respectively. With EURO4, equipped with PM-Kat, repeatability at low loads was not achievable (Figure 4). There was a rather large variation in the penetration (= 1 – retention rate) of the PM-Kat system, for both large and small particles. Moreover, filtration failed completely at 10% load. Further increase of the engine load enabled a recovery of the system to retention rates of 30-50%. Apparently, reaching higher temperatures the system had regenerated itself and thereby regained its filtration capability.Retention characteristics of the PM-Kat-system obviously are not reproducible in the range of low loads. The dynamics of regeneration and antecedents influence filtration in unpredictable ways. This is a problem of stochastic stability.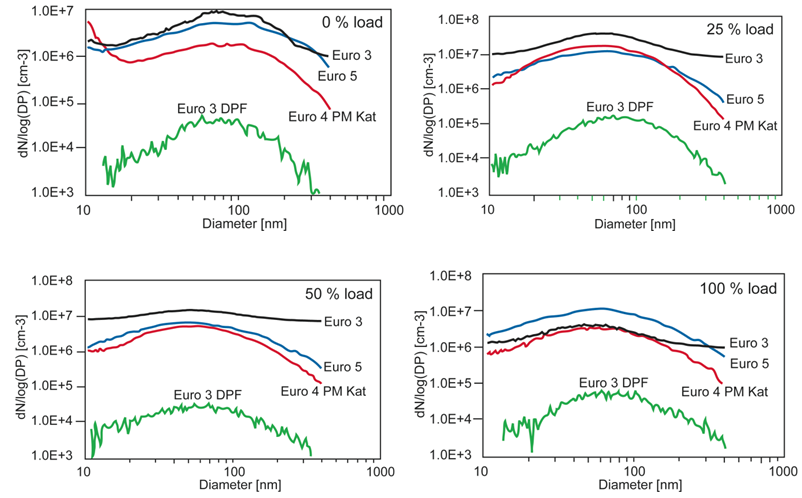 | Figure 3. Emissions of ultrafine particles in the nanoscale range at 1400 rpm at different loads of all 4 test candidates (with SMPS and PMP-sampling) |
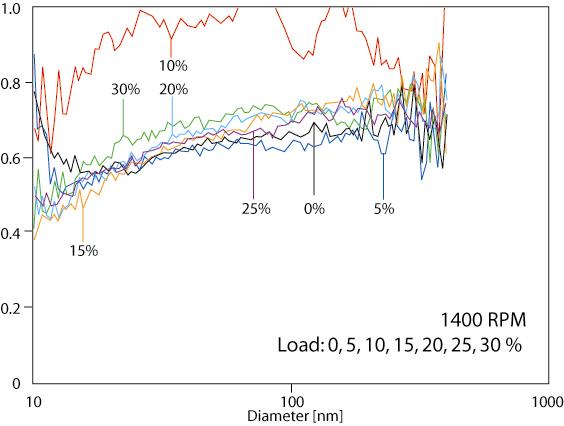 | Figure 4. PM-Kat: Penetration at 1400 rpm and low load (recorded with SMPS) |
6. Soot Burden Effects in EURO4 PM- Kat
PK-Kat is a partial filter. When the filter is clean, about half of the exhaust gas passes the filter, the rest leaves the system unfiltered through the bypass holes (that’s why such filters are also called “open filter systems”). When the filter is storing soot the flow-ratio bypass/filter increases due to the increase of the filter back pressure. Accumulating soot at low temperatures, where regeneration is not active has therefore a strong influence on the filtration rate. A soot deposit remains exposed to the main flow and blow-off can occur.A similar effect is well known in deep-bed filters (foam-filters, fibre-filters etc.). Increasing the soot burden reduces filtration, finally approaching a zero filtration rate where back-pressure remains fairly constant and the incoming particle mass is almost the same as out-flowing. However, the size spectrum is shifted towards larger particles, due to agglomeration[9, 10]. This effect is best demonstrated at zero-load. Particle emission is low. However, the regeneration capability is low too, because the catalytic activity is negligibly small, i.e. soot burden would increase. Such operating conditions are not typical for the load profile of utility vehicles. Nevertheless they are realistic and should be considered as a “worst case” as shown in Figure 5.At idle conditions (lower diagram) a freshly regenerated filter exhibits an average filtration rate of about 40%, albeit there is some distinct weakness in the range of small particles. At low soot rates, some hours elapse till the filtration rate drops towards zero. There is an increasing release of very small particles, and more particles may exit than enter the filter. 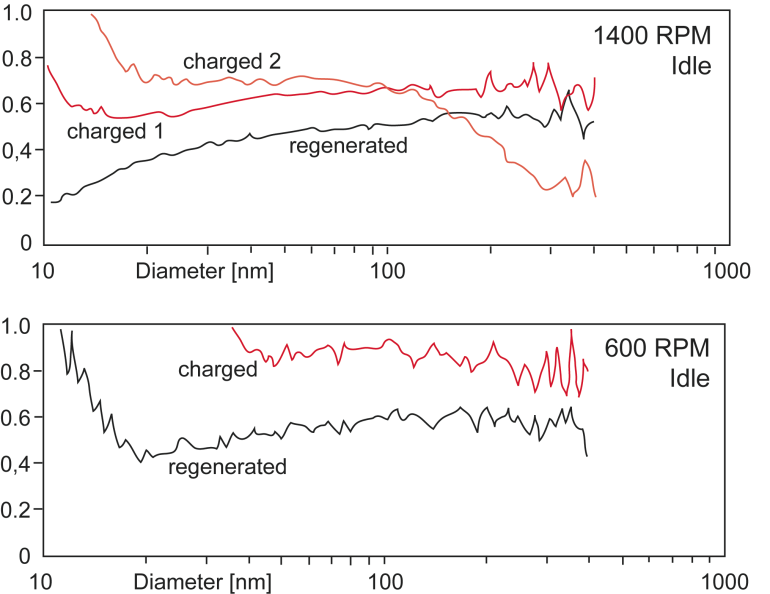 | Figure 5. Soot Loading tests at both low rpm zero-load and 1400 rpm zero load. Penetration is shown in function of particle size for a regenerated filter and after charging during some hours. (Recorded with SMPS) |
These emissions of ultra fine particles are frequently observed at low rpm and zero load and are supposed to be metal-oxides originating from lube-oil additives, due to increasing lube oil consumption at idling.Investigations at 1400 rpm and zero-load (upper diagram) show similar trends, except that initially the filtration rate of ultra-fine particles was quite high. Unfortunately, this desirable attribute changes with increasing load. Soot burden was increased in two steps of 2-4 hours. Then the filter characteristics toppled over and finally a similar result was obtained as for zero-load at idling. Similar observations on increasing soot burden are published[11, 12].
7. Formation of Volatile Particles within the EURO-4 PM-Kat System
The following figures are size distributions for various sampling system temperatures of the exhaust prior and after the PM-Kat system. The influence of sampling temperature on size distribution was investigated.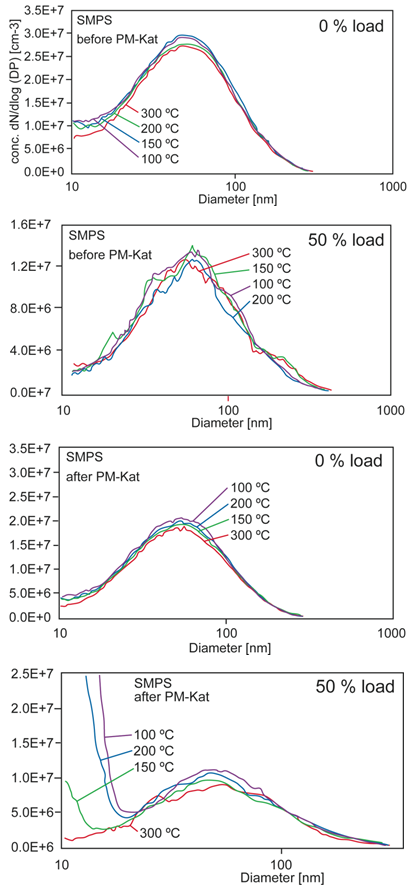 | Figure 6. Thermographs, sampling before and after the PM-Kat at 1400 rpm at 2 different loads. (Recorded with SMPS). Sampling system temperature was varied between 100°C and 300°C |
At zero-load, sampling temperature apparently has no influence. But at half-load, lower sampling temperature causes an increasingly distinctive emission of very fine particles. The explanation is the catalytic activity. At low load there is no catalytic activity. But at 50% load, the reaction SO2 à SO3 is activated and a substantial amount of sulphuric acid is formed, which, when cooled down, creates nuclei of water enriched sulphuric acid[27].
8. EURO5 SCR: Peculiarities of Emissions
Several publications[13, 22] report emissions of additional ultrafine particles when using SCR with urea/water-solution (=Adblue) injection. The EURO5 vehicle was tested with and without Adblue injection. Some of the results are presented in Figure 7 and shown for the size range up to 100 nm.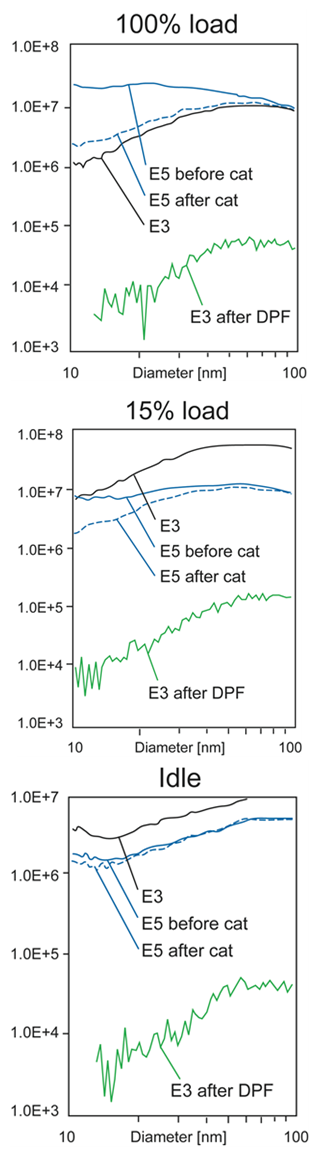 | Figure 7. Influence of Adblue injection on ultra-fine particle emission (recorded with SMPS) |
Ahead of the catalytic converter, there certainly is a distinctive increase in emission of fine solid particles. The emission levels increase with load corresponding to increase of Adblue injection. At full load, the particle concentration upstream of the SCR-catalyst with Adblue injection is an order of magnitude higher than downstream. Diffusion in the fine pored catalyst only partially separates these additional ultrafine particles from the gas. At zero-load, this phenomenon disappears. One hypothesis[13] is the formation of sulphates. But since similar phenomena are reported[20] in diesel-water emulsions, another explanation could be mineral particles due to insufficient de-mineralization.
9. Particle Emissions in Acceleration
The free acceleration is tested as follows. Starting from stable idling, the accelerator-pedal is suddenly kicked down fully, i.e. the engine accelerates its internal mass to full load. This is a very critical situation for smoke formation, which may exhibit the lag of the turbo-charger as well.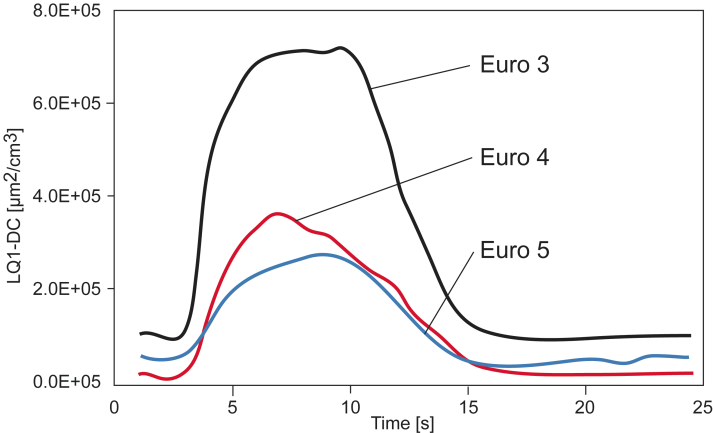 | Figure 8. Free accelerations, recorded with DC sensors of the NanoMet-system, averaged over 5 accelerations |
Results are given in Figure 8. Obviously, the automatic control of modern EURO4 and EURO5 systems is much superior to EURO3. The acceleration peaks are therefore much lower. However, the absolute level of the peak is almost an order of magnitude above the peak determined at full load steady state.
10. Gaseous Emissions with EURO 5 SCR
Operating points were selected in function of load. Emissions shown are before and after the SCR catalyst, with Adblue injection active.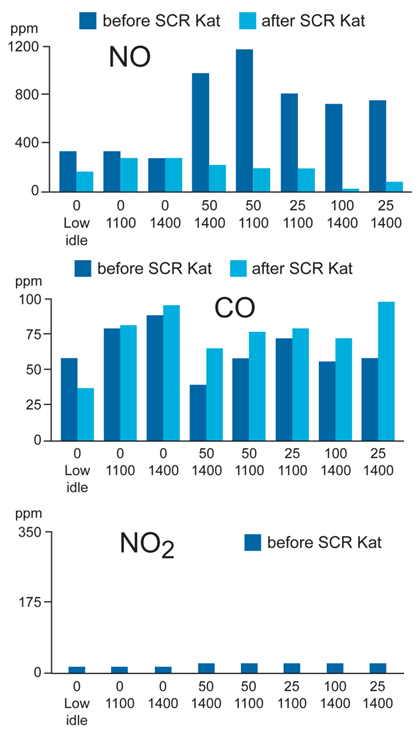 | Figure 9a. Gaseous emissions from the EURO5 HDV |
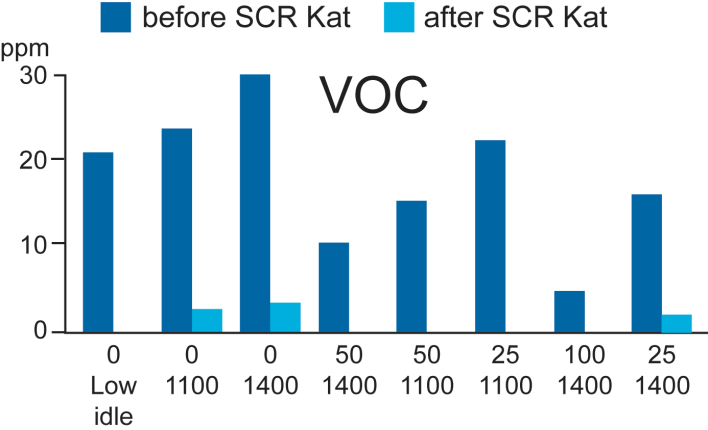 | Figure 9b. Gaseous emissions from the EURO5-HDV |
The SCR DeNOx system is very efficient above 25% load. Under steady-state conditions, reduction of NOx was up to 98%. A slight slip of ammonia was observed only once; otherwise ammonia concentration was below the detection limit of 20 ppm. Concentration of N2O was below the detection limit of 5 ppm. At zero-load however, there is no reduction of NOx. This fact is critical for deployment in city busses. At any operating condition, concentration of NO2 is negligible. This is good news considering the excess at environmental measuring sites[14]. The SCR catalytic converter also substantially diminishes hydrocarbon emissions. But it does not lower CO, which is well known[19]. Fortunately, modern diesel engines emit this component far below limits.
11. Gaseous Emissions with EURO4 PM-Kat
The usual response of Pt-coated oxidation catalyst, as is well known for CRT systems, is observed on EURO-4[15]: CO and HC are efficiently converted. Their concentrations are one magnitude lower than the limit. Some NO is transformed to NO2 as soon as the exhaust temperature exceeds 240°C. At higher temperatures, the conversion rate decreases due to chemical equilibrium. The availability of NO2 is a prerequisite for reliable functioning and continuous regeneration of the PM-Kat. However, there is high NO2 slip, which may become a serious penalty[14].
12. Emission of Metal Paricles
The average concentration of Vanadium in the exhaust gas was 102 ng/m³. This is clearly above concentration in ambient air of 0.8-2.4 ng/m³[16]. But it is below the WHO limit of 1000 ng/m³, which is the regarded to be the threshold for health effects[26]. Emissions of Platinum were below detection limit of 7 ng/m³. This is remarkably low as modern three-way catalysts are reported[17] to emit up to 100 ng/m³.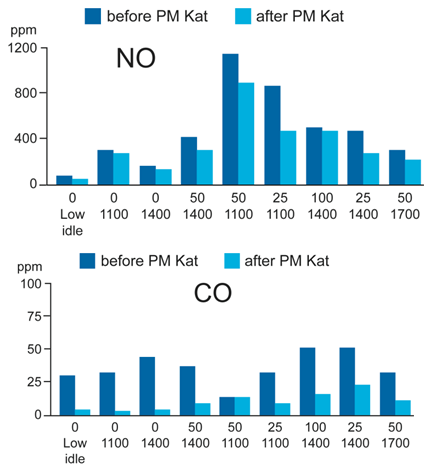 | Figure 10a. Gaseous emissions of the EURO4 HDV |
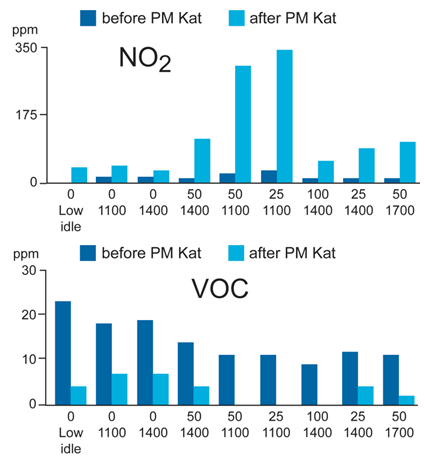 | Figure 10b. Gaseous emission of the EURO4 HDV |
13. Comparison of Particle Measurement Methods
Figure 11 shows the filtration rate of a HJS sinter-metal DPF complying with VERT standard at 4 different operating conditions, varying load. Data of SMPS (number and mass), PAS and DC were determined for 4 operating points. The filtration rate is at about 99.8% at light load and gradually decreases to 99% for the highest space velocity at full load. This statement is valid both for the number as well for the mass criteria, according to SMPS and to EC (PAS-signal) and for the Fuchs surface (PAS-signal). The results of all the sensors and instruments agree well with each other. That demonstrates both a very stable operation of the filter and a high repeatability of all used measuring systems.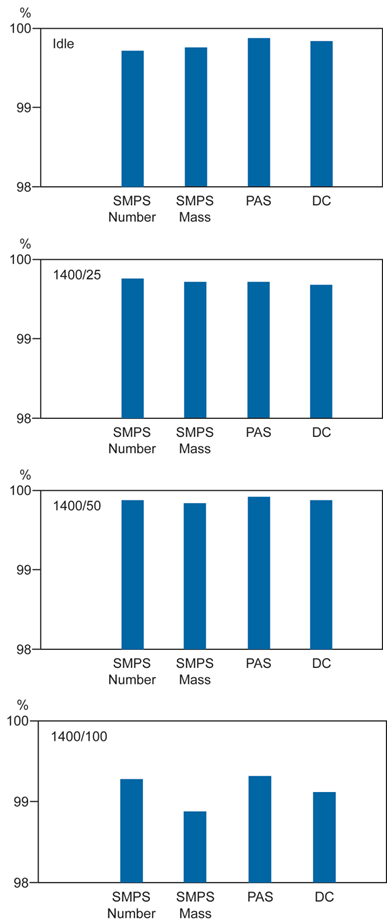 | Figure 11. Filtration rate of the DPF retrofitted EURO3- vehicle |
Figure 12 shows the filtration rate of the PM-Kat.These results are shown as penetration, thus facilitating statements on blow off phenomena. 5 instruments were used including PASS and ELPI. At higher loads, all five instruments yield quite uniform results, when continuous regeneration occurs and the ratio of bypass flow is about constant. At low loads, much scatter is evident and frequently filtration fails completely. Scatter is particularly observed for PASS and ELPI, which are methods applicable for large agglomerated particles, too. Results diverge not only between various measuring methods but also repeatability is missing, when repeating with the very same instrument.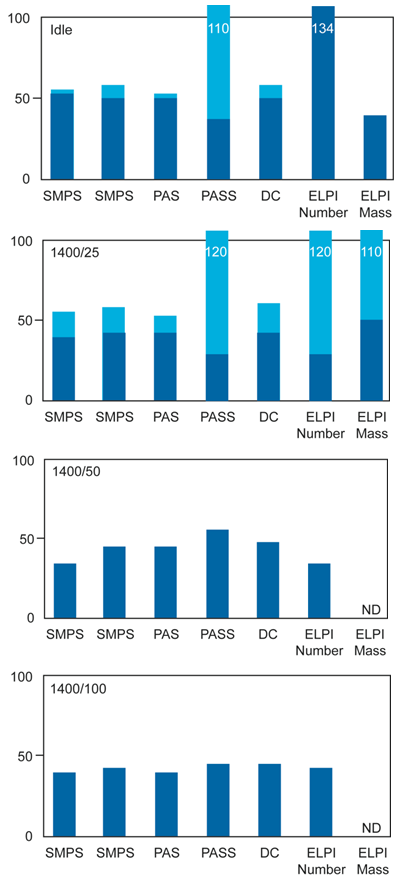 | Figure 12. EURO4 vehicle with PM-Kat: Penetration[%] measured with 5 instruments. Penetration values >100 mean that more particles are leaving the filter then entering which is an indication for blow-off of agglomerated particles, which are not detected by SMPS, PAS and DC, since these instruments are limited for particle size < 1000 nm |
14. Conclusions and Outlook
The study shows that modern EURO4 and EURO5 vehicles release moderately fewer particles compared to EURO3, at almost all operating conditions. This is valid over the entire size range, albeit the reduction at larger particle size is better. There is no evident change of the mean particle size (mobility diameter) from EURO3 to EURO4/5. Furthermore, the particle emissions of the EURO5 SCR-concept are well repeatable. That is also true for EURO3, with and without DPF. In contrast, EURO4 with PM-Kat is unstable. At operating conditions where 30-40% filtration was measured, zero filtration was measured when approaching the same operation point after a different testing history. This confirms published evidence of filtration strongly depending on soot burden and engine operating point. There are also doubts about long-term stability, due to catalyst aging and irreversible adhesion of ash particles. NOx reduction of the EURO-5 SCR is impressive and ammonia slip is minimal. This is better than the EURO4 vehicle that exhibits a substantial NO2 slip. Emissions of metals are small in both concepts. Both concepts, EURO4 and EURO5 need further improvement. BAT-particle filters should be used. Thus emission of solid nanoparticles can match or surpass the EURO3 with DPF-retrofit.
ACRONYMS
BAT Best Available TechnologyDC
 Diffiusion Charging (Aerosol Sensor ME)DPF
 Diesel Particulate FilterEC
 Elemental CarbonELPI
 Electric Low Pressure Impactor (DEKATI)FPS
 DEKATI dilution systemHDV
 Heavy Duty VehicleICP-MS
 Induct. Coupled Plasma Mass Spectrometry PAS
 Photoelectric Aerosol Sensor (ME)PASS
 Photo Acoustic Soot Sensor (AVL)PMP
 Particle Measurement Program (UN-ECE)PM-Kat
 Partial Filter Catalysed (MAN)SMPS
 Scanning Mobility Particle Sizer (TSI)VERT
 Swiss Particle Filter Certification Sceme
References
| [1] | PM and the Central Nervous System; Calderon, L / 10.ETH-conference on Combustion Generated Nanoparticles 8/2006. |
| [2] | Proceedings of the Pneumoconiosis Conference, Feb. 1959 Johannesburg .J.Ohrenstein, J&A Churchill Ltd, 1960. |
| [3] | Schweizerische Luftreinhalteverordnung LRV1985. |
| [4] | Update on the PMP Light Duty Inter-Laboratory Correlation Exercise J.Anderson / 10.ETH-conference on Combustion Generated Nanoparticles 8/2006. |
| [5] | Secondary Emissions Risk Assessment of Diesel Particulate Traps for HDV Applications N.V.Heeb et al, SAE 2005-26-014. |
| [6] | VERT-Filterliste, SUVA / BAFU 2006;www.umwelt-schweiz.ch/buwal/de. |
| [7] | Weisungen des Eidgenössischen Justiz- undPolizeidepartementes EJPD 8/1990. |
| [8] | VERT Particulate Trap Verification A.Mayer et al. , SAE 2002-01-0435. |
| [9] | The Influence of a Particle Trap on the Size Distributions of Diesel Particles, D.Kittelson, SAE 850009. |
| [10] | Pre-Turbo-Application of the Knitted Fiber Diesel Particulate Trap A.Mayer et al, SAE 94’459. |
| [11] | Meeting EU 5 PM emission Standards. Comparison of different Particulate Traps Zelenka, P.; ETH Nanoparticle Conference 8/2006. |
| [12] | Metal supported particulate-matter-cat; a low impact and cost effective solution L.Pace et al ; SAE 2005-01-0471. |
| [13] | Particle Emissions from a HD Diesel Vehicle with Urea SCR Catalyst Y.Goto; NTSEL, 9th ETH-conference on Combustion Generated Nanoparticles 8/2005. |
| [14] | NO2 – die neue Herausforderung? J.Lemaire, W.Naschke; NO2-Workshop Munich 8.2.2006. |
| [15] | The Use of Continuously Regenerating Trap CRT to Control Particulate Emissions R.Allansson et al.; SAE 2002-01-1271. |
| [16] | Chemical Characterization of PM2.5, PM10 and Coarse Particles Ch.Hueglin el al; Atmospheric Environment 39 , 2005, 637-651. |
| [17] | Forschungsverbund Edelmetall-Emissionen,Abschlussbericht GSF GSF-Forschungszentrum für Umwelt und Gesundheit; D.Pohl, München, 1997. |
| [18] | Fuel Effects on the Characteristics of Particle Emissions for Advanced Engines CONCAWE-Report Nr. 1/05. |
| [19] | Off-Highway Exhaust Gas After-treatment combining Urea-SCR, DOC and DPF H.T.Hug, A.Mayer et al. , SAE 930363. |
| [20] | Influence of AQUAZOLE, a Water in Diesel Fuel Emulsion on Nanoparticle Emissions R.Tort, 4.ETH-conference on Combustion Generated Nanoparticles 8/2000. |
| [21] | Sampling and Measurement of Nanoparticle Emissions for Type Approval M.Kasper, SAE 2005-26-013. |
| [22] | Characterization of Nanoparticles from a 2010-Type heavy Duty Diesel Engine M.Khair et al; , 9th ETH-conference on Combustion Generated Nanoparticles 8/2005. |
| [23] | Emissionsmessungen an einem EURO-5 LKW amRollenprüfstand der LARAG AG in Wil. Sekundäremissionen von Stickstoffverbindungen und Vanadium. J.Mohn, et al; EMPA-Prüfbericht 438'957. |
| [24] | Emissionsmessungen an einem EURO-4LKW mit PM-Kat. Sekundäremissionen von Stickstoffverbindungen und Platin. J.Mohn et al. ; EMPA-Prüfbericht 439'927. |
| [25] | Time-Resolved Ammonia Measurement in Vehicle Exhaust; J.Mohn et al.; Int. J. Environment and Pollution 22 3, 342-356. |
| [26] | WHO 2000, World Health Organization, Air Quality Guidelines. |
| [27] | Recent on-road ultrafine and nanoparticle measurements; Kittelson D./U. of Minnesota 9.ETH nanoparticle conference Zurich. |
 Abstract
 Reference
 Full-Text PDF
 Full-text HTML