Jaehan Koh1, Sangheon Shin2
1School of Business, Lincoln Memorial University, Harrogate, TN 37752, U.S.A
2Department of Accounting and Finance, Alabama State University, Montgomery, AL 36104, U.S.A
Correspondence to: Sangheon Shin, Department of Accounting and Finance, Alabama State University, Montgomery, AL 36104, U.S.A.
| Email: |  |
Copyright © 2014 Scientific & Academic Publishing. All Rights Reserved.
Abstract
We examine the dynamic relationship among real activity, inflation, interest rates and stock returns in the post-war period from 1947 to 2008 by employing a recursive vector autoregression (VAR) model. We find no significant relationship between real stock returns and inflation, supporting the Fisher effect that common stocks are hedges against inflation. Furthermore, we investigate the effects of changes in the Federal Reserve’s monetary policy rule by comparing the response of interest rates to inflation between two sub-periods: pre-1980 period (1947 – 1979) and post-1980 period (1980 – 2008). We find that real interest rates absorb inflation shock much more quickly in the post-1980 period than in the pre-1980 period, the evidence supporting the well-known fact that the Federal Reserve more aggressively responds to inflation in the post-1980 period than in the pre-1980 period.
Keywords:
Inflation, Stock Returns, Stock Market, Interest Rate, Monetary Policy, Fisher Effect, Time Series, Dynamic Relationship, Vector Autoregression (VAR)
Cite this paper: Jaehan Koh, Sangheon Shin, Stock Market and Monetary Policy Versus Inflation: A Time Series Approach, American Journal of Economics, Vol. 4 No. 2A, 2014, pp. 81-86. doi: 10.5923/s.economics.201401.07.
1. Introduction
The effect of inflation on the financial assets has long been an important topic in finance. We revisit this topic to compare our results to the previous ones. Conventional wisdom, or “Fisher effect”, is that common stocks are hedges against inflation. However, previous empirical results denied the Fisher effect (Fama, 1981; Geske and Roll, 1983; Ram and Spencer, 1983; James, Koreisha, and Partch, 1985; Stulz, 1986). We examine this relationship with the more extended post-war period (Jan. 1947 – Dec. 2008). A well-known fact is that the U.S. Federal Reserve (Fed) has more aggressively responded to inflation since 1980 than before 1980 (Mehra, 1999, Clarida, Gali and Gertler, 2000; Berument and Froyen, 2006; Boivin and Giannoni, 2006; Dennis, 2006). We compare the responses of interest rates to inflation between pre-1980 period (Jan. 1947 – Dec. 1979) and post-1980 period (Jan. 1980 – Dec. 2008).We employ a four-variable vector autoregression (VAR) to examine dynamic relations among variables; four variables represent real activity, inflation, real interest rates and real stock returns. However, we focus on the relationship between stock returns and inflation in the full sample period, and between interest rates and inflation in each sub- period.This paper contributes to the existing literature in two ways. First, we test the Fisher effect using the more extended sample period than the previous works to get more reliable results. Second, we compare the Fed monetary policy between pre-1980 and post-1980 periods using a different approach from the previous works to confirm the changes in the Fed monetary policy around 1980. From the empirical results, we find no significant relationship between real stock returns and inflation, supporting the Fisher effect and contrary to the previous findings. In addition, we find that real interest rates absorb inflation shock much more quickly in the post-1980 period than in the pre-1980 period, the evidence supporting the well- known fact.The remainder of this paper is organized as follows; the next section briefly reviews literature, the third section describes methodology, the forth explains data, the fifth section reports the results of empirical tests and the final section concludes the paper.
2. Literature Review
2.1. Relationship between Stock Market and Inflation
Fisher (1930) formulated the hypothesis, known as Fisher effect, that the nominal interest rates fully reflect the rate of expected inflation, meaning that real rates are unaffected by inflation. The Fisher effect has been tested in the stock market. The Fisher effect in the stock market implies that the real stock returns are unrelated to the expected inflation (Jaffe and Mandelker, 1976), meaning that stocks are hedges against inflation. However, most previous researchers find the negative relationship between stock returns and inflation, contrary to the Fisher hypothesis and conventional wisdom. Hence, they attempt to explain why this phenomenon happens. Fama (1981) hypothesizes that the negative relation between real stock returns and inflation is not a causal relation but only an association; it is caused by the combination of a positive relation of stock returns to real activity and a negative relation of real activity to inflation. Geske and Roll (1983) argue that stock returns affect expected inflation through a chain of macroeconomic events. When stock prices decline by forecast of economic conditions, the government will run a deficit, causing expected inflation to rise. However, Ram and Spencer (1983) find evidence of unidirectional causality from inflation to stock returns. Using a vector autoregressive-moving average (VARMA) model, James et al. (1985) examine the causal links among stock returns, real activity, money supply, and inflation, and finds that stock returns affect both real activity and the monetary base, suggesting a link between money supply and real activity, and thus supporting Geske and Roll (1983). However, using a multivariate VAR, Lee (1992) finds that stock returns explain little variation in inflation and that responses of inflation and stock returns are not consistently negative to shocks in stock returns and inflation, respectively.
2.2. Changes in the Monetary Policy between Pre-1980 and Post-1980 Periods
Mehra (1999) finds that during the Volcker-Greenspan period, the Fed responded aggressively enough to future inflation indicators. Such is not the case in the pre-1979 period, when the real funds rate target declines in response to inflation. Clarida et al. (2000) show that interest rate policy in the post-1979 period appears to be much more sensitive to shock in the expected inflation than in the pre-1979 period and that the monetary policy in the post-1979 period stabilizes. Berument and Froyen (2006) examine and compare the impact of federal funds rate shock on longer term nominal interest rates between pre- and post-1979 periods. They find that the response of interest rates to federal funds rate shock is smaller and less persistent, because the Fed more fully responds to inflation, in the post-1979 period than in the pre-1979 period. By estimating a VAR over the pre- and post-1980 periods, Boivin and Giannoni (2006) find that the effect of monetary policy shocks decreases in the latter period, and concludes that monetary policy stabilizes the economy more effectively by responding more strongly to inflation in the post-1980 period than in the pre-1980 period.
3. Methodology
We employ a four-variable recursive VAR system with industrial production growth (IPG), inflation rate (INF), real interest rate (IRR) and real stock returns (SRR), inspired by, but using a different order in variables from, Fama (1981) and Lee (1992). The order of variables is very important, especially in the VAR system. We believe that real activity measured by IPG affects inflation, which in turn influences financial markets. In the financial market, interest rates have an impact on the stock market, which leads real activity.Hence, our model is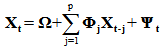 where Xt is the 4×1 vector of [IPGt, INFt, IRRt, SRRt]´ at month t; Ω is the 4×1 vector of constants; Φj is the 4×4 matrix of coefficients for j-th lagged variables; p indicates the lag length; and Ψt is the 4×1 vector of shocks (or innovations) in Xt. We perform the impulse responses and variance decompositions to examine the interactions between variables.First, we perform this VAR for the full sample period (Jan. 1947 – Dec. 2008) to examine the interactions between stock market and other macroeconomic variables; our main concern in this full period is in the dynamic responses of real stock returns to the shock (or innovation) in inflation. Second, we divide this full period into two sub-periods, pre-1980 period (Jan. 1947 – Dec. 1979) and post-1980 period (Jan. 1980 – Dec. 2008), to compare relationships of interest rates to other macroeconomic variables between the two sub-periods; our main interest in these sub-periods is in the dynamic relationship between interest rates and inflation.
4. Data
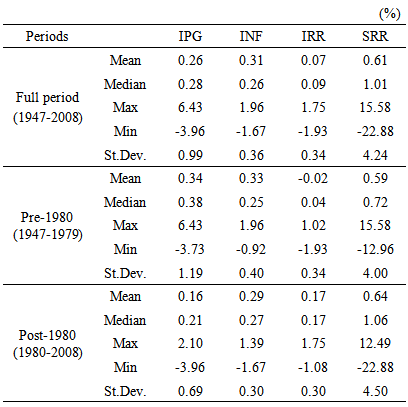
IPG, INF, IRR and SRR are computed in the following ways.IPGt = (IPIt – IPIt-1)/IPIt-1,INFt = (CPIt – CPIt-1)/CPIt-1,IRRt = IRNt – INFt andSRRt = SRNt – INFt. where IPI and CPI denote industrial production index and consumer price index, respectively, for each month from St. Louis Fed website, IRN denotes the nominal monthly interest rate, which is one month T-bill returns from French’s website(http://mba.tuck.dartmouth.edu/pages/faculty/ken. french/data_library.html), and SRN denotes the nominal monthly stock returns, which are the returns on the NYSE/Alternext/Nasdaq Value-Weighted Market Index from the Center for Research in Security Prices (CRSP). Subscript t for IPI and CPI means the end of month t or the beginning of month t+1 (IPI and CPI are released at the beginning of each month), and the data of IPI and CPI are seasonally adjusted. The full sample period is from January 1947 to December 2008, and two sub- periods are divided by the end of 1979.Table 1 reports descriptive statistics of data, and exhibits that real interest rates are quite different between two sub-periods: on average -0.27% for the pre-1980 period vs. 2.09% for the post-1980 period in annual rates.Table 1. Descriptive Statistics
 |
| |
|
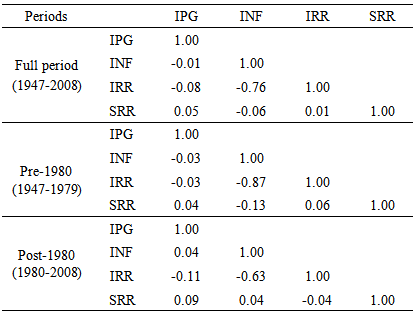
Table 2 reports correlation matrix, which implies the contemporaneous relations, among variables. The correlation between real stock returns and inflation is negative (-13%) in the pre-1980 period but positive (4%) in the post-1980 period, resulting in negative (-6%) for the full period. Real interest rates are closely related to inflation in both sub-periods, but more closely in the pre-1980 period (-87%) than in the post-1980 period (-63%).Table 2. Correlation Matrix
 |
| |
|
Figure 1 illustrates the movements of real interest rates against inflation. Real interest rates on average have shifted up since 1980. Figure 2 reveals a little negative relationship between real stock returns and inflation in the full period. This negative relationship is more remarkable in the pre-1980 period than in the post-1980 period, agreeing with Table 2.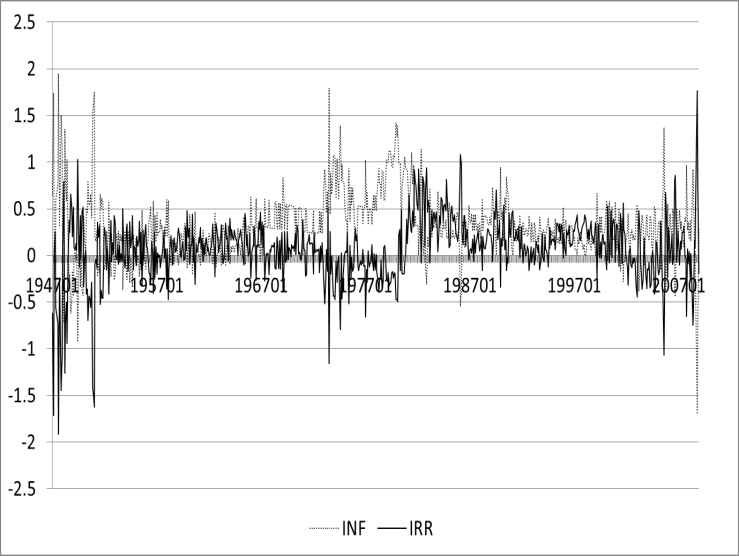 | Figure 1. Real interest rates vs. inflation |
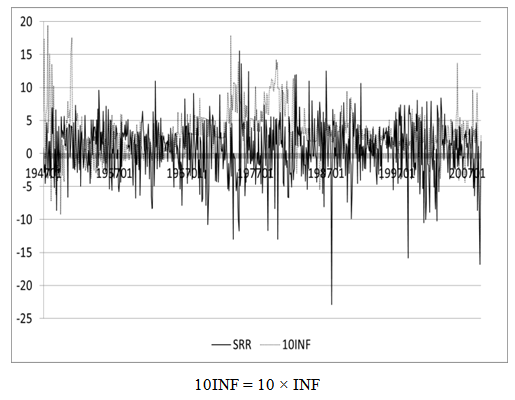 | Figure 2. Real stock returns vs. inflation |
5. Empirical Results
Before running our four-variable VAR, we perform unit root tests for all variables in our three sample periods: full period, pre-1980 period and post-1980 period. For brevity, we do not present the full results here. We find that all series are stationary in each period.
5.1. Dynamic Relationship between Stock Market and Inflation for the Full Sample Period
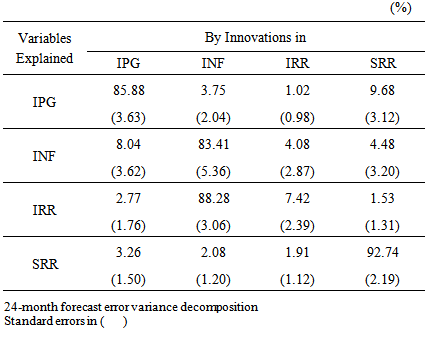
Table 3 reports the percentage of 24-month forecast error variance in IPG (industrial production growth), INF (inflation rate), IRR (real interest rate) and SRR (real stock returns) explained by innovations in each variable for the full sample period (1947:01 – 2008:12). The 24-month forecast error variance of SRR is most explained (92.74%) by its own innovations in our VAR system, as in Lee (1992). Further, SRR accounts for about 9.7% of variance in IPG. However, we fail to find a significant explanatory power of SRR for INF or explanatory power of INF for SRR, consistent with Lee (1992). Table 3. Variance Decomposition for the Full Sample Period
 |
| |
|
Figure 3 plots the selected impulse responses from our VAR system for the full sample period. The response of SRR to the shock in INF is insignificant, consistent with the variance decomposition results in Table 3, supporting the Fisher effect that common stocks are hedges against inflation. Our results are at odds with Fama (1981), and Geske and Roll (1983), but consistent with Lee (1992). Moreover, the positive response of INF to the shock in IPG comes into complete conflict with Fama (1981). 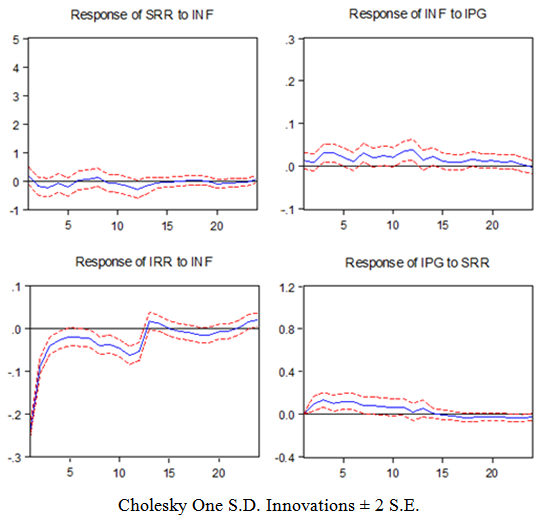 | Figure 3. Selected Impulse Responses from the Full Period |
The response of IPG to the shock in SRR is significantly positive in the short-run and turns to be insignificant from the seventh month. This result implies that stock market rationally leads real activity, consistent with Fama (1981), Geske and Roll (1983), and Lee (1992). Interestingly, we find that INF exhibits substantial explanatory power for IRR in Table 3. It is surprising that about 90% of forecast error variance in IRR is explained by innovations in INF. In Figure 3, to the shock in INF, IRR displays significantly strong negative response in the short-run, and then quickly recovers but maintains negative response for about one year.
5.2. Comparison of Dynamic Effects of Monetary Policy between Two Sub-Periods
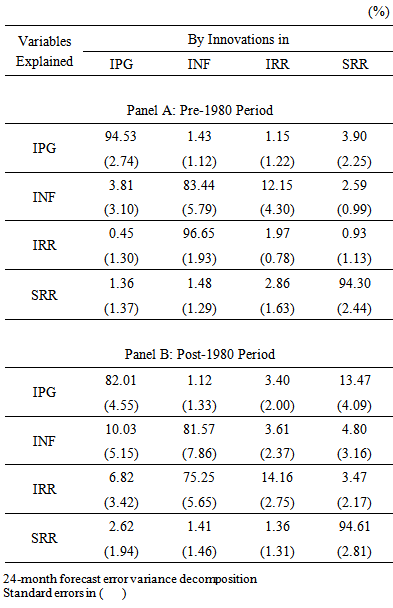
Table 4 reports the percentage of 24-month forecast error variance in IPG, INF, IRR and SRR explained by innovations in each variable in pre-1980 and post-1980 periods.Table 4. Variance Decomposition for the Sub-Periods
 |
| |
|
From Table 4, we can find the following three differences between two periods. First, the most remarkable difference between the two periods is found from the relationships between IRR and INF. In the pre-1980 period, innovations in INF explain 97% of forecast error variance in IRR while innovations in IRR explain 12% of forecast error variance in INF. In the post-1980 period, INF still explains large pro-portion of forecast error variance in IRR, but it is reduced to 75%. In addition, innovations in IRR lose the explanatory power for INF. Second, IPG does not significantly explain forecast error variance in INF and IRR in pre-1980period while explaining significantly in the post-1980 period. Third, explanatory power of IRR for its own forecast error variance become substantially greater in the post-1980 period than in the pre-1980 period. Figure 4 plots the selected impulse responses from our VAR system for pre-1980 and post-1980 periods. Two panels in Figure 4 reveal two important differences between the two sub-periods. First, the responses of INF and IRR to the shock in INF appear to last about a year in the pre-1980 period while disappearing in three months in the post-1980 period. These results imply that real interest rates absorb inflation shocks much more quickly in the post-1980 period than in the pre-1980 period. The responses of IRR and INF to the shock in INF look like mirroring each other.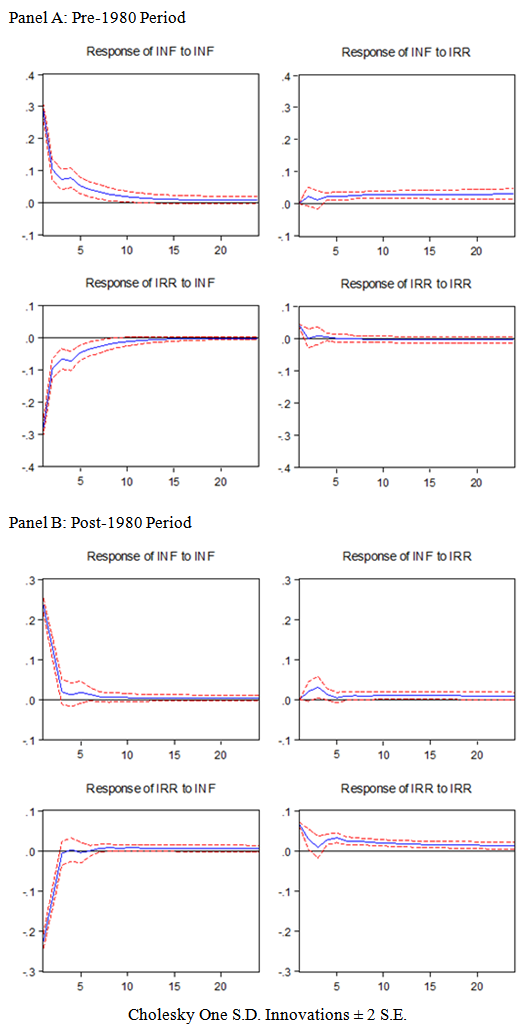 | Figure 4. Selected Impulse Responses from the Sub-Periods |
Second, in the pre-1980 period, IRR initially responds very weakly to its own shock and disappears shortly after the shock. However, response of INF to the shock in IRR is significant from fourth month and then persistent for the long-run. On the other hand, in the post-1980 period, response of IRR to its own shock becomes more sensitive and stays significant and positive for the long-run while response of INF to the shock in IRR seems to be no more significant or at most marginally significant. Simply speaking, IRR shocks affect INF with no impact on IRR for the pre-1980 period, and the opposite is true, IRR shocks affect IRR with no impact on INF, for the post-1980 period. In other words, to remove or reduce the inflation, the monetary policy was ineffective in the pre-1980 period while effective in the post-1980 period. These two differences in the dynamic relationship between IRR and INF indicate that the Fed reacts more aggressively to the expected inflation in the post-1980 period than in the pre-1980 period. The Fed raises interest rates as high as or more than the expected inflation so that economy can quickly remove the impact of inflation on overall economy in the post-1980 period, unlike in the pre-1980 period. Our findings are consistent with the well-known fact that the Fed has more aggressively responded to inflation since 1980 than before 1980.
5. Conclusions
We first examine the dynamic relationship among real activity, inflation, interest rates and stock returns for the period from 1947 to 2008 by employing a vector autoregression (VAR) system. We test the Fisher effect using the more extended sample period than the previous works, and use a different approach from the previous works, and thus this paper adds additional contribution to the existing literature.We find no significant relationship between real stock returns and inflation. This finding supports the Fisher effect that common stocks are hedges against inflation. The relationship between stock returns and inflation has long been a puzzle that’s not clearly solved. Since the World War II, much evidence of negative relationship between stock returns and inflation has been reported. With the extended sample period, however, our findings confirm the Fisher effect in the stock market. We also find that innovations in stock returns significantly explain the forecast error variance in real activity, and that real activity also significantly and positively responds to the shock in stock returns. This is consistent with the views that stock markets rationally signal real activity.Furthermore, we investigate the effects of changes in the monetary policy rule of the Federal Reserve (Fed) by comparing the relationship of interest rates to inflation between the pre-1980 and the post-1980 periods. We find remarkable differences between two periods. First, real interest rates absorb inflation shock much more quickly in the post-1980 period than in the pre-1980 period. Second, the monetary policy was ineffective in the pre-1980 period while effective in the post-1980 period to remove or reduce the inflation. These findings are the evidence of more aggressive reaction to the expected inflation and of more stabilized economy by more aggressive monetary policy of the Fed in the post-1980 period than in the pre-1980 period. The Fed raises interest rates enough to cover the expected inflation in the post-1980 period, unlike in the pre-1980 period.
ACKNOWLEDGEMENTS
We are gratefully acknowledged the constructive comments and suggestions of anonymous reviewers.
References
| [1] | Berument, H., and Froyen, R. T., 2006. Monetary Policy and Long-term US Interest Rates, Journal of Macroeconomics, 28(4), 737-751. |
| [2] | Boivin, J., and Giannoni, M. P., 2006. Has monetary policy become more effective? Review of Economics and Statistics, 88(3), 445-462. |
| [3] | Clarida, R., Gali, J., and Gertler, M., 2000. Monetary Policy Rules and Macroeconomic Stability: Evidence and Some Theory, Quarterly Journal of Economics, 115(1), 147-180. |
| [4] | Dennis, R., 2006. The policy preferences of the US Federal Reserve, Journal of Applied Econometrics, 21(1), 55-77. |
| [5] | Fama, E. F., 1981. Stock returns, real activity, inflation and money, American Economic Review, 71(4), 545-565. |
| [6] | Fisher, I., 1930. The Theory of Interest, New York. |
| [7] | Geske, R., and Roll, R., 1983. The fiscal and monetary linkage between stock returns and inflation, Journal of Finance, 38(1), 1-33. |
| [8] | Jaffe, J. F. and Mandelker, G., 1976. The "Fisher Effect" for Risky Assets: An Empirical Investigation, Journal of Finance, 31 (2), pp. 447-458. |
| [9] | James, C., Koreisha, S., and Partch, M., 1985. A VARMA analysis of the causal relations among stock returns, real output, and nominal interest rates, Journal of Finance, 40(5), 1375-1384. |
| [10] | Lee, B. S., 1992. Causal Relations among Stock Returns, Interest Rates, Real Activity, and Inflation. Journal of Finance, 47(4), 1591-1603. |
| [11] | Mehra, Y. P., 1999. Forward-looking monetary policy reaction function, Federal Reserve Bank of Richmond Economic Quarterly, 85(2), 33-53. |
| [12] | Ram, R., and Spencer, D. E., 1983. Stock returns, real activity, inflation and money: Comment, American Economic Review, 73(3); 463-70. |
| [13] | Stulz, R. M., 1986. Asset pricing and expected inflation, Journal of Finance, 41(1), 209-223. |
 Abstract
 Reference
 Full-Text PDF
 Full-text HTML