-
Paper Information
- Next Paper
- Previous Paper
- Paper Submission
-
Journal Information
- About This Journal
- Editorial Board
- Current Issue
- Archive
- Author Guidelines
- Contact Us
American Journal of Economics
p-ISSN: 2166-4951 e-ISSN: 2166-496X
2014; 4(2A): 51-72
doi:10.5923/s.economics.201401.05
The Impact of Exchange Rate Movements on Firm Value in Emerging Markets: The Case of Mexico
 Abstract
 Reference
 Full-Text PDF
 Full-text HTML
Chrystell Flota
Center for Border Economic Studies, The University of Texas - Pan American
Correspondence to: Chrystell Flota, Center for Border Economic Studies, The University of Texas - Pan American.
| Email: |  |
Copyright © 2014 Scientific & Academic Publishing. All Rights Reserved.
Using a sample of publicly-traded non-financial firms from Mexico (some with international activities and some without), I examine the impact of exchange rate movements on the equity value of individual firms and identify the determinants of exposure. I find significant levels of currency exposure by industrial sector. At the individual firm level, mid-size firms show less exchange rate exposure than small- or large-size firms. Also, results show a significant negative relationship between currency exposure and level of international sales. In a sub-period, currency exposure is negatively related to foreign-currency denominated liabilities. The results suggest that firms that engage in international activities and hold debt in foreign currency are significantly less sensitive to exchange rate movements than firms that rely primarily on domestic sales.
Keywords: Currency exposure, Exchange rate exposure, Firm value
Cite this paper: Chrystell Flota, The Impact of Exchange Rate Movements on Firm Value in Emerging Markets: The Case of Mexico, American Journal of Economics, Vol. 4 No. 2A, 2014, pp. 51-72. doi: 10.5923/s.economics.201401.05.
Article Outline
1. Introduction
- It is a widely held belief among financial theorists, economic analysts, empirical researchers, and even the financial press, that fluctuations in the exchange rate ought to affect firm value. The conventional wisdom is that currency swings have direct, observable impacts on firms that have some type of international operation. A better understanding of the relationship between currency fluctuations and returns in financial markets is relevant for practical and academic reasons. On a practical level, the financial press regularly cites financial analysts’ and company executives’ expectations that movements in the currency exchange rate will directly impact the performance of firms with international activities. The academic perspective is similar to that of the practitioners: standard economic thinking suggests that fluctuations in currency exchange rates can affect the profitability and value of firms with foreign sales or liabilities in foreign currencies because such movements affect a firm’s cash flow expectations. The empirical record suggests there is broad consensus of a low correlation between exchange rate movements and stock returns. There is far less agreement as to why this is the case. One potential explanation is that a large fraction of studies use U.S. data—one of the least open economies (De Jong, Ligterink and Macrae 2002). Indeed, the literature on the economic importance of currency exposure on firm value has primarily focused on developed economies and particularly on the U.S. (Drummen and Zimmerman 1992, Bartov and Bodnar 1994a, Beckers, Connor and Curds 1996, Solnik 2000, Griffin and Stulz 2001). Only a small number of studies incorporate data from developing economies (Dominguez and Tesar 2001a, 2001b, and 2006). Doidge, Griffin, and Williamson (2006) analyze a large sample that combines developed and emerging economies and find that although firms with international activities exhibit some currency exposure, overall, fluctuations in the currency do not explain a large portion of firm value variation.Another potential explanation for the low correlation between currency fluctuations and stock returns is that the influence of the real exchange rate on the individual firm is not as straightforward as traditional theory suggests. According to the traditional view, a decline in the currency’s real exchange rate tends to improve that nation’s competitiveness by making its products cheaper abroad. This stimulates exports and increases the income of exporting and import-competing firms, thus boosting the average level of stock prices. From a macroeconomic standpoint, this argument suggests that the local stock market should react favorably to a depreciation of its currency. However, at the firm level, the literature shows that exchange rate exposure is difficult to identify and that its determinants could be rather complex (Jorion 1990, Amihud 1994, Choi and Prasad 1995). Empirically, depreciation of the domestic currency is not always good news for exporting and import-competing firms. The ultimate impact of an exchange rate movement on firm value could depend on the complex interaction between the geographical distribution of the firm’s activities, the currency structure of its exports and imports, and the currency composition of its corporate debt.The objective of this paper is to examine the impact of exchange rate movements on the equity value of individual firms and to identify the determinants of exposure; to isolate these effects, I focus on firms from Mexico, an emerging economy. I use a two-stage model to analyze the relationship between exchange rate exposure and firm value. The empirical results show that, at the individual firm- and industrial-sector level, there is significant exchange rate exposure for most firms in the sample. The results show a significant negative relationship between currency exposure and international sales. In a sub-period, I find a significant negative relationship between currency exposure and foreign-currency denominated liabilities. This suggests that firms with higher levels of both international sales and debt in foreign currency are significantly less sensitive to exchange rate movements than purely domestic firms and firms with lower levels of foreign debt. My contribution is twofold. First, I study Mexico, which provides a clean test of the relationship between currency exposure and firm value because it is a small open economy with a predominant bilateral exchange rate and a history of large currency fluctuations. My second contribution is that I include firm-level data from both sides of the balance sheet. The data includes revenues from exports and corporate debt denominated in U.S. dollars—the former variable is typically estimated by proxies and the latter is virtually non-existent in the previous research. This paper proceeds as follows: In section 2, I describe exchange rate risk, differentiate it from corporate exposure and delineate how the exchange rate and exposure affect firm value. Section 3 outlines the research questions and hypotheses. In section 4, I specify the two-stage model and methodology. In section 5, I discuss the advantages of using firm-level data from a developing economy such as Mexico. In section 6, I describe characteristics of the Mexican stock market, the data and sample selection. Section 7 reports the empirical results and, finally, section 8 concludes.
2. Definitions: Exchange Rate Risk, Exposure and Firm Value
- Below, I discuss working definitions for risk and uncertainty and examine the empirical evidence on the relationship between exchange rate risk, exposure, and the value of the firm.
2.1. Exchange Rate Risk and Exposure
- The concept of exchange rate risk stems from the notion of risk as uncertainty. If investors knew ahead of time the price of a foreign stock at some specific future date as well as the future exchange rate between the home and the foreign currency, by definition, there would be no risk. Unfortunately, it is impossible to make such predictions with any degree of certainty. In this sense, exchange rate risk refers to unforeseen variations in a currency’s purchasing power relative to its initially expected value at some specific future date.Exchange rate risk and currency exposure, however, are not synonymous. While currency risk is associated with randomness, currency exposure refers to what the individual firm may have at stake. So, from the perspective of the firm, exposure is the sensitivity of the firm’s value to changes in the exchange rate. Dumas (1978) is the first to explicitly differentiate risk from exposure in these terms, but it is Adler and Dumas’ (1984) that expounds on this distinction and specifies exposure as the slope coefficient from a regression of stock returns on exchange rate changes, controlling for the market return. Further, the currency exposure that I analyze in this paper is classified as a type of economic exposure known as operating exposure, which is concerned with how the value of the firm fluctuates as a result of changes in real exchange rates (for a more detailed discussion of these types of exposure, see Shapiro 1999, and Sercu and Uppal 1995). These changes can have a long-run impact on the firm because they have the potential to affect the competitiveness of the firm, which affects the firm’s expected future cash flows and hence its value. Reducing a firm’s exposure to this long-run version of economic exposure is possible but more difficult than protecting the firm from short-term currency fluctuations, which can be hedged.
2.2. Exchange Rates and Firm Values
- The value of the firm equals the present value of all expected future cash flows. If a change in the foreign currency exchange rate affects a firm’s expectations of current and future cash flows, it can directly impact the market value of its equity. It is this concept to which I refer as “firm value” in this paper. The complexities of the relationship between exchange rate changes and firm value are compounded by whether the firm has assets abroad or liabilities denominated in a foreign currency, or both. Thus, the firm’s exposure, or sensitivity of its value to changes in the exchange rate, could vary significantly depending on the geographical location of its assets and the currency composition of its corporate debt.
2.3. Macro- and Microeconomic Implications of Currency Exposure
- Exchange rates affect profitability through many routes. At the firm level, the most obvious avenues of transmission are via financial assets and liabilities (most notably debt) denominated in foreign currency and from international sales or other operations abroad. However, from a macroeconomic perspective, exchange rates also can impact the profitability of non-trading domestic firms (i.e. with no foreign currency revenues or costs) through their effect on foreign competition and domestic macroeconomic conditions such as fluctuations in aggregate demand, employment and output. Thus, a potentially wide range of firms could be exposed to movements in foreign exchange rates, regardless of their direct financial exposure.
3. Research Questions and Hypotheses
- The objective of this paper is to answer the following research questions: To what extent are firms exposed to exchange rate fluctuations? Do firm-level differences in exposure to currency fluctuations have measurable effects on firm value? Most importantly, what is the source of this exposure? It seems plausible that a firm’s exposure might come from a combination of the characteristics of the firm itself and the firm’s decision to engage in activities that result in revenues or costs (or both) denominated in foreign currencies. Three testable hypotheses can be derived from these plausible sources of exposure.
3.1. The Firm Characteristics Hypothesis
- Exposure is specified as the slope coefficient that results from regressing stock returns on changes in the exchange rate. Depending on the direction of the correlation between those two variables, currency exposure can be positive, negative, or zero (theoretically, a firm’s returns could be uncorrelated with the exchange rate). An issue with this approach is that the exposure coefficient may be insignificant when you aggregate all firms in the sample. To address this potential issue, researchers have resorted to grouping firms by certain characteristics, notably industry sector and firm size, in an attempt to obtain a less noisy estimate of their level of exposure. My first hypothesis is that certain firm characteristics, namely industrial sector affiliation and firm size, are correlated with exchange rate exposure. Industrial sector affiliation has been correlated with exposure in theory (Marston 2001) and in empirical research (Bodnar and Gentry 1993, Griffin and Stulz 2001, Dominguez and Tesar 2006). Typically, firms within the same industry tend to exhibit wide variations in exposure coefficients, suggesting the need to incorporate other firm characteristic variables that might explain these differences, such as size. The idea that larger firms have greater exposure to currency fluctuations, has led to a distinct bias in much of the earlier research toward large exporters or multinationals in the U.S. and abroad (Jorion 1990, Amihud 1994, Choi and Prasad 1995). Some studies have found that exposure increases as firm size increases (He and Ng 1998). Others have found that smaller firms tend to have more exchange rate exposure (Dominguez and Tesar 2006, Doidge et al. 2006). Note that size is an ambiguous variable in that larger firms may have more international activities (more exposure) but also be more likely to hedge (less exposure) than the smaller firms (Allayannis and Ofek 2001).
3.2. The International Sales Hypothesis
- My second hypothesis is that firms with international sales are more likely to be exposed to fluctuations in the exchange rate. The direction of the exposure is less clear. Firms with international sales might benefit from a depreciation in the domestic currency. Assuming no changes to the exporting firm’s sales, such a firm derives gains because its expenses are not immediately affected by the devaluation, yet its revenues increase in proportion to the devaluation of the currency. Economic theory further suggests that a depreciation of the domestic currency will lower the international price of the goods the firm exports, increasing its competitiveness. However, firms with international sales tend to be larger firms and these have been shown to hedge their exposure to exchange rate risk (Allayannis and Ofek 2001).To the extent that domestic firms are import-competing (i.e. a domestic firm that competes with firms that import goods from abroad), a depreciation in the currency might increase their competitiveness, increase demand for the goods they provide, and have a net positive impact in their stock prices. However, purely domestic firms in developing economies face some additional challenges. A depreciation in the value of an emerging country’s currency often signals more fundamental problems. Events that affect the domestic currency and the stock markets are closely related to the emerging country’s economic and political situation. It is reasonable to conjecture that if domestic firms are adversely affected by currency depreciations, it may be because declines in the currency value might often be accompanied by economic contractions.
3.3. The Foreign Currency Debt Hypothesis
- My third hypothesis is that firms with debt in foreign currency will be affected by changes in exchange rates. It is difficult to predict the direction of the impact that a depreciation in the domestic currency will have on exporting and domestic firms that hold foreign currency debt. On the one hand, the theory and some empirical evidence suggest that multinational firms with foreign currency debt might experience lower levels of exposure to currency fluctuations (see De Jong, Ligterink and Macrae 2002). Whether exporting firms with foreign debt benefit following a depreciation of the domestic currency, largely depends on the degree to which their export gains offset the additional costs of servicing their foreign debt. As outlined above, economic theory suggests that a depreciation in the domestic currency will increase the competitiveness of the net-exporting firm. One might expect that the increased sales thus generated might override the additional costs of their foreign debt. In terms of domestic firms that hold foreign debt, the empirical evidence is virtually nonexistent. However, one might expect that, if a currency depreciation is followed by an economic contraction—as they often are in developing economies—a firm with revenues and expenses in domestic currency will have difficulty servicing foreign currency denominated debt. Such firms would be negatively impacted by the depreciation in the domestic currency.
4. Model and Methodology
4.1. The First Stage: Measuring Exposure
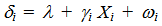
- A two-stage model, based on the empirical form of the CAPM, has become standard in the extensive literature on exchange rate exposure. In this model, a firm is considered exposed to exchange rate risk if its stock returns are correlated with changes in currency values (Dumas 1978, and Adler and Dumas 1984). In the first stage of this model, the objective is to first determine whether there are cross-sectional differences in exposures to currency fluctuations. Exposure is defined as the value of the δi coefficient resulting from the following regression:
 | (2) |
4.2. The Second Stage: Estimating the Determinants of Exposure
- In the second stage, the objective is to determine whether currency exposure is correlated with significant differences in stock returns. Specifically, I regress the estimated firm-level exchange rate exposure coefficient, δi, from equation (1) on a series of potential firm-level explanatory variables that might help explain some possible channels of exposure.
 | (2) |
5. Relevance of the Mexican Market
- Several arguments can be made for Mexico as an ideal study in the effort to understand the mechanism through which stock returns reflect exchange rate fluctuations. From an empirical perspective, the Mexican market presents several advantages that enable a more focused look at these effects. (a) The open-economy macroeconomics argument. A plausible argument that might account for the unconvincing empirical evidence on how currency fluctuations affect firm values is that most of the earlier studies involved predominantly large U.S. firms (Jorion 1990, Amihud 1994, Choi and Prasad 1995), or other large developed markets. Bodnar and Gentry (1993) argue and find evidence to support the notion of open-economy macroeconomics. That is, studies involving firms in relatively smaller and more open economies (than the U.S.) are subject to greater foreign currency exposure and thus are better suited in studies of this kind. Bodnar and Gentry find that firms from Canada and Japan exhibit greater exchange rate exposure than U.S. firms. Canada and Japan, while smaller markets than the U.S., remain large, liquid, and highly developed economies. Perhaps we can gain greater insights into the currency exposure-firm value relationship by using data from an even smaller and open emerging economy such as Mexico. Data from the Organisation for Economic Co-operation and Development (OECD) shows that Mexico is the most open economy in the Americas after Canada as measured by imports and exports per GDP (OECD 2005). The open-economy macroeconomics argument suggests that Mexican firms are more likely to face significant currency exposure, making them more suitable for examining how currency swings affect firm value. (b) Data availability. Having reliable sources of firm-level data that are comprehensive in scope has been the Holy Grail in international finance studies. This is particularly true of corporate financial statements data. Databases such as Datastream and Worldscope provide a broad breadth of coverage for international firm-level data, but it comes at the cost of depth: They tend to cover a wide range of countries, but only for a sub-segment of firms (there is a bias in favor of the largest firms that have some type of international activity, such as exports or the issuing of ADRs) and in some cases, for a sub-segment of variables (a selection from what is reported in financial statements in the country of origin). This has led to the widespread use of proxies that substitute for the unavailable variables and to a proliferation of studies that, though wide in scope (Dominguez and Tesar 2001a, 2001b, 2006; Doidge, Griffin and Williamson 2006), are lacking in firm-level detail. A key contribution of this paper is that by compiling data from the Emerging Markets Database (EMDB) and the Mexican Stock Exchange (BMV), I am able to obtain firm-level data from both sides of the balance sheet for publicly traded Mexican firms. The data include revenues from exports and corporate debt denominated in U.S. dollars—the former variable is typically proxied and the latter is virtually non-existent in the exposure literature. An advantage of focusing on firms from a single country is that it is possible to explore at a deeper level the question of why some firms might be more exposed to currency fluctuations than others. (c) The mismatch problem argument. A consequence of the data issues outlined above is that in many studies there is a mismatch between the foreign exchange rate used for firms of a certain country and where the assets and liabilities of those firms really are. Case in point, for a sample of approximately 47 countries (18 largely developed countries and 29 mostly developing countries), Doidge, Griffin and Williamson (2006) use market and financial data from Datastream and Worldscope, respectively, and foreign exchange rates from the Bank of England. For the overwhelming majority of developing countries (including Mexico, Chile and Brazil, as well as Hong Kong and Singapore), the Bank of England (BOE) does not appear to report the principal bilateral exchange rate. The authors explain that for those “countries marked with an asterisk (*) [they] do not have BOE rates and the Japanese Yen bilateral rate is used instead” (Doidge et al. 2006, p. 559, table 2). It seems plausible that Hong Kong and Singapore may have significant international trade and other connections with Japan and, as such, the bilateral Yen rate might be representative of the source of firm-level revenues and costs. However, it is less likely that the same would be true for Mexico, Chile and Brazil.Using data from a country like Mexico has the unusual advantage of matching extraordinarily well the bilateral exchange rate with its principal trading partner (approximately 80 percent of Mexican exports go to the U.S.). This connection goes beyond the direction of trade. In fact, the corporate and financial ties between the U.S. and Mexico go very deep. Martinez and Werner (2002) find that foreign investors in Mexico, who are mostly U.S. nationals, account for more than 27 percent of holdings and up to 75 percent of trading in the period from 1992 to 2000. U.S. investors are also the principal debt holders of Mexican corporate debt. For the period 1999 and 2000 Martinez and Werner find that 85 and 77 percent, respectively, of Mexican corporate debt was issued in dollars directly by U.S. banks or by other banks outside of Mexico. They also find that the share of dollar debt increased significantly even in the five-year period following the 1994 Peso crisis – a period characterized by a severe contraction in the Mexican banking system. All things considered, the evidence suggests that Mexico is unusual in that its Peso-dollar bilateral exchange rate is well matched with the currency denomination of the corporate income stream and debt obligations of a large majority of publicly traded Mexican firms. (d) Currency volatility argument. Mexico has a history of acute fluctuations in its currency. For instance, the Mexican economic crisis of December 1994 released the Peso from Central Bank intervention and enabled the currency to float. The economic crisis that followed in the 1994-95 period was the most severe in the modern history of Mexico and it showed that currency devaluations can be, and often are, associated with severe downturns in equity markets. Bailey, Chan and Chung (2002) point out that during the Peso crash the value of the currency declined from 3.4 pesos per dollar at the end of September 1994 to almost 7 pesos per dollar at the end of March 1995. Over the same six-month period, Teléfonos de México stock price dropped from $63 to $28 in a free-fall symptomatic of the experience of other Mexican publicly traded firms. By definition, in a free float exchange rate regime, the value of the currency is freely determined by the market and its fluctuations reflect actual and expected changes in demand and supply of assets and goods in the economy (Edwards 1999), as such, free float regimes introduce greater variability in the exchange rate (see Bartov and Bodnar 1994b, and Bartov, Bodnar, and Kaul 1996) and this might improve the chance to observe an effect in equity value. (e) The weather vane argument. Another advantage of using firm-level data from Mexico is that, in practice, Mexico acts as a barometer of the performance of other developing economies. Mexican equities make up approximately half of the 25 largest cap components in the International Finance Corporation’s emerging market equity index, and there is some indication that fluctuations in the Mexican currency are reflected in other Latin American equity returns (Bailey, Chan, and Chung 2002). An analysis of the effects of currency exposure on firm value for a sample of Mexican firms could shed light on the effects that currency fluctuations could have on firms from other emerging economies with similar characteristics.
6. Stock Market, Data and Sample
6.1. Mexican Stock Exchange
- The Bolsa Mexicana de Valores (BMV) is the second largest stock exchange in Latin America by market capitalization, behind the São Paulo Stock Exchange (for a detailed chronology of the BMV’s history, see the BMV website). Although the laws that restrict insider trading in Mexico are similar to those in the United States, there is evidence of widespread insider trading in the BMV. Bhattacharya et al. (2000) find that the stock price of firms traded in the BMV does not react to firm-specific news announcements. In fact, not much happens to a firm’s stock price on the day of an event. The evidence of insider trading raises real issues about the Mexican securities market, however, for purposes of this paper, the impact of insider trading is likely to be small since the key variable of exchange rate exposure is defined as a function of an exogenous variable.
6.2. Classes of Shares
- Like many developing equity markets, the Mexican market has various restrictions on equity ownership. The multiple classes of shares (or “share series” as per the BMV) are designed to limit the influence of foreign investors and enable individual domestic investors to maintain control on Mexican corporations. In addition to discriminating between foreign and domestic investors, share classes also distinguish between individual and institutional investors, as well as between general and financial issuers. Some share series that are relevant for this study are as follows: A Series: Ordinary series reserved only for Mexican individual investors. These shares have full voting rights and must collectively represent the majority of voting shares (unrestricted). Class A shares cannot be held directly by foreigners; however, these shares may be acquired indirectly by foreign investors via American or Global Depository Receipts (ADRs or GDRs, for those few firms that issue stock in equities markets abroad—most frequently in the New York Stock Exchange for Mexican ADRs) or through CPO series—class A shares held in trust and denominated as “neutral fund” holdings by the BMV (see CPO series, below). B Series: Ordinary series open to all investors, foreign and domestic. Like A shares, these shares have full voting rights (unrestricted), but collectively may not exceed half of voting shares. Foreigners may hold Class B shares directly. CPO Series: Ordinary series open to all investors. CPOs, Certificados de participación ordinaria (ordinary participation certificates), are essentially class A shares without the voting rights (restricted). The Mexican equity market allows foreign investors to buy shares reserved for domestic investors indirectly via the state-owned development bank (Nacional Financiera S.A., or Nafinsa, by its Spanish abbreviation). The Nafin trust passes all shareholding benefits to the foreign investors except for the voting rights, which it holds in trust for the individual investor. L Series: Ordinary series open to all investors. Class L shares are similar to class A shares but like CPOs they are restricted in that they limit the voting rights of all investors, foreign and Mexican nationals. Telmex, América Movil (the largest wireless phone company in Latin America), Iusacel (the number two wireless phone carrier in Mexico), and Coca-cola Femsa (Coca-cola bottling company) issue class L shares.
6.3. Data
- Stock return and market capitalization data for non-financial firms for the period between the first quarter in 1994 to the third quarter in 2003 are from the Emerging Market Database (EMDB). Domestic and foreign sales, total sales, total assets, Peso and foreign-currency liabilities (current and long-term) are from the BMV. The Indice de Precios y Cotizaciones (IPC) market index, the Peso-USD bilateral exchange rate, the real exchange rate (RER), and the Special Drawing Rights (SDR) basket exchange rate are from the Mexican Central Bank. All exchange rates are value-weighted. The Mexican Central Bank defines all exchange rates as Pesos per U.S. Dollar (e.g. the current spot exchange rate is approximately 11 Pesos per U.S. Dollar).The sample firms are classified by sector and industry as per the criteria followed by Global Financial Data, Inc. These classifications are based on business lines, as defined by principal sources of revenue (where sales or revenue breakdowns are available) or by principal products or services provided. When possible, I cross-reference and verify these classifications with other sources, such as Datastream and Worldscope as well as the S&P Industry Indices. For the sample period, I use 1994 as the initial year because I wanted to exclude several events that could potentially introduce econometric challenges into the sample. The first event I exclude is the period shortly before and during the wave of financial liberalization that roughly spanned the period between 1990-1991, because this process was associated with significant changes to corporate debt structure (debt composition is a fundamental explanatory variable for exchange rate exposure in this study). Second, Mexico was under a dual foreign exchange rate regime from September 1982 to the Peso crash of December 1994. During this currency regime, there were two contemporaneous foreign exchange rates: The official rate (applied to exports, most imports and debt service) and a free rate (for imports, tourist receipts generated by foreigners in Mexico and by Mexican nationals traveling abroad).Finally, I exclude the currency reform period from January 1st to December 31st, 1993. As a result of the highly inflationary pressures of the 1970’s and 1980’s, the Mexican Peso had a lot of zeros. In an effort to simplify foreign exchange, the government introduced the “new Peso”, worth 1,000 of the “old Peso”. For the full twelve months of that year, both currencies circulated in tandem until the “old Peso” was removed from circulation at the end of December and was completely replaced by the “new Peso” which, on January 1st 1994 became, the regular Mexican Peso. Thus, to circumvent econometric issues associated with multiple exchange rates and currencies, without excluding the Peso Crash of 1994, I designate 1994 as the initial year in the sample.
6.4. Sample Selection
- For this study it was important to reconcile the firm level stock return information from the EMDB with the firm level accounting information obtained from the Mexican Stock Exchange (BMV). During the sample period, there are 97 equities for which I have both accounting information from the BMV and stock return data from the EMDB. In the case of firms that issue more than one class of share, I selected the most representative and least restrictive of these shares by selecting the share class that had all or most of the following characteristics: (a) Ordinary voting rights; (b) The most widely traded type of share and/or that is traded through most of the sample period; and (c) The type of share that is available for foreign investment. These characteristics are sometimes complementary, with some firms having a share of stock that fulfills all three desirable characteristics. However, in some cases, the most widely traded type of share is not available to foreigners. In those cases, I chose the most widely traded type of share with ordinary voting rights, even if it was not available to foreign investors. The class of share criteria eliminated 18 equities. Curiously, in analyzing the data, four firms (Controladora Comercial Mexicana, Grupo Elektra, Empaques Ponderosa, and Grupo Carso) switched from one type of share to another for their most representative class of share. These switches exhibited clean breaks from one class of stock to another (with minimal differences in the type of stock), with no overlap between the trading of one class of stock and another, and with one week or less (usually from one day to the next) gap between the end of the trade of one and the beginning of the other. The stock price level for each firm may change from one share class to another, but I adjust for this by using percentage changes in stock prices. For each the four firms that switched share classes, I merged the time series of returns, reducing by four the number of equities in the sample. Finally, an additional four equities were eliminated from the sample because they had fewer than six months of data, for a final count of 71 equities in the sample period.
6.5. Summary Statistics
- Appendix A provides a breakdown by industrial code, sector and industry of all the firms in the sample, summarizes market capitalization (defined as stock price times the number of shares outstanding) by sector and includes ticker symbols and the complete legal corporate name of each firm as reported by the BMV.The sector and industry categories used in the appendix and in the empirical results tables mirror the official classifications of the BMV and follow the criteria set by Global Financial Data, Inc. These classifications are based on business lines, as defined by principal sources of revenue (where sales or revenue breakdowns are available) or by principal products or services provided. When the data is available, I cross-reference and verify these sector and industry classifications with other sources, such as Datastream and Worldscope as well as the S&P Industry Indices. Unless otherwise specified, company information regarding principal business activities, geographical areas of operation, and general background information, comes from the corporate firm profiles reported by the BMV. Appendix A shows there are wide discrepancies in the level of market capitalization by sector. The two smallest sectors, Energy and Healthcare, include each a single firm and together account for little over 1 percent of total market value in the sample. The Materials sector includes fourteen firms and as such accounts for nearly 20 percent of the sample firms. This sector includes some of the largest and well-known Mexican firms such as cement-products manufacturer Cemex and glass-products manufacturer Vitro. However, this sector accounts for less than 14 percent of market value of the sample firms.The Industrial sectors are divided into Capital Goods and Transportation sectors and together they represent more than 20% of the sample firms, but account for less than 10% of total sample market value. This share is surprisingly small given that the Capital Goods sector includes Internacional de Cerámica, one of the largest tile manufacturers in Mexico and the southern United States. The Capital Goods sector also comprises large industrial conglomerates such as Grupo Condumex, a large construction company (dedicated among other things to the construction of oil platforms) and Grupo Carso, a holding company for firms “dedicated to diverse areas of economic activity” (as per the BMV firm profile). The Grupo Carso holding company was built by Mexican billionaire Carlos Slim and it now controls, among numerous other groups and firms, Grupo Condumex and Grupo Sanborns (discussed in the Retail and Commercial Services sector, below). The Transportation sector includes the two major Mexican airlines, Aeroméxico and Mexicana, both of which were nationalized by the Mexican government following the Peso Crash of December 1994. At the end of 2005 (this is after the sample period included in this paper), Mexicana was sold to Grupo Posadas (discussed in the Retail and Commercial Services sector, below). The Consumer Discretionary sectors are divided into Retail and Commercial Services and Communication and Transportation Services. Together these sectors comprise nearly 23 percent of the sample firms but account for less than 14 percent of the market capitalization of the sample. The Retail and Commercial Services sector includes the large hotel chain Grupo Posadas, the restaurant and gift store chain Grupo Sanborns, and Grupo Elektra, which is controlled by Grupo Salinas. Grupo Elektra has carved a niche providing retailing and financial services for the mass market in Latin America; it captures an important share of the remittances from Latin American immigrants in the United States. Note, that all financial product firms are excluded from this sample. However, Grupo Elektra is a special case in that the micro-financing services it provides is within the context of a well-established retail chain. The Communication and Transportation Services sector includes the rival television channels, market leader Televisa—owned by the Azcárraga family and with substantial shares by Carlos Slim and his heirs (U.S. SEC 2005)—and TV Azteca—owned by Grupo Salinas and Grupo Elektra. The Consumer Staples sector is the largest and most diverse in the sample, with market share and capitalization at 27 percent each; this sector includes drugstores, supermarkets, beer and soft drink producers and bottling companies, producers of packaged foods and agricultural products. Many of these firms are market leaders in Mexico, Latin America, and in some cases, the world. Some notable firms in this sector are: the pharmacy chain Farmacias Benavides, the large hyper-market chains Grupo Gigante and Organización Soriana, the beer and soft-drink bottling firm Fomento Económico Mexicano, FEMSA, which includes Coca-cola FEMSA, the largest Coca-cola bottling company in Latin America. This sector also includes FEMSA’s key competitor Grupo Modelo, the market leader in the production and export of beer, firms Gruma and Maseca, the largest producers of corn flour and tortillas in the world, and Kimberly Clark de México, the Mexican subsidiary of the U.S.-based consumer-products company. Finally, the Telecommunication Services sector encompasses the lion’s share of the market value of the sample. Although this is one of the smallest sectors in the sample by number of firms (five of a sample total of 71), it accounts for more than one third of the market capitalization of the sample firms. This sector includes telecommunications giant and landline monopoly TelMex, Latin American leader in cellular service provider América Móvil, and the parent company of both, Carso Global Telecom, all of which are under the control of Carlos Slim and his heirs. This sector also includes the cellular service provider Grupo Iusacell, owned by the Salinas family of Grupo Elektra and TV Azteca. A notable absence in this sector is TelCel, the dominant cellular service provider in Mexico and part of the Carso Global Telecom parent company. TelCel is not publicly traded and as such is not part of this sample. Table 1 provides a summary of key statistics of the 71 equities in the sample. For each firm, the table reports the foreign sales ratio (total foreign sales divided by total sales), foreign liabilities ratio (foreign currency liabilities divided by total liabilities), and market capitalization (stock price times the number of shares outstanding, expressed as millions of US$). Firms with 25 percent or more foreign sales as a percent of total sales are denoted by the symbol
 . Firms that are entirely domestic in their operations (foreign sales as a percent of total sales equal zero) are indicated by the symbol
  . Nearly one third, 23, of the 71 firms in the sample have foreign sales of 25 percent or more of total sales. There is only one firm, U.S. Commercial Corp., for which one hundred percent of its sales are foreign sales. This firm held a controlling share of U.S. computer retailer CompUSA, which was sold to shareholders of Grupo Carso in July 2002 (as per the company profile reported by the BMV). U.S. Commercial Corp. also unusual in that it posts the highest level of foreign liabilities ratio, at 96 percent, among the firms in the sample. This firm is no longer publicly traded in the Mexican equities market.
 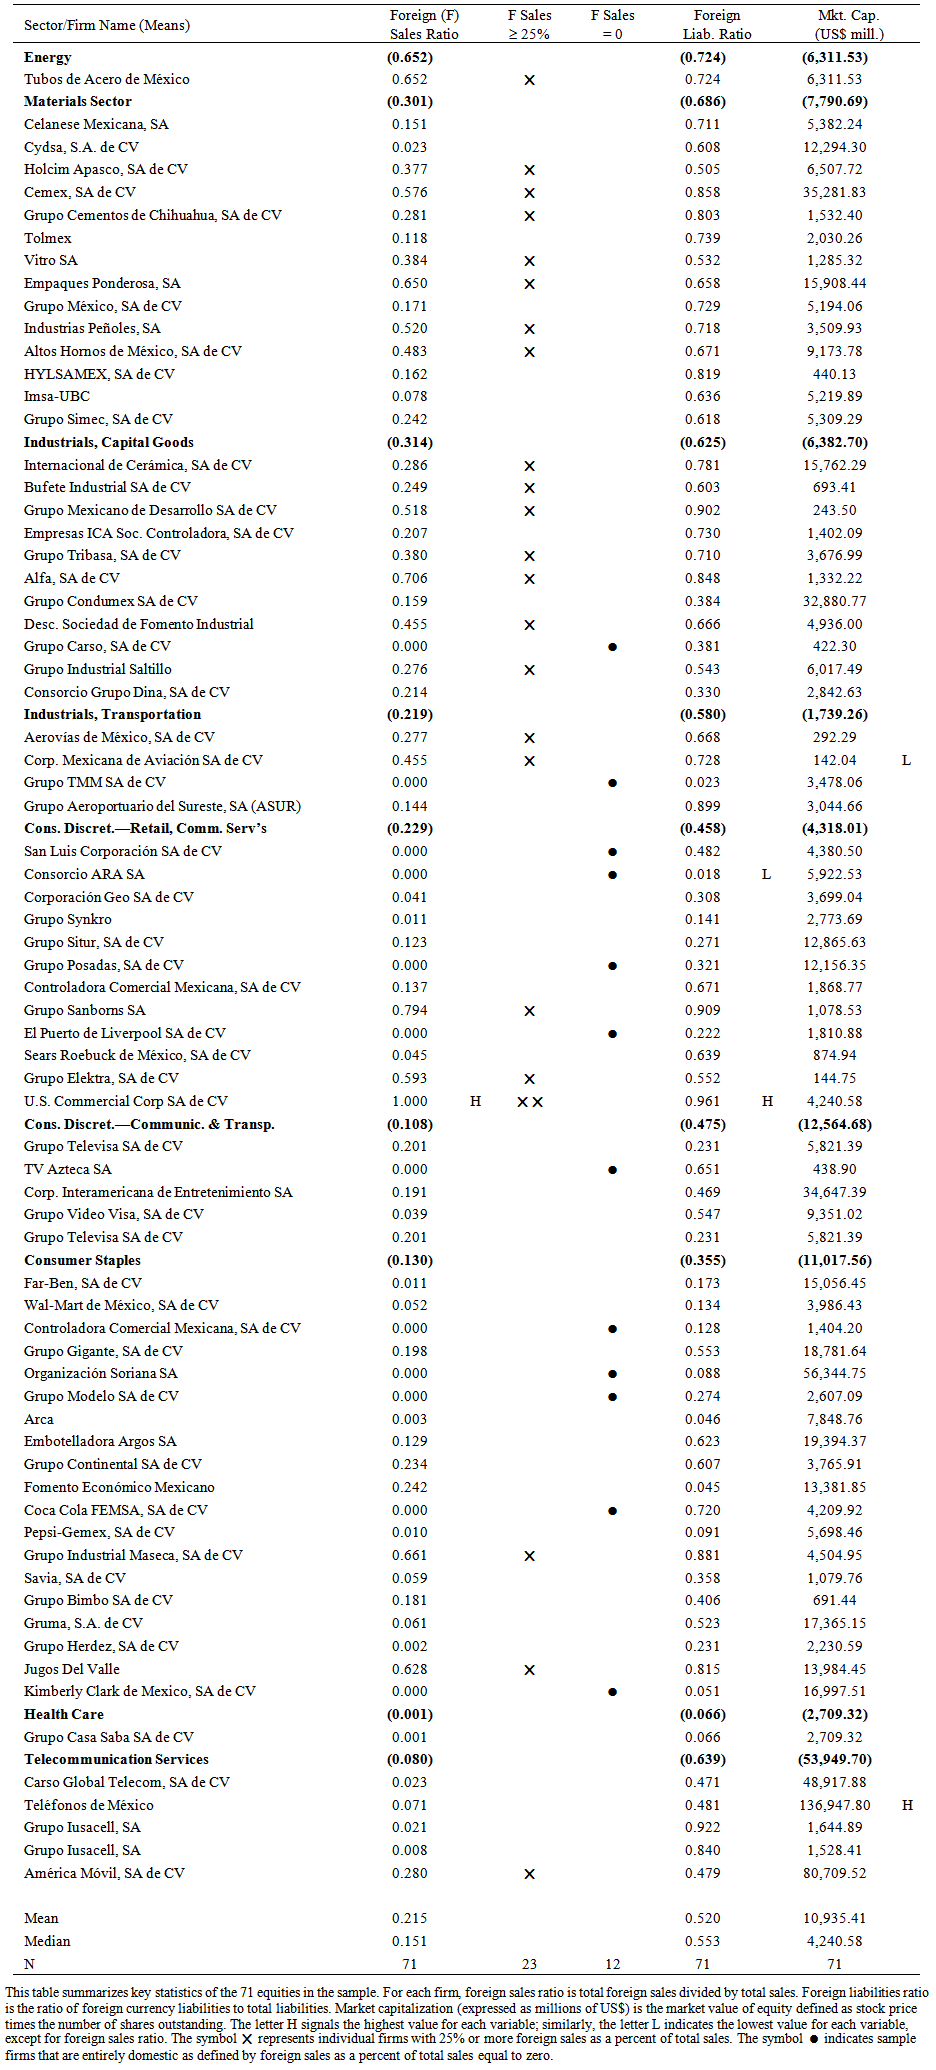 | Table 1. Summary Statistics |
7. Empirical Results
7.1. First-stage Regressions: Measuring Exposure
- Recall from section 4 that exposure is estimated as the value of the δi coefficient resulting from regressing firm-level returns on the market index and the currency exchange rate. Note that the Mexican Central Bank defines all exchange rates (spot, real, special drawing rights) as Pesos per the foreign currency or basket of currencies in question. To illustrate this reporting convention, assume the current exchange rate is 10 Pesos per U.S. Dollar and the Mexican currency depreciates by 50 percent; the exchange rate then will increase from 10 to 15 Pesos per U.S. Dollar. So, a depreciation in the currency is registered as an increase in the exchange rate. Table 2 shows the firm-level sensitivity of exposure to the bilateral spot Peso-USD exchange rate. The results show that more than one third (25 out of 71) of firms in the sample are significant at conventional levels. Further, the results show that nearly half (11 out of 25) of the firms with significant exposures have large value coefficients ranging from 1.02 to 5.11. For perspective, an exposure coefficient of 1.0 would result in a 1 percent increase in the firm’s stock return for a 1 percent change in the exchange rate. In Table 2, all of the significant coefficients have negative signs, indicating that these firms experience significant equity returns decreases with a depreciation in the domestic currency.
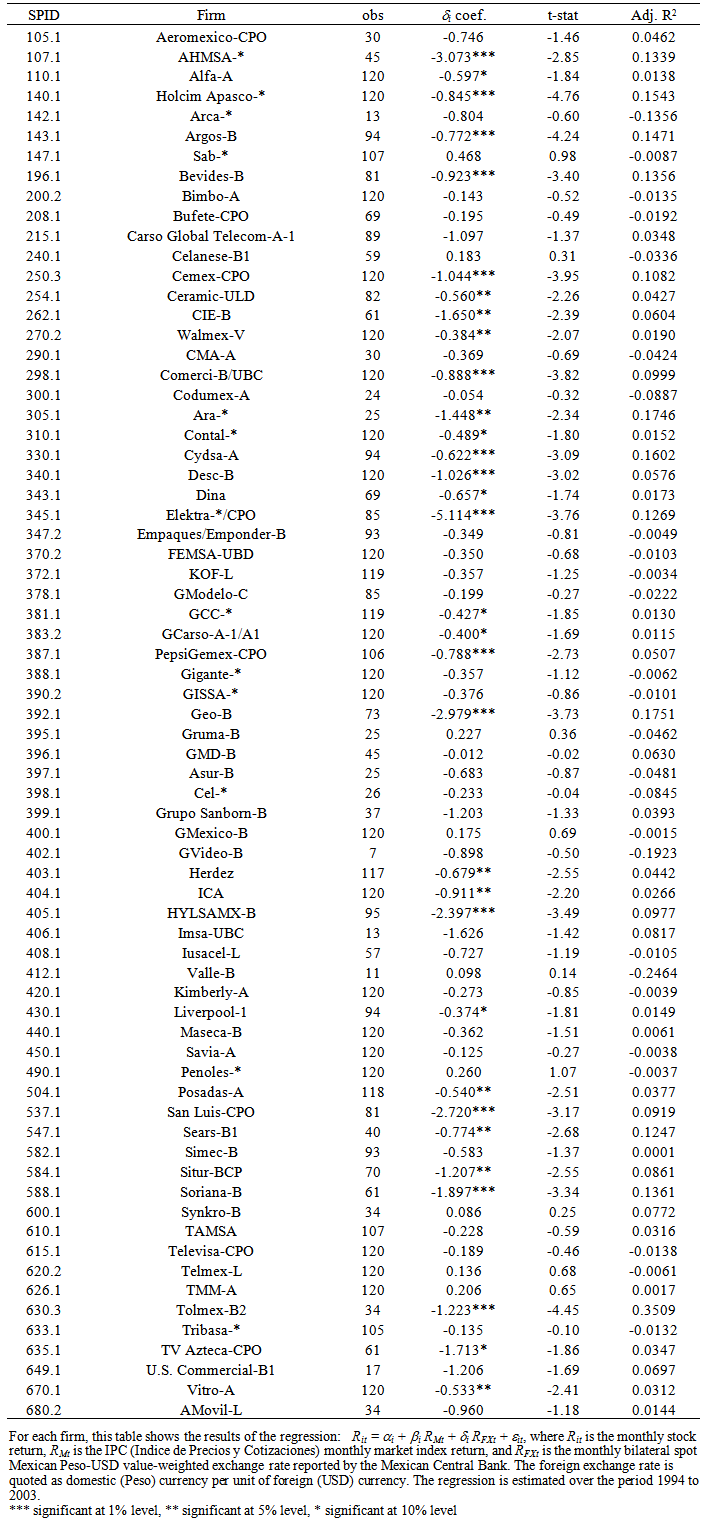 | Table 2. Firm Level Exposure |
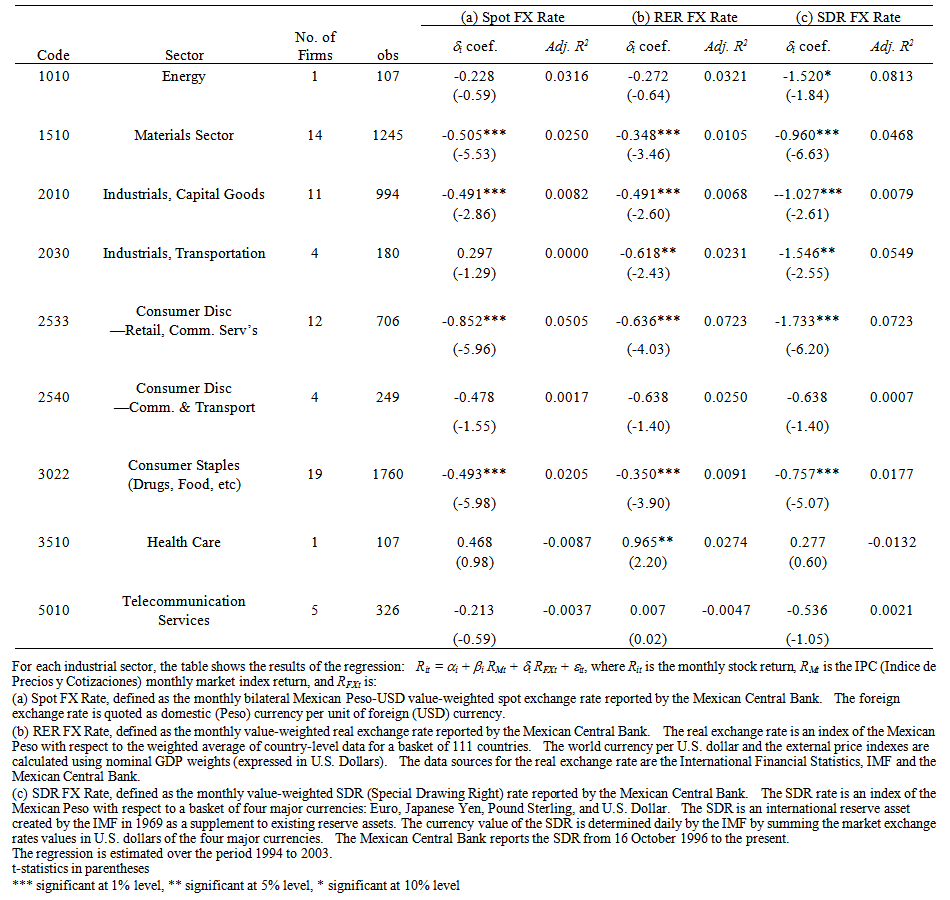 | Table 3. Measuring Exposure |
7.2. Second-stage Regressions: Determinants of Exposure
- The first-stage regressions have established that there is significant exchange rate exposure risk across a large cross-section of publicly traded Mexican firms. The next step is to explain such exposure. To do so, I regress the δi coefficient on the several variables for firm characteristics in regression (2) in section 4, above.
7.2.1. Size and Industrial Sector
- Firms’ characteristics such as size and industry affiliation have been found to be important determinants of exposure (Dominguez and Tesar 2006, Williamson 2001, respectively). Table 4 shows the results of regressing the dependent variable, the δi coefficient, on independent dummy variables for firm size. Recall that the δi coefficient measures the relative change in firm- or sector-level exposure that occurs as a result of changes in the exchange rate after conditioning on the market return. To test for size, the sample was divided into tertiles based on market capitalization (please refer to Table 1 Summary Statistics per firm and Appendix A for a summary of market capitalization means by industrial sector). Small-size firms have a market capitalization of less than $2.30 billion; mid-sized firms have a level of market capitalization between $2.52 and $7.34 billion; and large-size firms have a market capitalization between $7.79 and $136.50 billion, with TelMex being the largest firm in the sample by this measure. Dummy variables for mid- and large-size firms were included in the regression; they will be compared to the small-size firm category.
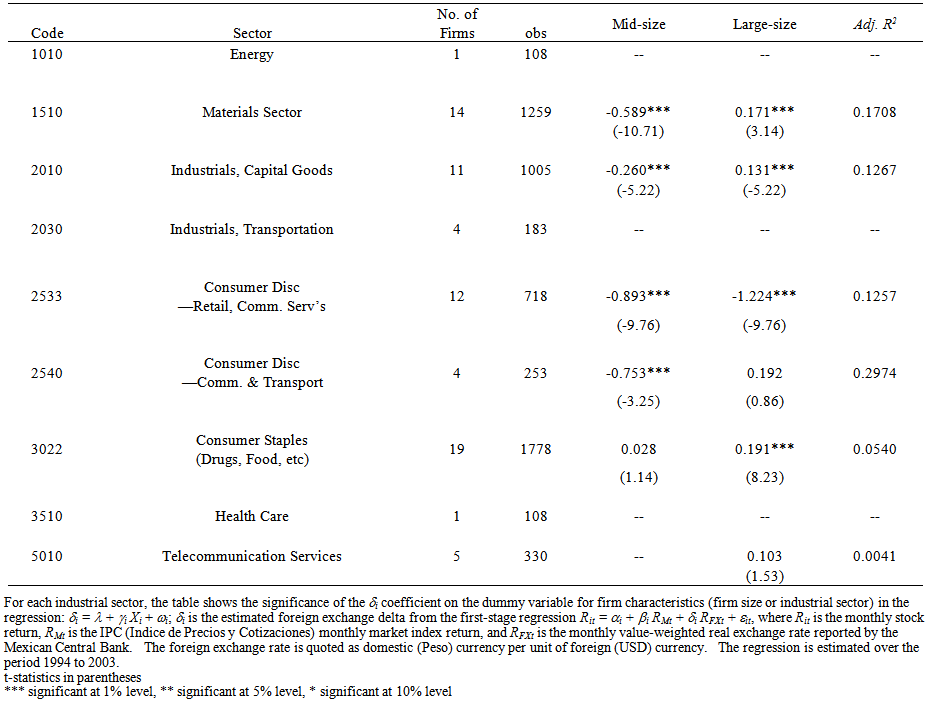 | Table 4. Determinants of Exposure by Sector and Firm Size |
7.2.2. International Sales and Foreign Currency Liabilities
- To understand the perplexing results of the previous section, I conduct cross-sectional regression analysis that might help explain the relationship between exchange rate exposure and a series of determinants identified in the literature. In each regression in Table 5, the dependent variable is the δi coefficient estimated from regression (2) in section 4, above.
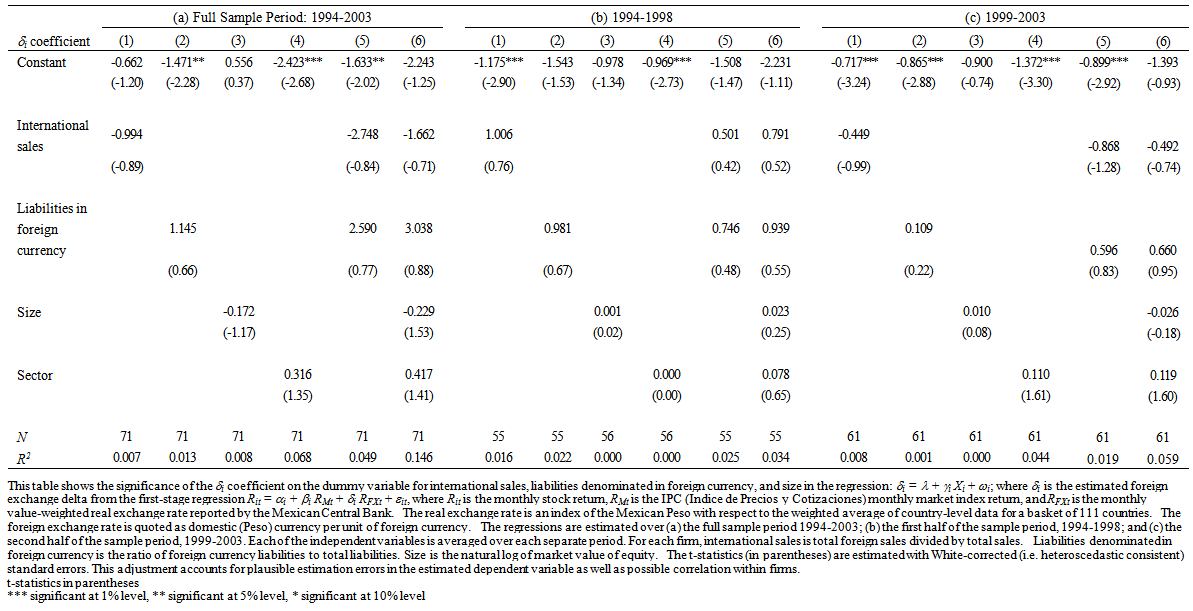 | Table 5. Determinants of Exposure at Firm level and by sub-Period |
7.2.3. Cross-sectional Time Series Regressions
- Table 6 (a) summarizes the cross-sectional time series regressions for the full sample period. The unit of measurement is a firm month. A firm’s level of International sales is negatively and statistically correlated with firm exposure. The R2’s are small and the level of statistical significance of the sales predictor is low, this result provides some support for the international sales hypothesis in that the larger the level of international activities, the greater the exchange rate exposure of the firm. However, when the δi coefficient is regressed on international sales and liabilities in foreign currency, the results disappear.
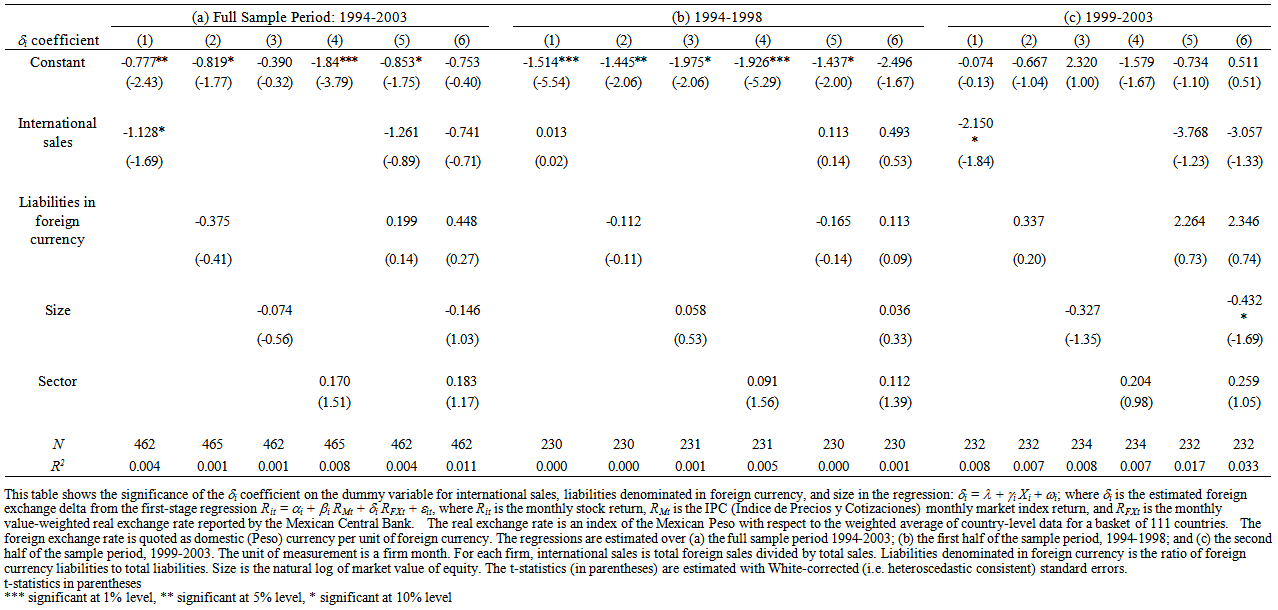 | Table 6. Determinants of Exposure by Firm Month and sub-Period |
7.2.4. Cross-sectional Time Series Regressions with Fixed Effects
- There are a couple of plausible explanations for the results obtained up to this point. The first is that the data that I have used in the second-stage regressions have correlated error terms: It is unbalanced panel data in which I have observations for 71 individual firms for up to ten years each. The error terms are not independent because the error terms for every firm year are correlated with the error terms for every other firm year for that individual firm. Thus, I do not have 462 fully independent observations. However, I have taken this into account in the second-stage regressions, which I have estimated with White-adjusted heteroscedastic consistent standard errors. This adjustment is designed to account for estimation errors in the estimated dependent variable as well as possible correlation within firms. A second plausible explanation is that there is, perhaps, some unobserved factor that explains the variation in exposure for each firm. If this is the case, when I control for both observed characteristics and firm effects, the significant results in Table 6 ought to become insignificant, implying that the determinants of exposure are unique to each firm.Table 7 (a) reports cross-sectional time series regressions estimated with firm fixed effects. The robust standard errors for all regressions are clustered by industrial sector. Contrary to the unobserved factor hypothesis, the significant results become more robust. Exposure sensitivity decreases as international sales increase; this relationship is statistically significant at the 1 percent level. This result provides some support for the hedging hypothesis. It is possible that firms that rely heavily on international sales are less sensitive to exchange rate movements than firms that rely primarily on domestic sales because they are hedged more and better than other firms.
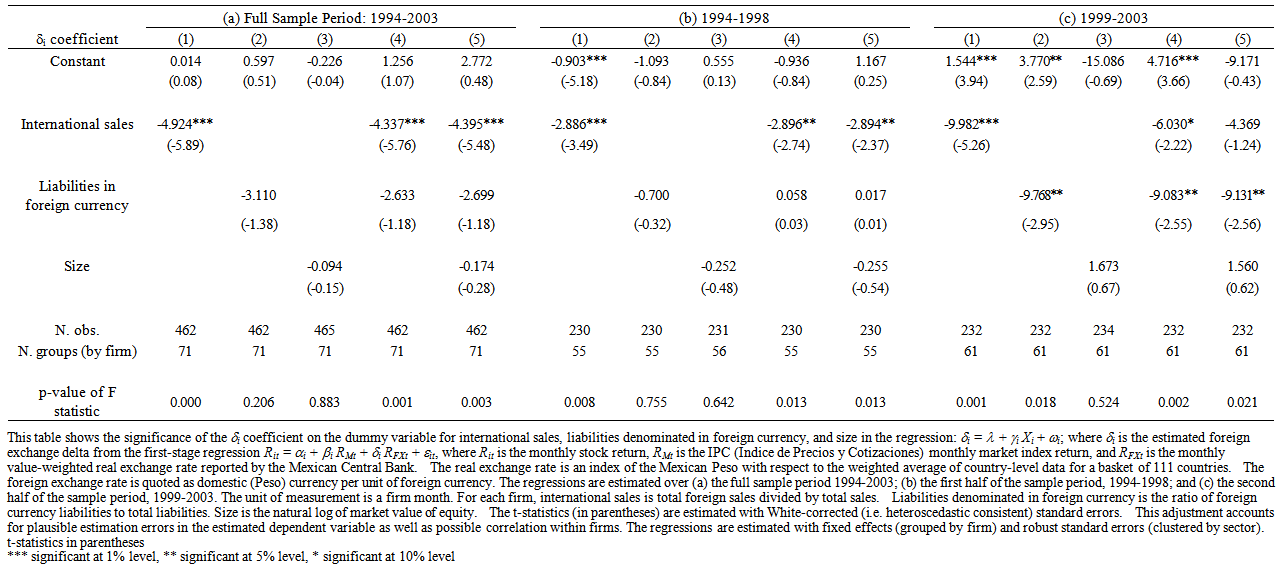 | Table 7. Determinants of Exposure by Firm Month and Period with Fixed Effects by sub-Period |
8. Conclusions
- In this paper, I investigate the extent to which firms are exposed to exchange rate fluctuations, whether firm-level differences in exposure to currency fluctuations have measurable effects on firm value, and, most importantly, what are some of the factors that could account for such exposure. I obtain currency exposures and derive its determinants in a two-stage model previously established in the literature. The results of the first-stage regressions show that firms are significantly exposed to fluctuations in the exchange rate and this exposure varies by firm size (medium sized and bigger firms are more exposed) and by industrial sector. This provides some initial support for the firm’s characteristics hypothesis.In the second stage, I identify the source of this exposure as the level of international sales and foreign currency liabilities. After controlling for firm fixed effects, I find that firms that rely heavily on international sales are significantly less sensitive to exchange rate movements than firms that rely primarily on domestic sales. When I split the data into two sub periods, I find evidence of a slight time-variation in firms’ exposure sensitivity to international sales and financial hedging. The results provide support for the three hypotheses proposed: the firm characteristics hypothesis (larger firms are more exposed), the international sales hypothesis (firms with high levels of international sales are significantly less exposed), and the foreign currency debt hypothesis (foreign debt is a successful hedging mechanism).These results suggests that the mechanisms through which exchange rate exposure affect firm value are complex, and points to potential future areas of research. Clearly, issues with data availability are a significant constraint for international financial research. In this particular case, the tests in this study would have been more powerful if information about the currency denomination of sources of revenue were available in addition to the currency denomination of liabilities. In addition, the discussion in the summary statistics about high concentration of ownership in the Mexican equities market suggests that the inclusion of information regarding the ownership structure of firms might help clarify whether highly concentrated ownership may be one of the firm-level characteristics controlled by fixed effects. However, ownership structure information is notoriously difficult to obtain for publicly traded Mexican firms. In all, this paper has advanced the literature, however modestly, in helping understand the mechanisms through which exchange rate exposure impacts the value of the firm.
Appendix A. Sample Firms and Market Capitalization by Sector / Industry
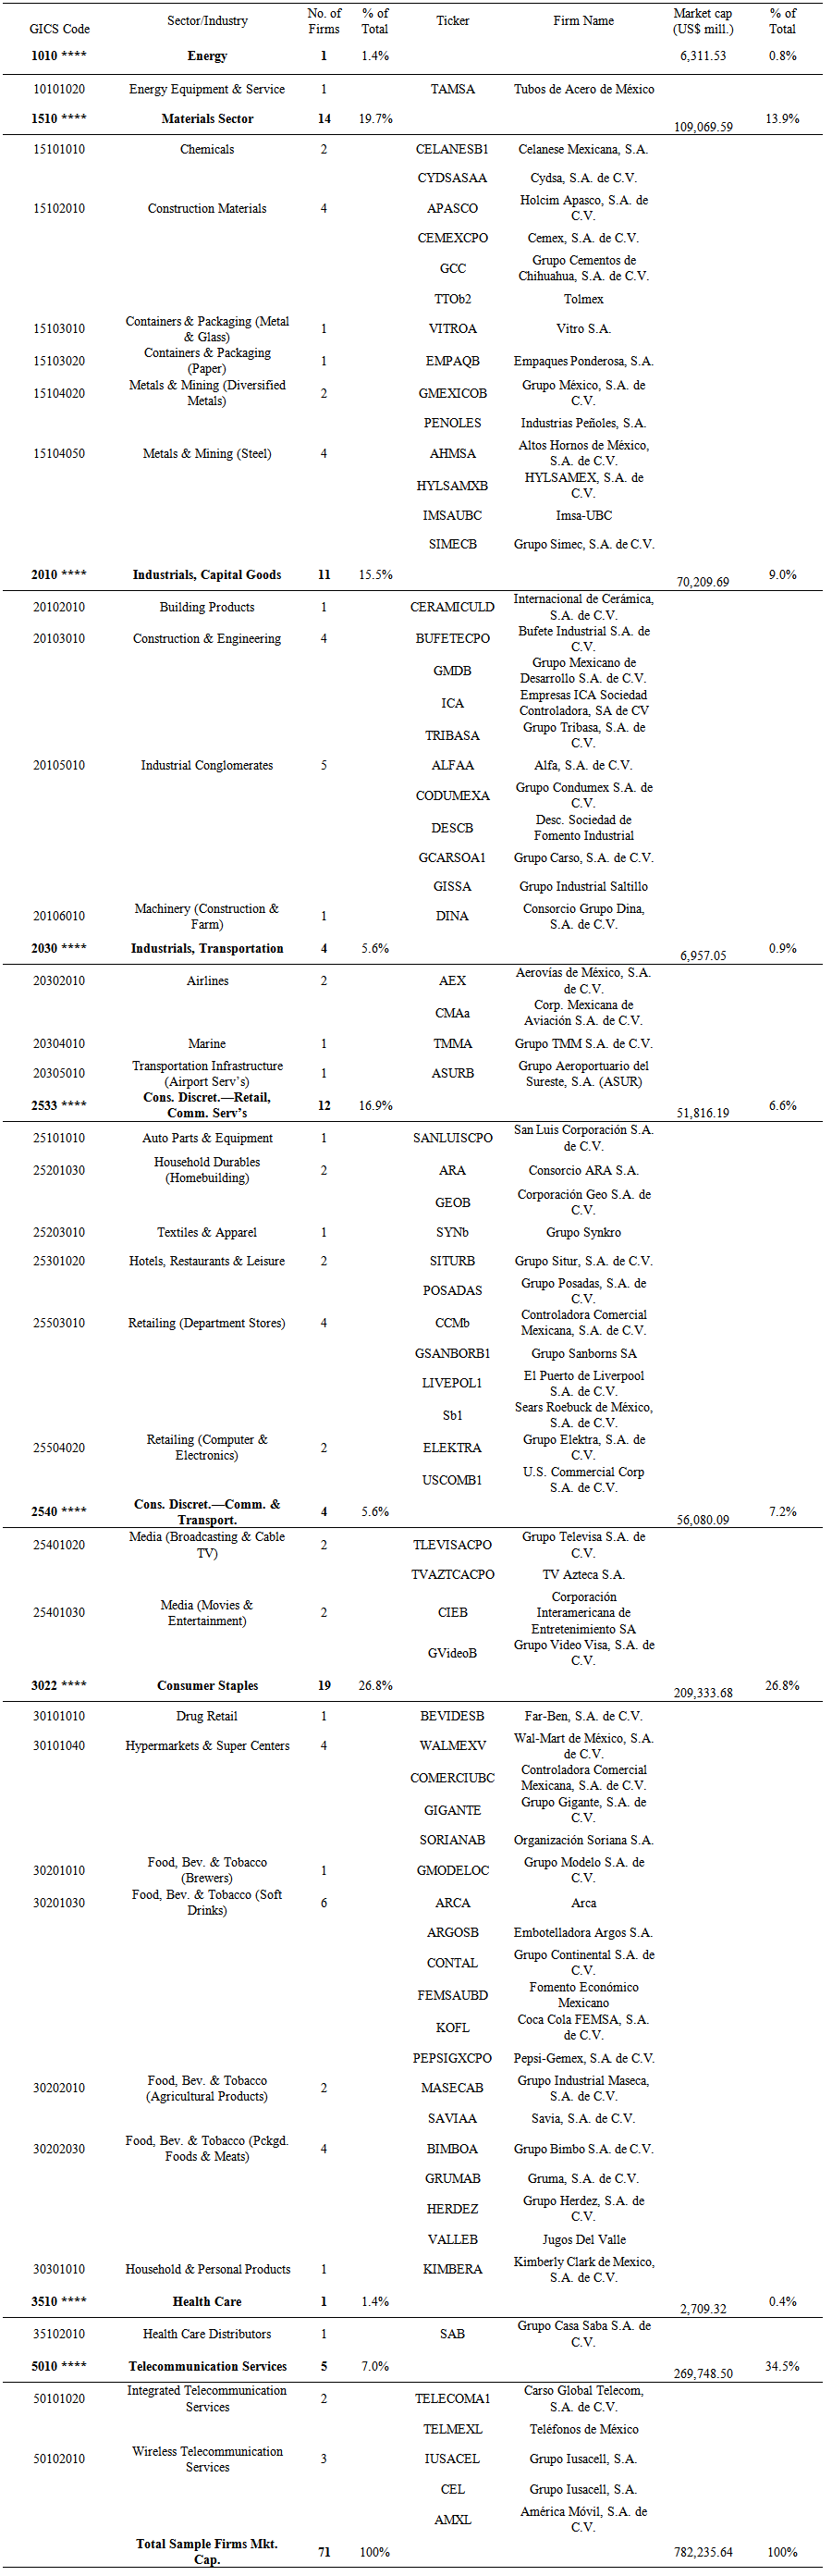 | Firms are classified by sector and industry as per official classifications of the Mexican stock exchange and Global Financial Data, Inc. Classifications are based on business lines, as defined by principal sources of revenue (where sales or revenue breakdowns are available) or by principal products or services provided. |