Cristhian Mellado1, Sergio Garcia2
1Universidad Católica de la Santísima Concepción, Department of Economics, Alonso de Ribera 2850, Concepción, Chile, and The University of Texas - Pan American, Department of Economics and Finance, 1201 West University Drive, Edinburg, TX 78539
2The University of Texas - Pan American, Department of Economics and Finance, 1201 West University Drive, Edinburg, TX 78539
Correspondence to: Cristhian Mellado, Universidad Católica de la Santísima Concepción, Department of Economics, Alonso de Ribera 2850, Concepción, Chile, and The University of Texas - Pan American, Department of Economics and Finance, 1201 West University Drive, Edinburg, TX 78539.
| Email: |  |
Copyright © 2014 Scientific & Academic Publishing. All Rights Reserved.
Abstract
The foreign exchange rate pairings between participants in the Latin American Integrated Market (MILA) are analyzed for changes in correlation following implementation of MILA operations. We find evidence through a DCC-GARCH that the conditional correlations decrease after MILA is established. Our results show that the MILA has a positive effect on the decrease in correlation within participating Latin American countries. This is a benefit to investors because there is an increase in diversification by holding portfolios consisting of diverse currencies in participating countries (Colombia, Peru, and Chile).
Keywords:
Latin American Integrated Market, Dynamic Conditional Correlation, Foreign Exchange Rate, MILA
Cite this paper: Cristhian Mellado, Sergio Garcia, The Effects of the Latin American Integrated Market (MILA) on the Foreign Exchange of Colombia, Peru and Chile, American Journal of Economics, Vol. 4 No. 2A, 2014, pp. 42-50. doi: 10.5923/s.economics.201401.04.
1. Introduction
The Integrated Latin American Market (MILA) is the virtual integration of the Lima Stock Exchange, the Santiago Stock Exchange, and the Colombia Stock Exchange that defines a unique model of integration of equity markets. Although relatively young, MILA gives financial research an opportunity to address different aspects of the relationship between integrated stock markets and foreign exchange rates as well as the effect that integrated markets may have on future foreign exchange contagion.MILA allows traders in each country to have direct access to the other two exchanges, without having to depend on a host country intermediary. The MILA is unique because each market maintains its own domestic clearing house as the central securities depository for each country.Key to the interaction is that each country maintains transactions in its own domestic currency. Each transaction, regardless of origin is conducted in the currency of the host country market of the traded stock. This is a particularly interesting agreement in terms of the potential effect that this new integrated market may have in the valuation of foreign exchange rates in each participating country.This structure is important because the foreign exchange rates for these three countries remain a crucial data point in the valuation of the assets in the markets for all three participants. This work explores the effect of the MILA on the foreign exchange relationships inherent to this new establishment.We use a correlation analysis to view the interaction and dependency of each foreign exchange rate pairing. Estimating correlations in foreign exchange rates like other financial assets are important for multiple applications including optimizing currency portfolios (Beine, 2004), estimating contagion potential (Glick and Rose, 1999) and evaluating international asset investments. Glick and Rose in particular find that currency crises tend to spread within regional geographies.The goal of the paper is to analyze the effect that the establishment of MILA has had on the foreign exchange rates of each involved country. More specifically, we plan to see if there is a change to the conditional correlation of each country foreign exchange pairing to see the internal effect of MILA on the foreign exchange of involved countries.Our first principal finding is that the DCC-GARCH model finds statistically significant correlation estimators for all of the foreign exchange markets that participate in MILA. Secondly, the correlation of each foreign exchange pairing decreases following the implementation of MILA. This implies that investors are able to optimize and diversify their currency holdings and portfolios by noting the changes in the degree of correlation between participating countries after the implementation of the MILA.The paper continues as follows: In section 2, we briefly describe what MILA is and how it works. Next, section 3 describes the data and methodology used to proceed with our analysis. Section 4 describes our results and section 5 concludes the paper.
2. Latin American Integrated Market (MILA)
The MILA began operations in May 2011 and was the first market use virtual integration to combine markets in different countries to facilitate international transactions, within each independent market. The process was first conceptualized and agreed upon in September 2009 between the Santiago Exchange (Chile), The Colombia Exchange and the Lima Exchange (Peru).The goals of establishing the MILA included the potential to increase investor diversification, to construct a market that would be more attractive for external investors, and to challenge the Brazilian Stock Market (BOVESPA) as a regional competitor. The declared vision statement for the MILA is to become the region’s most attractive exchange. MILA has since become the second largest in market capitalization (the first one is Brazil with $1,257,888 and MILA has $706,098 millions of dollars at January 2013) and third in terms of trading volume after Brazil and Mexico (Brazil $605,712, Mexico $75,909, and MILA 64,781 millions of dollar accumulate from January to August 2012).MILA is the first virtual integration between transnational entities that does not require a melding of additional infrastructure such as a central clearinghouse or singular monetary policy. This effort alleviates some of the regulatory headaches that could arise with the integration of infrastructure necessary to manage an old world market. The virtual integration is accomplished by mutually granting access to traders in the other foreign countries and an agreement on recognizing the values of shares in the other markets.However, the MILA allows host countries to maintain their fee structures, tariffs and foreign currency policies independent of each other. Since the stock purchases are not made in a single currency, investor cash holdings must be converted to the host country’s currency prior to stock purchase. Foreign investors inside of the MILA may have more direct access to stocks in the participating countries but since each trade is made in the stock’s host country’s currency, the demand for each currency is affected as stocks become more visible and volume increases within the MILA.Specifically interesting to the relationships of foreign exchange between these countries, the agreement to use the domestic country currency in each market may allow for the integration to come with greater ease, but does not simplify the trade in regards to currency.Each participant in MILA potentially benefits from increased stock choices and potential diversification. This effort may create a better risk/return relationship for investors. As such, the potential interest of other non-MILA foreign investors is increased due to the strengthening of the market as an independent entity. Brokerage firms likewise can benefit from the effort by having access to all three markets in one location, even as the purchases are made in terms of separate domestic currencies.
3. Data and Methodology
3.1. Data and Descriptive Statistics
The foreign exchange data for this analysis originates from the Datastream database and was focused on the exchange rates of each country against the United States Dollar (USD).The time periods for our sample were determined by the available data surrounding the initiation of operations of the MILA. Our sample period begins in September 2008 and includes a three year period prior to the initial trading date of the MILA. The data ends in September 2013 and includes the two year period following initial operations.Following the conventional approach, we calculate the daily foreign exchange returns as the first difference of the natural log of each foreign exchange value, and the returns are expressed as percentages: | (1) |
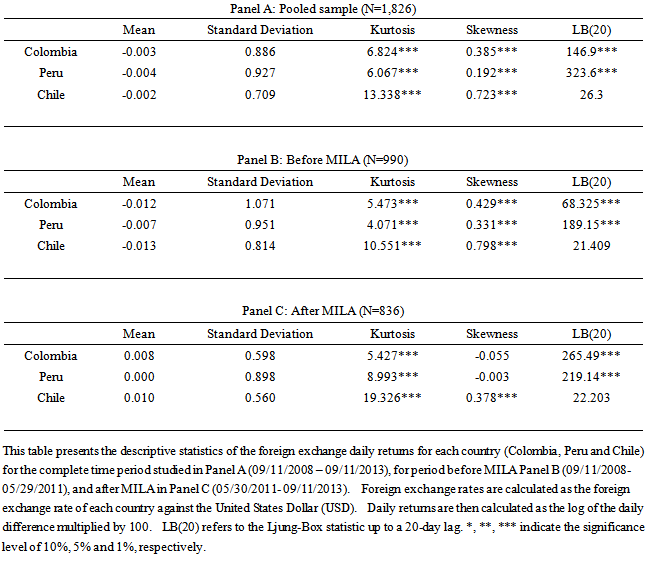
Where  is the price level of the foreign exchange for country “c” at time t. When data are unavailable, because of national holidays, bank holidays, or any other reasons, foreign exchanges are assumed to stay the same as those of the previous trading day. This data is specific for the MILA markets including Colombia, Peru and Chile and serve as a specific description of this market integration.The summary statistics of foreign exchange returns in the three MILA markets are presented in Table 1. Specifically, we report information on the mean, standard deviation, skewness, kurtosis, and the Ljung-Box test (LB) for the pooled sample, before and after MILA; Panel A, B, and C, respectively. As expected with emerging equity markets, the index return series are negatively skewed and leptokurtic. Furthermore, the foreign exchange returns series for Colombia and Peru are found to exhibit significant autocorrelation as suggested by the Ljung-Box test statistic. The average daily foreign exchange return is negative for all the MILA countries for the pooled sample (Panel A). Panel C shows that after MILA begins operations, the average daily returns are positive. However, the difference is not statistically significant at conventional levels (the results for the t-test are not presents in table 1).
Table 1. Descriptive Statistics
 |
| |
|
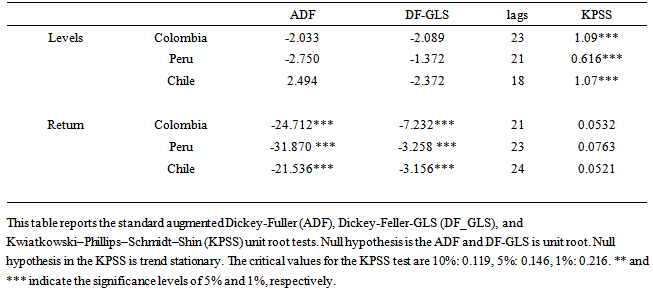
We check the stationary of the series in our model using three classes of unit root tests. The standard augmented Dickey-Fuller (ADF), Dickey-Feller-GLS (DF_GLS), and Kwiatkowski–Phillips–Schmidt–Shin (KPSS) tests find that all the original series in levels are not stationary. On the other hand, the daily foreign exchange returns,  are found to be stationary (see Table 2).
Table 2. Unit root test
 |
| |
|
To visualize the returns for each market, Figure 1 provides the chart for foreign exchange in levels (left panels) and their corresponding returns (right panels). All of these countries experienced a decreasing trend in the foreign exchange market that became more pronounced in the last years, which is visible in Figure 1. This could be explained by the new financing trend in Latin America.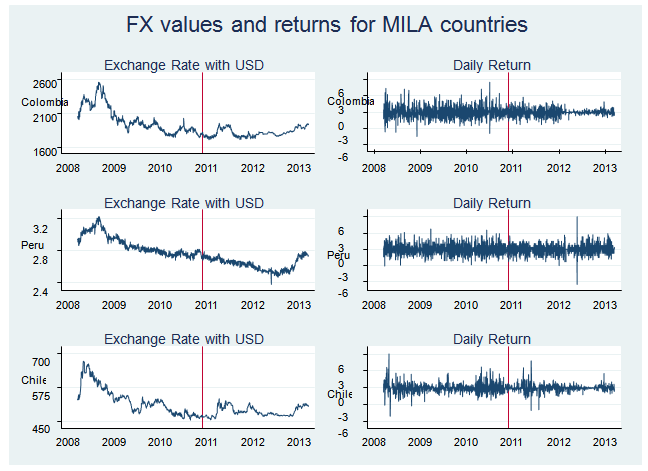 | Figure 1. This figure shows the foreign exchange values of each MILA country (Colombia, Peru and Chile) versus the United States Dollar in the first column. In the second column, the figure shows the daily return of each foreign exchange versus USD value. The vertical line in each graph displays the date that MILA began operations: May 30th, 2011 |
Tobar and Quispe-Agnoli (2008) identify that during the past fifteen years, financial markets in Latin America have experienced a major transformation explained by, among other factors, increases in capital flows into Latin America, an external environment characterized by low real interest rates worldwide and decreased levels of risk aversion. These effects have compressed the sovereign spreads on the region’s external debt to historically low levels allowing a higher marginal propensity to save increased income.Countries in Latin America are now running current account surpluses rather than deficits. In addition, fiscal policy is generally more disciplined and most borrowing is being undertaken by the private rather than the public sector. In addition, capital flows are taking place against the backdrop of stronger and new financial systems, in an environment of lowered perceived risk, as reflected by low spreads and high liquidity, and in which investors are increasingly sophisticated.
3.2. Methodology
We implement a correlation analysis due to its usefulness in modeling financial contagion (Corseti et al, 2011). In addition, the dynamic conditional correlation (DCC) proposed by Engle (2002) is particularly useful as it is more flexible than the constant conditional correlation (CCC) because of the ability to estimate the changing degree, or dynamic, that the conditional correlation takes over time. We use a multivariate GARCH-DCC model to analyze the correlation of all three foreign exchange returns. The DCC-GARCH has three advantages over other estimations methods (Chiang et al. (2007). First, the DCC-GARCH model estimates correlation coefficients of the standardized residual and thus accounts for heteroscedasticity directly. Second, the model allows including additional explanatory variables in the mean equation to measure common factor. Finally, the multivariate GARCH model can be used to examine multiple asset returns without adding too many parameters. The resulting estimates provide us with a dynamic trajectory of correlation behavior in a multivariate setting. Thus we can analyze the correlation behavior when there are multiple regime shifts such as the creation of the MILA. On the other hand, panel GARCH models as in Escobari and Lee (2014) represent an alternative GARCH specification that models multiple mean equations along with a structured time-varying variance-covariance matrix.We select a random walk for our mean equation(s) as the modern challenge to develop a model to surpass the predictive power of the random walk remains unsolved. (Rime et al, 2008; Lilian and Taylor, 2003). 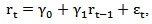 | (2) |
Where ,
,  and
and In this specification we include an AR(1) term following the conventional approach. The AR(1) is used to account for the autocorrelation of foreign exchange returns, which we find in two of the markets under investigation, as reported in Table 3. The well-documented inability of standard exchange rate models to forecast out-of-sample better than a naïve random walk has been and perhaps remains the conventional wisdom in the international finance profession.” (Rime et al, 2008)The multivariate conditional variance is specified as:
 | (3) |
Where  is the
  diagonal matrix of time-varying standard deviation from univariate GARCH models with
  on the ith diagonal, i=1,2,..,4;
  is the
 time-varying correlation matrix. The DCC-GARCH model, proposed by Engle (2002), involves a two stage estimation of the conditional covariance matrix
 The first stage requires the selection of appropriate univariate GARCH models, in order to obtain the standard deviations,
  In the second stage, stock return residuals adjust by their estimated standard deviations from the first stage,
  then
then  is used to estimate the parameters of conditional correlation.The correlation in the DCC model is given by:
 | (4) |
Where  is the
  time varying covariance matrix of
  is the
  unconditional variance matrix of
  and
and  and
and  are nonnegative scalar parameters satisfying
  Then it is necessary to re-escalate the matrix
  in order to guarantee that all the elements in the diagonal be equal to one. As a result, we obtain a proper correlation matrix
 | (5) |
Where Equation (4) is a correlation matrix with ones on the diagonal and off-diagonal elements less than one in absolute value, as long as
  is positive definite. A typical element of
  is of the form:
 | (6) |
The DCC model can be estimated by using a two-stage approach to maximize the log-log-likehood function. Let  denote the parameters in
 and
and  the parameters in
 and then the log-likehood is
  | (7) |
The first part of the likelihood function in equation (7) is volatility, which is the sum of individual GARCH likelihoods. The log-likelihood function can be maximized in the first stage over the parameters in Given the estimated parameters in the first stage, the correlation component of the likelihood function in the second stage, the second part in (7), can be maximized to estimate correlation coefficients.
4. Results
4.1. Estimating the DCC -GARCH
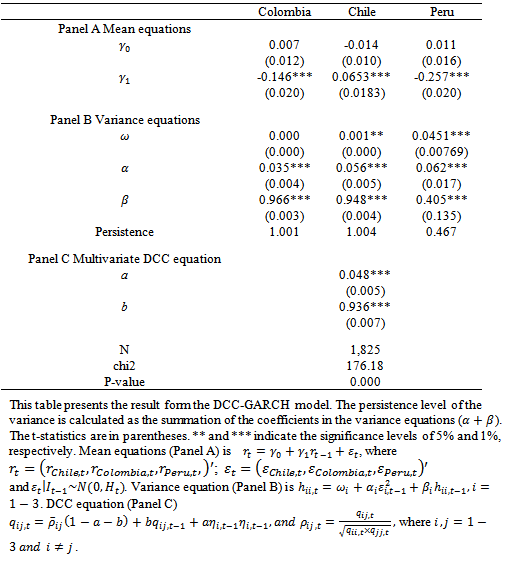
The results of the DCC-GARCH are detailed in Table 3. The AR(1) term in the mean equation is negative and significant for Peru and Colombia. Chile is positive but not significant. The variance equation shows that the lagged conditional volatility and lagged squared error term in the variance equation are highly significant for all countries. This is reflective of the appropriateness of the GARCH(1,1) specification and justifies the methodology selection.Finally, the multivariate DCC parameters in Panel C are significant at the 1% level, revealing that the correlation has a dynamic component. Wald test rejects the null hypothesis that a = b = 0 at all levels (χ2 = 110,000) and p-value = 0.000).Table 3
 |
| |
|
Furthermore, the results indicated that the volatility persistence measure (α + β) is close to one for all the countries and each displays a high persistence. Figure 2 shows the volatility of each country’s foreign exchange rate in terms of their pairing with the USD.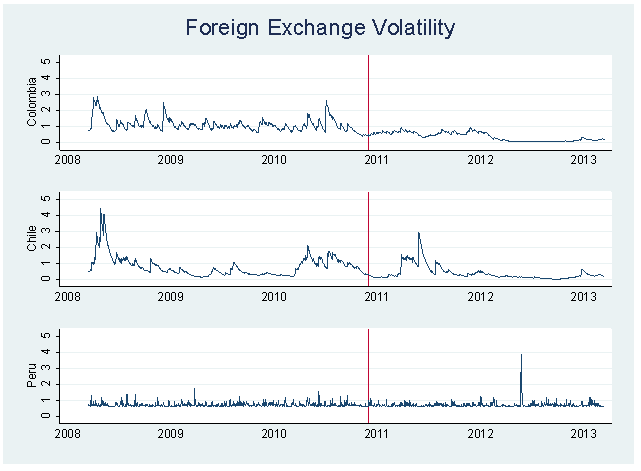 | Figure 2. This figure shows the volatility of each MILA associated country’s (Colombia, Chile, and Peru) foreign exchange rate in terms of its pairing with the United States Dollar. The vertical line represents the day that the MILA began operations (May 30, 2011) |
4.2. Correlation Analysis
One of the great advantages of the DCC-GARCH model is that it uses a multivariate VAR which includes the opportunity to calculate all possible pairwise correlation coefficients for each paired foreign exchange rate for all three countries at the same time. As such, it is possible to analyze their co-movements and dynamics simultaneously during periods of particular interest. This is particularly applicable to the formation of the MILA as a virtual integration market and provides a timeline in order to analyze the differences before and after MILA was operational.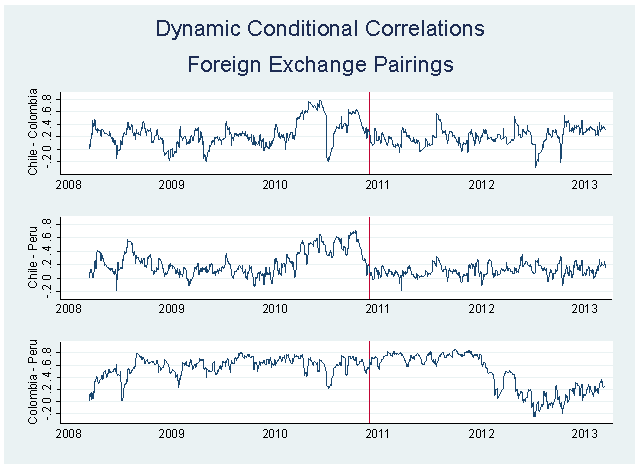 | Figure 3. This figure shows the dynamic conditional correlation for each country pairing of countries that participate in the MILA. The vertical line in each graph displays the date that MILA began operations: May 30th, 2011 |
Figure 2 presents a visual implementation of the dynamics of the correlation of the paired foreign exchange rates for each of the countries against the other: Chile-Colombia, Chile-Peru, and Colombia-Peru. The results for Chile-Colombia are not readily interpreted visually, but Both Chile-Peru and Colombia-Peru have visually recognizable decreases in correlation after MILA begins its operations.In the case of Chile-Peru, we see a drop in correlation that begins in the time period immediately prior to the opening day of operations of the MILA. The drop in correlation for this foreign exchange pair could be a signal of action in trading prior to the actual implementation of the MILA. This decrease is not gradual and appears to level off just after MILA becomes operational. The correlation between Colombia and Peru, on the other hand, has a delayed decrease after the MILA is operational.
4.2.1. Difference in Means
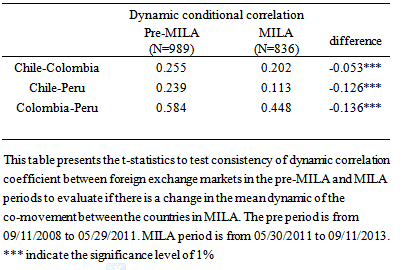
We use t-statistics to test consistency of dynamic correlation coefficient between foreign exchange markets in the pre-MILA and MILA periods to evaluate if there is a change in the dynamic of the co-movement between the countries in MILA. We define null and alternative hypothesis as: Where
Where 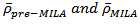 are the means conditional correlation coefficients of population in the pre-MILA and MILA period estimated in equation (6). If the sample size is
  and
and the population variances
  and
and  are different and unknown. If the means of dynamic conditional correlation coefficients estimated by equation (6) are
  and
and  and the variances are
  and
and the t-statistic is calculated as:
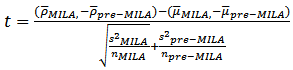 | (8) |
If the t-statistics are significantly greater than the critical value, we reject the null hypothesis supporting the existence of an effect in the correlation of between MILA’s countries. Table 4 shows the unconditional correlations and the mean of the DCC coefficients in the time periods before and after 30 May 2011, the day trading in the MILA is initiated. Examining the unconditional correlations before and after give us the opportunity to measure the difference between the two time periods and make a statement about the degree of conditional correlation that exists in each foreign exchange pair, in each period.Table 4. Dynamic conditional correlation and MILA effect test
 |
| |
|
In all three pairs of correlations, Chile-Colombia, Chile-Peru, and Colombia-Peru, the difference is negative after MILA is initiated. In all three cases, the correlation for the foreign exchange pairs decreases. The differences are all statistically significant in all three cases.The decreased conditional correlation can be interpreted as an increased strength and independence of each country’s foreign exchange rates. The timing of the decrease surrounding the implementation of MILA and the results of the change in means leads us to conclude that the MILA had a negative impact on the correlation between foreign exchange rates.MILA represents an increased opportunity to diversify investor portfolios. Likewise, the independence of each foreign exchange rate is a positive development for the investors because the overall risk of contagion is lowered. As an example, if there is higher volatility in the exchange rate of any MILA related country with the USD, any investor can hedge their foreign exchange exposure by establishing a position within another MILA country.Noting the DCC-GARCH estimations and the correlation analysis, the connection between conditional volatility and correlation has an important implication for investors that participate in this new integration. When the foreign exchange rate for one of these countries decreases, domestic investors search for the benefits of international diversification. Thus, the resulting low correlation(s) among the foreign exchange rates of the countries that participate in the MILA implies that the gain from international diversification by holding portfolios consisting of currencies in one of the countries increases, because these foreign exchange markets are less exposed to systematic risk.
4.2.2. Multivariate Correlations Analysis
Looking at the mean differences provides a simple to understand overview of the change in the correlation before and after the MILA. However, the evaluation of means does not allow an investor to model the dynamic changes to the foreign exchange rates as they occur over time. Recognizing that the comparative mean model above does not take the dynamic structure of the DCC into account, we run a time series regression model to evaluate the evolution of the market correlation over time. We implement the following ARMA (1,0,0) regression model: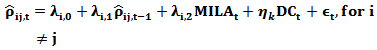 | (8) |
Where are the conditional correlations of the foreign exchange returns predicted from the DCC-GARCH in 4.1.
  is a dummy variable that is equal to 1 after 05/29/2011 and 0 otherwise.
  is a dummy variable to control for financial contagion produce by crisis and it has been showed affect the dynamic conditional correlation (see Horvath and Petrovski, 2013; Syllignakis and Kouretas, 2011; and Chiang et al. 2007). We include a dummy variable to capture the most recent financial crisis in U.S. from the beginning of 2008 to the end of December 2011. The estimation results in Table 5 show that the unconditional mean of correlations and constant terms are all significant at the 1% level. The initiation of MILA operations has decreased the correlation between foreign exchange pairs of associated countries as demonstrated by the dummy variable in model 1, 2, and 3 in Table 5. The dummy variables are all negative and reflect that the correlation decreases in the second period. However, only the correlation between Chile-Peru is significant at 10%.
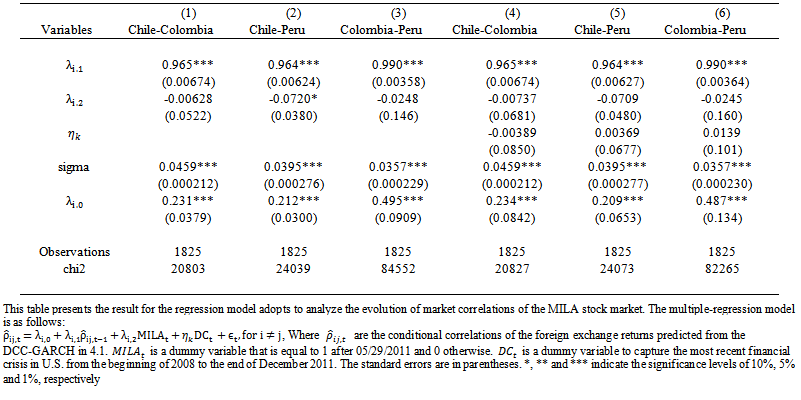 | Table 5 |
Models 4, 5, and 6 include a variable that controls for the financial crisis. The MILA dummy variables all continue to be negative but now none are significant. These results are not necessarily contradictory as the results show the same expected direction change that were found in the mean difference test following the dynamic estimation of correlation from the DCC-GARCH model.
5. Conclusions
The MILA is an ongoing effort to integrate the stock markets of Colombia, Peru and Chile and continues to make adjustments to facilitate trade while maintaining a degree of independence for each country. The effect of MILA on the foreign exchange rates of each country pair should be well received noting that the implementation of the MILA has lowered the overall correlation of each. As such, the potential effect of contagion in the foreign exchange markets of each country has lowered and each foreign exchange appears to have a greater level of independence from each other.Other changes in the MILA have not been fully sorted out. As an example, the Peruvian market is the most expensive in terms of tariffs and tax issues (Bases and Lash, 2013). These transaction differences may account for some variation in demand within the market and represent opportunity for future research. Another topic for future research could include the effect of stock market volume on the different foreign exchange rates.We surfaced a decrease in correlation in the mean tests that mirrors our expectations of an increased strength in foreign exchange rates following the initiation of the MILA. The long term goals of the MILA to compete with other regional markets have surfaced increased opportunity and strength for participating entities outside of their initial goals that should be a welcomed effect by host country foreign exchange policies.
Note
Federacion Iberoamericana de Bolsas, FIAB,
References
| [1] | Bartov, Eli, and Gordon M. Bodnar. 1994. “Firm Valuation, Earnings Expectations, and the Exchange-Rate Exposure Effect.” Journal of Finance 49 (5) (December): 1755–1785. ecn. |
| [2] | Bases, Daniel, and Herbert Lash. 2013. “Growing Pains for Latin America’s Integrated Stock Market.” Reuters, June 24. |
| [3] | Beine, Michel. 2004. “Conditional Covariances and Direct Central Bank Interventions in the Foreign Exchange Markets.” Journal of Banking & Finance 28 (6) (June): 1385–1411. doi:10.1016/S0378-4266(03)00124-9. |
| [4] | Celık, Sibel. 2012. “The More Contagion Effect on Emerging Markets: The Evidence of DCC-GARCH Model.” Economic Modelling 29 (5) (September): 1946–1959.doi:10.1016/j.econmod.2012.06.011. |
| [5] | Chen, Gong-meng, Michael Firth, and Oliver Meng Rui. 2002. “Stock Market Linkages: Evidence from Latin America.” Journal of Banking & Finance 26 (6) (June): 1113–1141. doi:10.1016/S0378-4266(01)00160-1. |
| [6] | Corsetti, Giancarlo, Marcello Pericoli, and Massimo Sbracia. 2011. “Correlation Analysis of Financial Contagion.” Financial Contagion: The Viral Threat to the Wealth of Nations: 11–20. |
| [7] | Engle, Robert. 2002. “Dynamic Conditional Correlation: a Simple Class of Multivariate Generalized Autoregressive Conditional Heteroscedasticity Models.” Journal of Business & Economic Statistics 20 (3) (July 1): 339–350. doi:10.1198/073500102288618487. |
| [8] | Escobari, D. and Lee, J., (2014). Demand Uncertainty and Capacity Utilization in Airlines. Empirical Economics. Forthcoming. |
| [9] | Glick, Reuven, and Andrew K. Rose. 1999. “Contagion and Trade: Why Are Currency Crises Regional?” Journal of International Money and Finance 18 (4) (August): 603–617. doi:10.1016/S0261-5606(99)00023-6. |
| [10] | Kilian, Lutz, and Mark P. Taylor. 2003. “Why Is It so Difficult to Beat the Random Walk Forecast of Exchange Rates?” Emperical Exchange Rate Models 60 (1) (May): 85–107. doi:10.1016/S0022-1996(02)00060-0. |
| [11] | Li, Xiao-Ming. 2011. “How Do Exchange Rates Co-move? A Study on the Currencies of Five Inflation-targeting Countries.” Journal of Banking & Finance 35 (2) (February): 418–429. doi:10.1016/j.jbankfin.2010.08.019. |
| [12] | Rime, Dagfinn, Lucio Sarno, and Elvira Sojli. 2010. “Exchange Rate Forecasting, Order Flow and Macroeconomic Information.” Special Issue: JIE Special Issue on International Macro-Finance 80 (1) (January): 72–88. doi:10.1016/j.jinteco.2009.03.005. |
| [13] | Sager, Michael, and Mark P. Taylor. 2008. “Commercially Available Order Flow Data and Exchange Rate Movements: Caveat Emptor.” Journal of Money, Credit and Banking 40 (4): 583–625. doi:10.1111/j.1538-4616.2008.00129.x. |
| [14] | Syllignakis, Manolis N., and Georgios P. Kouretas. 2011. “Dynamic Correlation Analysis of Financial Contagion: Evidence from the Central and Eastern European Markets.” International Review of Economics & Finance 20 (4) (October): 717–732. doi:10.1016/j.iref.2011.01.006. |
| [15] | “The Pacific Players Go to Market.” 2011. The Economist, April 9. http://www.economist.com/node/18529807. |
| [16] | Verma, Rahul, and Teofilo Ozuna. 2005. “Are Emerging Equity Markets Responsive to Cross-Country Macroeconomic Movements? Evidence from Latin America.” Journal of International Financial Markets, Institutions and Money 15 (1) (January): 73–87. ecn. |
| [17] | Wann-Jyi Horng, Tien-Chung Hu, and Ju-Lan Tsai. 2010. “DCC Analysis of Two Exchange Markets with a Factor of Japan Dollars: Study of Philippine and Indonesia Exchange Markets.” Computer Sciences and Convergence Information Technology (ICCIT), 2010 5th International Conference On (November 30): 939–944. doi:10.1109/ICCIT.2010.5711195. |
| [18] | Tovar, C E and M Quispe-Agnoli (2008): “New financing trends in Latin America: an overview of selected issues and policy challenges”, Economic Review, no 3, pp 1–14. |
 Abstract
 Reference
 Full-Text PDF
 Full-text HTML