-
Paper Information
- Next Paper
- Previous Paper
- Paper Submission
-
Journal Information
- About This Journal
- Editorial Board
- Current Issue
- Archive
- Author Guidelines
- Contact Us
American Journal of Economics
p-ISSN: 2166-4951 e-ISSN: 2166-496X
2014; 4(2A): 1-6
doi:10.5923/s.economics.201401.01
Evidence of Market Inefficiency from the Bucharest Stock Exchange
Ekaterina Damianova
University of Durham
Correspondence to: Ekaterina Damianova, University of Durham.
| Email: |  |
Copyright © 2014 Scientific & Academic Publishing. All Rights Reserved.
This paper examines weak-form market efficiency in the Bucharest Stock Exchange (BSE) using dollar-converted returns from its main index BET. Employing a GARCH methodology, we find evidence that over ten years after its inauguration the BSE is still not weak-form efficient. Further evidence of market inefficiency is found in the consistent presence of a significant January effect. These findings are contrary to the conclusions in Harrison and Patton (2005), who conclude that the Romanian stock exchange was largely efficient by the year of 2000.
Keywords: Market efficiency, Transition economy, GARCH
Cite this paper: Ekaterina Damianova, Evidence of Market Inefficiency from the Bucharest Stock Exchange, American Journal of Economics, Vol. 4 No. 2A, 2014, pp. 1-6. doi: 10.5923/s.economics.201401.01.
1. Introduction
- A key problem in centrally planned economies is how to set-up a mechanism for efficient resource allocation. Central planning did not establish itself as a viable alternative to an operational market. Thus encouraging the development of functioning markets, including financial markets, is one of the priorities of economies transitioning from central planning to market economy. The performance of financial markets in these transitioning economies could serve as a benchmark of the overall progress of the reforms. This paper investigates weak-form market efficiency in the largest stock market in Romania – the Bucharest Stock Exchange (BSE). We employ GARCH methodology and find evidence of market inefficiency and seasonal patterns in returns. There is however an indication that the market is becoming more efficient, compared to the first 4 years after its establishment.Mendelson and Peake (1993) argue that equity markets are particularly important to transition economies in order to ensure efficient privatization of state owned enterprises. Yet, up to date relatively few papers have focused on stock markets in transition economies. Nivet (1997) examines the early years of trading on the Warsaw Stock Exchange and finds evidence of market inefficiency. Charemza and Majerowska (2000) again focus on the Warsaw Stock Exchange and find that price restrictions contribute to market inefficiency. Rockinger and Urga (2001) examine the efficiency of the Czech, Hungarian, Polish and Russian stock markets, concentrating on whether these markets are becoming more efficient over time. They find evidence of market efficiency only in the case of Hungary. Of greatest relevance for this paper is the paper by Harrison and Paton (2005), which focuses on Romania and finds evidence of market efficiency. Our paper shows that this result is sample-driven, as extending the sample by additional 5 years yields contrary results.The rest of this paper is organized as follows: section 2 provides brief background on the Bucharest Stock Exchange (BSE), section 3 describes the data; section 4 is devoted to the methodology; section 5 reports our findings; and Section 6 concludes.
2. Background
- The original Bucharest Stock Exchange was established in 1882, but seized its operations in 1945 after the communist party came into power. It was reestablished in 1995, and launched its index the BET in 1997. The Asian Crisis and internal economic difficulties led to a continuous decline in the index during its first three years. As of 2000 however the index has been growing steadily and was one of the fastest growing indices in 2006. The BSE is the largest stock exchange in Romania. As of May 2008, market capitalization of the BSE was approximately 54.8 billion USD, and of the smaller NASDAQ-resembling RASDAQ market section approximately 8.3 billion USD.1
3. Data
- The data for this analysis comes from Datastream and the Bucharest Stock Exchange. Daily closing values of the Bucharest Exchange Trading Index (BET) for the period 9/19/1997 to 28/4/2008 are taken from Datastream. The BET is a free float weighted capitalization index of the most liquid 10 companies listed on the BSE. The companies which form it are reviewed quarterly in March, June, September and December. The period used in the study is the entire period during which the BET index has been reported on a daily basis. Several months prior to its official start the BET was reported semi-formally on every Tuesday and Thursday of the week.Since Romania went through several periods of high inflation during the observed period it is important to adjust for inflation to get a more realistic notion of the actual magnitude of the returns. Inflation measures, however, are not available on a daily basis. Following Harrison and Paton (2005) the index is converted into US dollars using the dollar/lei exchange rate as reported by the BSE.
4. Methodology
- The main variable used in this analysis is the dollar-adjusted daily return of the BET. Returns on day t in are calculated as the natural logarithms of the ratio of the value of the index on the current and the preceding day, multiplied by 100 for a convenient interpretation as percentages or:
 Initially, most of the literature investigating weak-form efficiency in emerging markets has concentrated on testing whether there historical values can be successful predictors of future prices. That is:
 For a market to be (weak form) efficient, the coefficients β should be indistinguishable from zero, indicating that historical information would not be useful in predicting current stock prices.Asset returns, however, typically display heteroskedasticity and the use of Ordinary Least Method (OLS) may be inefficient in estimating the coefficients of equation (1). The more recent empirical literature therefore uses the generalized autoregressive conditional heteroskedasticity (GARCH) approach of Bollerslev (1986) to investigate market efficiency. Specifically, the GARCH-in-mean framework (GARCH-M), described in Engle, Lilien and Robins (1987), allows for mean returns to be specified as a linear function of time-varying conditional variance.The general GARCH-M model for stock returns at time t Rt may be represented by the following equations:
 Again, efficient markets will have insignificant β coefficients. The paper is looking to assess not only whether the BSE is currently efficient but also the evolution in market efficiency as the market moves towards a mature stage and participants and infrastructure grow in sophistication. We thus estimate the model separately for the full sample and then split the sample into three consecutive sub-periods: 9/19/1997 - 12/31/1999, 01/01/2000 - 12/31/2003 and 1/01/2004 - 4/28/2008 and compare the results. For all samples, we also estimate a TARCH model as proposed by Zakoian (1994). This model tests for asymmetry in the responses to positive and negative shocks.The paper also explores other market anomalies including seasonal effects. Two of the most popular seasonal effects are the January effect (Rozeff and Kinney, 1976, Gultekin and Gultekin, 1983; Rogalski and Tinic, 1986; Thaler, 1987) and the day of the week effect (French, 1980; Keim and Stambaugh, 1984; Kiymaz and Berument, 2003). The “January effect” refers to stock price increases during the month of January, which is usually attributed to accounting-related end-of the year selling and start of the year buying. In order to test for the presence of January effect, a dummy variable equal to 1 for the first 10 work days in January of each year was created. The day of the week effect refers to the tendency of stocks to exhibit relatively large returns on Fridays compared to those on Mondays. It is particularly puzzling in light of the fact that Monday return values naturally incorporate returns over the weekend and are expected to be greater. In order to test for day of the week effect, two dummy variables start_of_the_week (equal to 1 if Monday and 0 otherwise) and end_of_the_week (equal to 1 if Friday and 0 otherwise) were created, with mid-week days serving as a reference category.
5. Results
- Fig. 1a plots the nominal value and Fig. 1b plots the dollar-converted value of the BET from 9/19/1997 until 4/28/2008. The two series are generally co-moving. However, the initial loss of value in the index is much more pronounced when the index is converted in dollar terms.
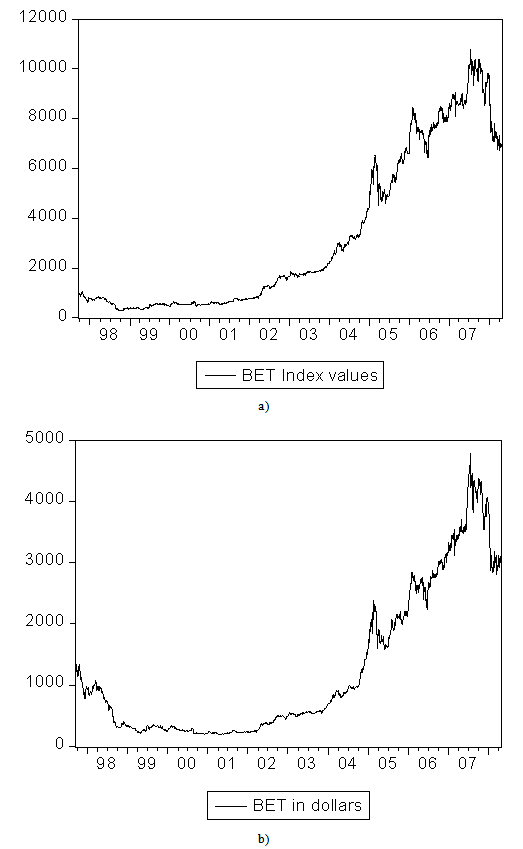 | Figure 1. a) plots the actual BET daily values and b) plots the dollar-converted index |
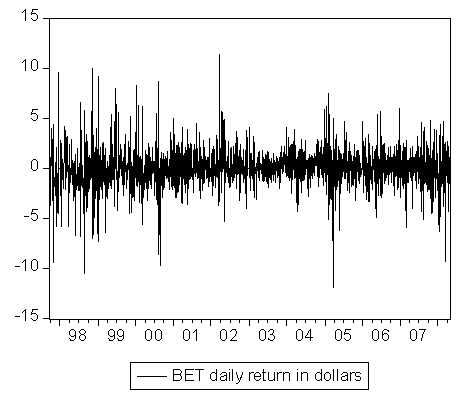 | Figure 2. BET daily return in dollars |
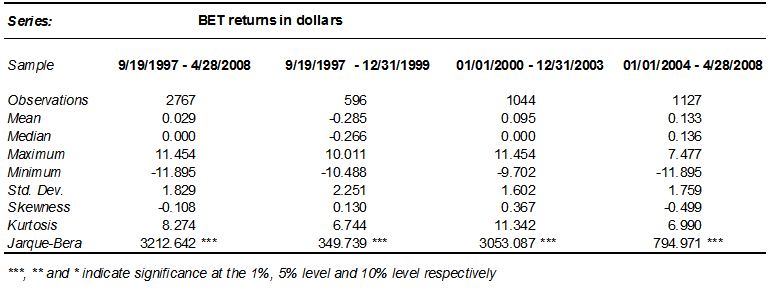 | Table 1. Descriptive statistics of BET returns |
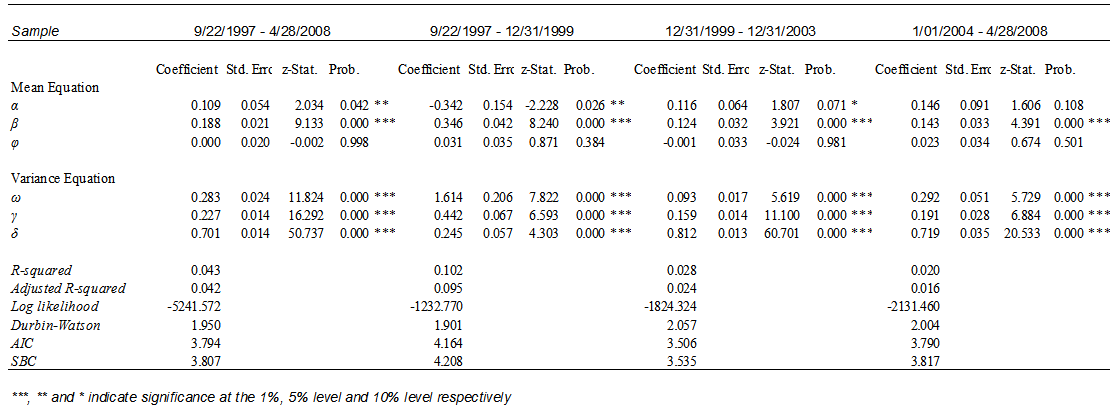 | Table 2. GARCH-M estimates no seasonal effects included |
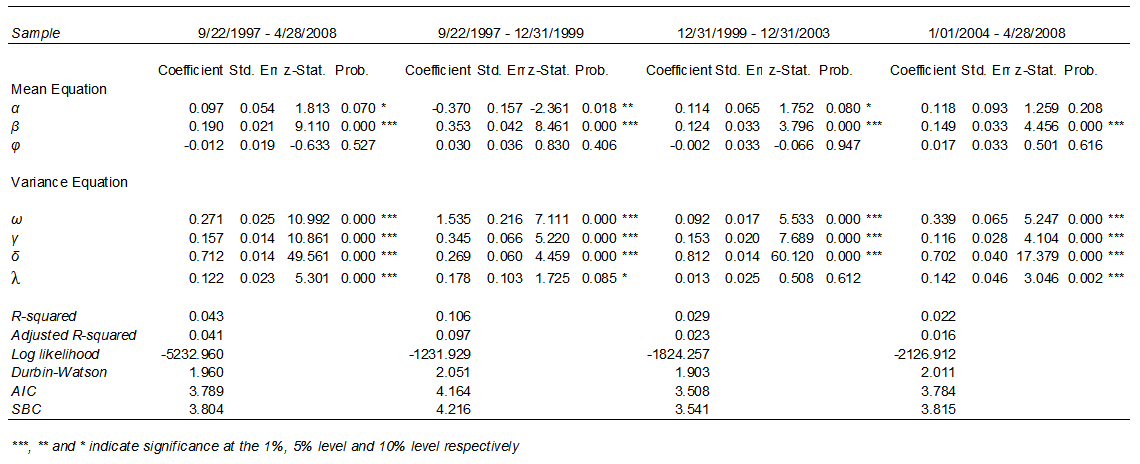 | Table 3. TARCH-M estimates no seasonal effects included |
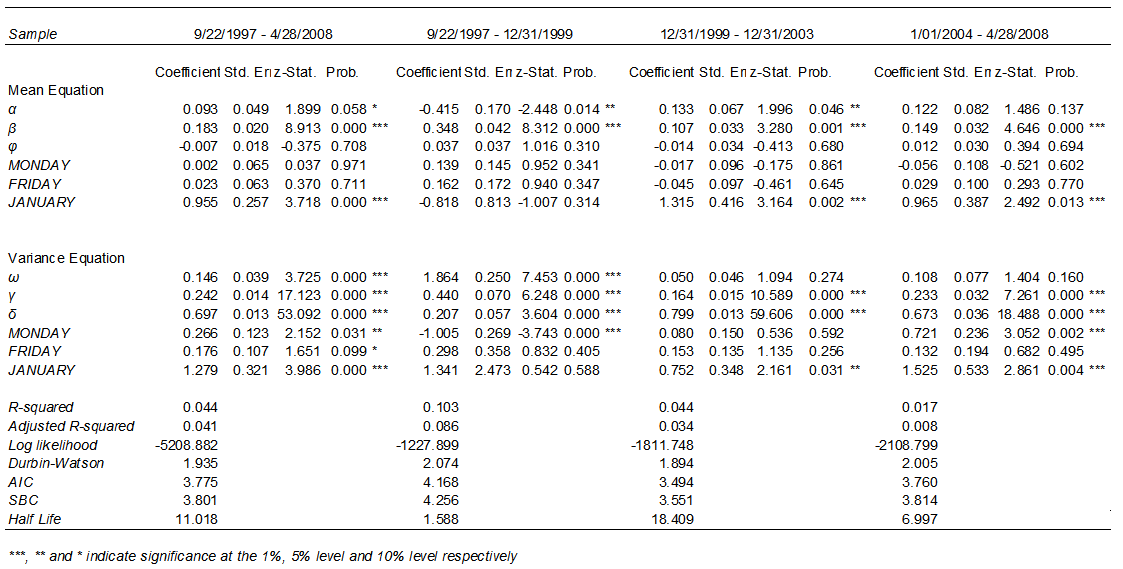 | Table 4. GARCH-M estimates with seasonal effects for full and split sample |
6. Conclusions
- This paper examines weak-form market efficiency in the largest Romanian stock exchange using dollar-converted returns from its main index BET. Employing a GARCH methodology, we find evidence that the BSE is still not weak-form efficient. Further evidence of market inefficiency is found in the consistent presence of a significant January effect. These findings are generally contrary to the conclusions in Harrison and Patton (2005), who conclude that the Romanian stock exchange was largely efficient by the year of 2000.
Note
- 1. See the information on BET provided by the BSE available at
 http://www.bvb.ro/IndicesAndIndicators/ indices.aspx
 Abstract
 Reference
 Full-Text PDF
 Full-text HTML