Hansong Xu 1, Kun Hua 1, Wei Wang 2, Mandy Lu 3, Tigang Jiang 4
1Electrical and Computer Engineering Department, Lawrence Technological University, Southfield, USA
2Department of Computer Science, San Diego State University, USA
3Phillips Exeter Academy, Exeter, NH, USA
4Institute of Mobile Communications, University of Electronic, Science and Technology of China
Correspondence to: Kun Hua , Electrical and Computer Engineering Department, Lawrence Technological University, Southfield, USA.
| Email: |  |
Copyright © 2015 Scientific & Academic Publishing. All Rights Reserved.
Abstract
It’s highly risky for people who have heart problems going through a period time of emotional changes, like sometimes people feel angry, fear, etc. Real time Monitoring of ECG signal is very important to keep them away from dangerous situations. Since the wearable real time monitoring system has limited power supply for long time communication, the energy efficient transmission is expected. Especially under complex environments, we need to keep the important information protected to ensure classification accuracy. This paper has the following three contributions: first, stress features are extracted from spectrum analysis of stress ECG signal through Discrete Wavelet Transform (DTW). Second, a K-Nearest Neighbor (KNN) classification is applied for different stress levels by analyzing the stress features extracted from ECG signals. Finally, Unequal Error Protection strategy is adopted to achieve energy efficiency. Through aforementioned methods, both signal interpretation quality and energy efficiency are guaranteed in wireless body area sensor network.
Keywords:
Electrocardiogram (ECG), Emotional stress, Energy efficiency, Discrete Wavelet Transform (DTW), K-Nearest Neighbor (KNN)
Cite this paper: Hansong Xu , Kun Hua , Wei Wang , Mandy Lu , Tigang Jiang , Energy Efficient ECG Monitoring System for Human Emotional Stress Assessment, Computer Science and Engineering, Vol. 5 No. 1A, 2015, pp. 8-14. doi: 10.5923/s.computer.201501.02.
1. Introduction
In recent years, a lot of efforts have been done to analysis effects of emotional stress through ECG signals. It needs to be noted that emotional stress or negative stress will cause a series of harmful impacts for people’s physical and mental health like heart diseases and high blood pressure, even some diseases like bipolar disorder, anxiety, depression, paranoia, etc. [1]. In this case a wearable energy efficient real time ECG signal monitoring and stress signal classification are necessary for patients. Energy efficiency is one of the most important factors for wireless real time long-term ECG signal monitoring system [2]. And compression is preferred for redundant medical signals. Basically, there are two main methods to compression data, lossless and lossy compression [3]. Lossless compression method is to maintain full information of original signals, and the compression ratio is low, while lossy compression can obtain a higher compression ratio by losing some unimportant information. We apply DWT compression method in this paper for the ECG signals [3]. Then stress features are extracted from DWT signals and treated as inputs of the K-Nearest Neighbor (KNN) classification system. Finally, Unequal Error Protection (UEP) strategy is adopted to achieve energy efficiency and compared with traditional encoding methods.
2. Peer Work Review
In 2014, paper [1] discussed negative emotional stress may cause mental illness and physical problems, Plenty of experiments has been made to test different group of people under different kinds of emotional stress from all age level, by analyzing the Electrocardiogram (ECG) signal changes. But obviously, it requires long period of time for stress detecting, thereby, it won’t be able to be applied for real time monitoring. Especially for emergency situation, it couldn’t support further analysis and quick response [1]. Meanwhile, paper [2] discussed the energy efficiency with different compression methods, but it didn’t consider signal protection under severe channels [4].Paper [3] discussed the real time monitoring system, by simply using on-body sensors for ECG signal detection. Then an adaptive protection applied to important ECG signal. Simultaneously, unimportant ECG signal was compressed accordingly. Such improved method can improve communication quality, as well as, transmission efficiency. But it is not specifically designed for human emotional ECG analysis. In this paper, we are proposing a novel ECG signal monitoring and stress signal classification system.
3. Methodology
Real time monitoring for ECG signals requires high data transmission rate, reliable communication system and stable power supply. On-body signal processing method is needed for real time monitoring, to reduce the transmission data and promise the quality of signal communication. At the same time, any loss or accidentally transmission should be prohibited because it may cause uncontrollable medical accident or severe unpredictable heart problems. We are using Shimmer® system (as shown figure 1), which is able to detect ECG signals from human body, plus, we build up a software platform to analysis the ECG signals (as shown in figure 2), which collected from Shimmer. Low Pass Filter (LPF) and High Pass Filter (HPF) are applied to remove noise energy (as shown in figure 3).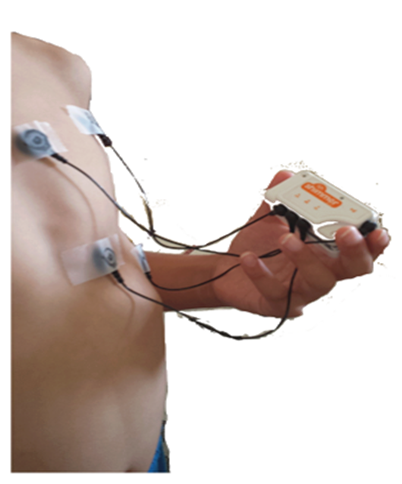 | Figure 1. Shimmer® system detecting ECG signal |
As shown in figure 1, the Shimmer® wireless body sensor system is applied and received ECG signals are displayed in figure 2.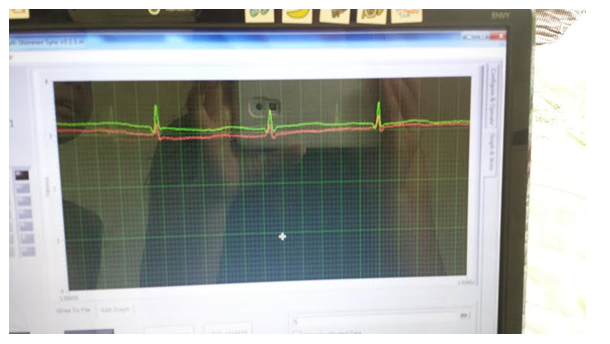 | Figure 2. ECG signals on Shimmer® wireless body sensor system |
A. Remove Noise Energy of ECG SignalsBaseline wondering is an effect that the X-axis is wandering up than it should be. Specially, in the ECG signals, it causes the ECG signals entirely moved away from baseline, strongly affect the proper way to analysis the signals. We firstly remove the baseline wandering (see figure 3). Then, high pass frequency filter and low pass frequency filter are applied to remove the unwanted artifact and machine noise (see figure 4). 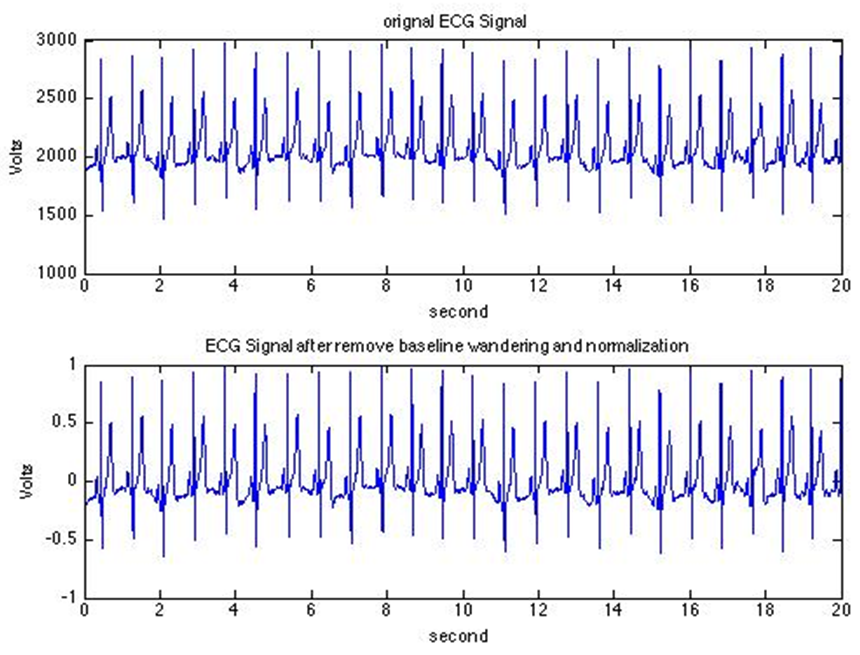 | Figure 3. Original signal and signal after baseline wandering removal |
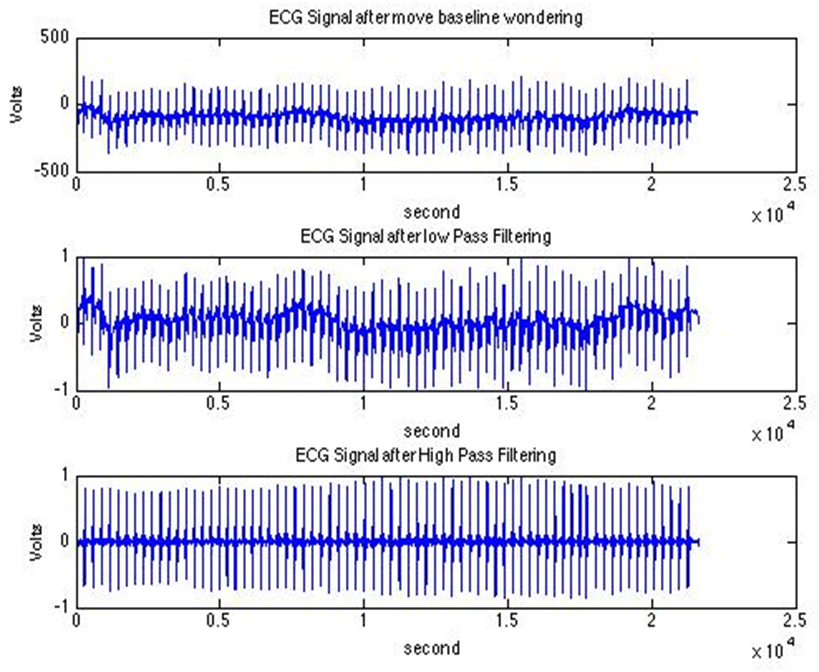 | Figure 4. Apply LPF and HPF for ECG signals |
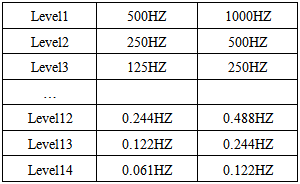
B. Apply DWT Compression to ECG SignalWe apply DWT on preprocessed ECG signals for a better de-composing solution. Compared with Fast Fourier Transformation (FFT) and Short Time Fourier Transformation (STFT), which is works well in frequency domain but lack of response in time domain, DWT works well both in frequency domain and time domain. Plus, DWT has been used on feature extraction by several researchers, and the results turn out really good [4]. For extracting ECG signal for stress related analysis, the ECG signal is de-composing to 14 levels for better results [5]. The stressed ECG signal after 14 levels decomposition clearly shows the detail in each frequency bands, from high to low (figure 5). Extracting stress features from ECG signals, LF band (0.05-0.14)HZ and HF band (0.14-0.5)HZ were chosen and using ‘db4’ wavelet function to get better extraction results in those frequency bands.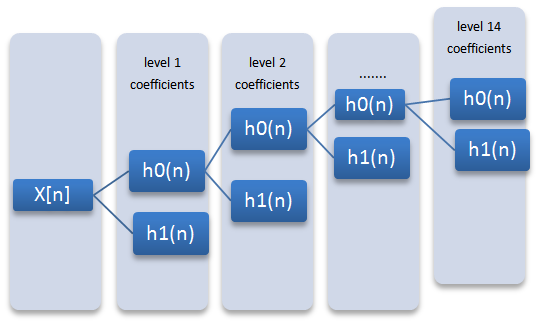 | Figure 5. 14 level decomposition diagram |
Coefficients Frequency diagram for DWT is shown in Table 1 and DWT result for ECG signals is displayed in figure 6.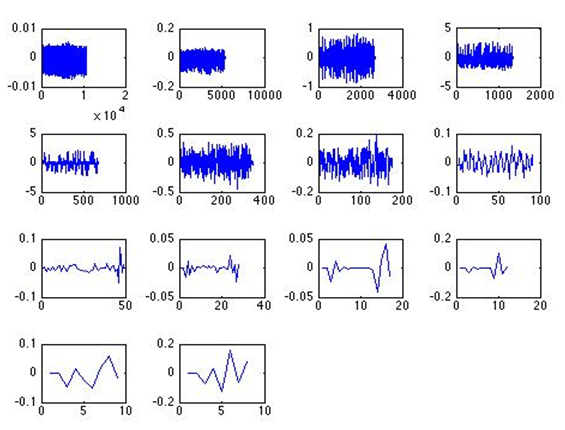 | Figure 6. Display 14 level de-composition using DWT |
Table 1. Coefficients Frequency diagram for DWT
 |
| |
|
We then apply 'DWT' compression to ECG signals. 'x3' is a matrix after de-noising. 'DWT' function is processed to 'x3' matrix, as shown in figure 7. | Figure 7. Apply DWT compression on De-noised Signals Before: ‘x3’ |
Here Compression ratio = the data size of 'x3' /'D1' =50%The next step is to apply DWT from ‘x3’to’D1’ after 50% compression (see figure 8). Here similarity rate is how many percent of ‘x3’/’D1’ equals to compression ratio.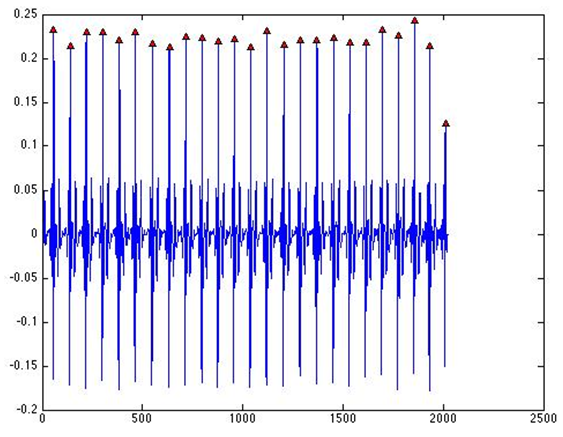 | Figure 8. Apply DWT compression on the de-noised signals (after D1) |
This result in figure 8 shows the DWT compression is successfully applied on the de-noisied ECG signal, and compression ratio is 0.5000 (or 50%). C. Feature extraction using Discrete Wavelet Transform Since we have known ECG signal features is detected by peaks and locations, which presented by average distance between peaks, and MaxNN, SDNN, RMSSD, mean of the peaks. HRV index contains majority information of an ECG signal. As long as the HRV indexes of compressed ECG signal is some level same as the HRV indexes of original ECG signals, we can say the compression method is able to use.HRV index in time domain are listed below, equation 1 to 4 [6].Inter-beat interval: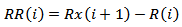 | (1) |
Mean of the R-R-intervals: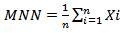 | (2) |
Standard Deviation of the R-R-intervals: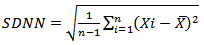 | (3) |
Root mean square of R-R-interval differences.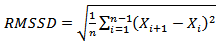 | (4) |
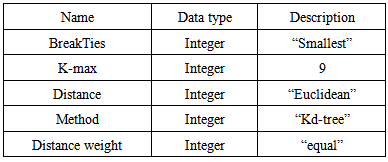
D. Stress level classification using K-Nearest Neighbors K-Nearest Neighbor classification is instance-based learning process, classifying the unknown distance from known distance. The input data of KNN classification is a set of features, which is extracted form LF band and HF band of stress ECG signals, also called feature vectors. K-Nearest Neighbor measures the distance information between features and class-stress or normal. The output data is one of the classes. The KNN training phase is to set up a model with different class label accordingly, and then fit the features into the class, find the best way to distinguish two classes. The KNN predict phase is simply input a new feature set with the classification prefer model, then the K-Nearest Neighbor will label the new feature set to the class. KNN classification parameters is shown in Table 2. Table 2. KNN Classification Parameters
 |
| |
|
4. Experimental Results
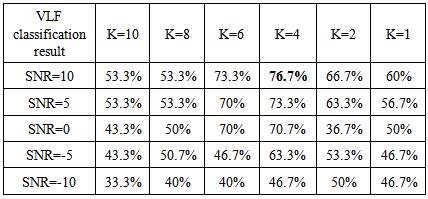
Table 3-5 is showing the classification results with various SNR and K value selection in KNN for Very Low Frequency (VLF), Low Frequency (LF) and High Frequency (HF) respectively. Results show that the optimal performances are achieved through different K values (K=4, 2 and 1, respectively) for VLF, LF and HF bands of ECG signals.Table 3. Very Low Frequency Components Classification Results with various SNR and K value selection
 |
| |
|
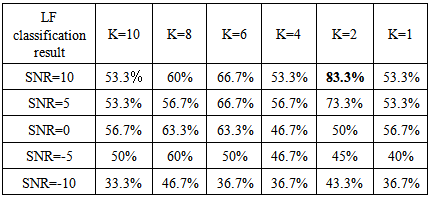
Table 4. Low Frequency Components Classification Results with various SNR and K value selection
 |
| |
|
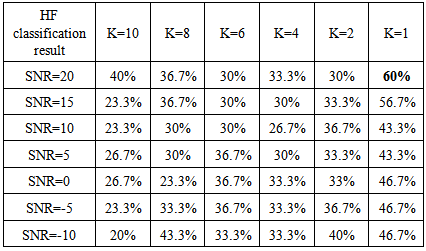
Table 5. High Frequency Components Classification Results with various SNR and K value selection
 |
| |
|
Several characters of this KNN classification system can be observed that: (1) For VLF, the maximum classification rate is 76.7% at K=4, SNR=20 dB; (2) For LF, the maximum classification rate is 83.3% at K=2, SNR=20 dB;(3) For HF, the maximum classification rate is 60% at K=1, SNR=20 dB;And some conclusions as following:According to their classification rate, VLF and LF bands components are playing more important role than HF [see figure 9 of two VLF (13 and 14) layers’ normalized performances].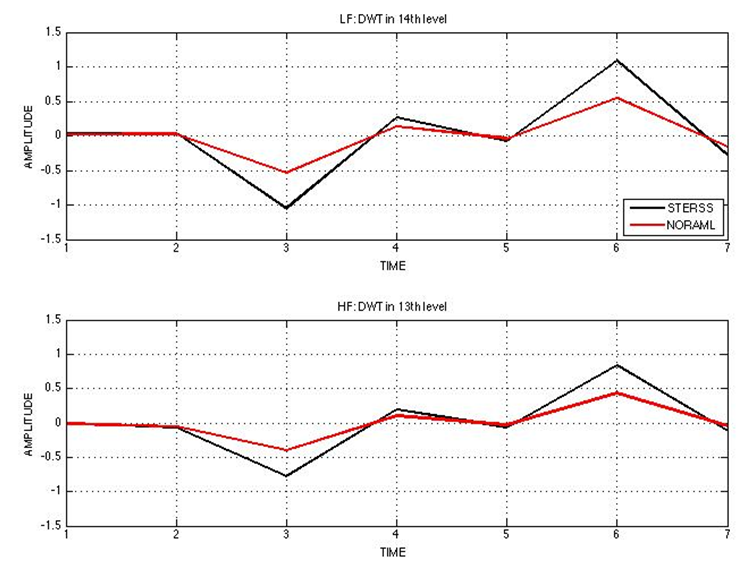 | Figure 9. Normalized Classifications Performances of Stress and normal signals at LF and HF |
The higher of SNR, the better of the classification rate, because noises will impact the detection capability of KNN system. But it needs to be noted that the classification doesn’t have linear relationship with SNRs. This is reflecting the non-linear character of KNN classifications. For various frequency bands, the best K value to achieve best classification are also different. Especially considering the different contributions to classification accuracy from VLF, LF and HF, we consider apply different portion of encoding sizes to each part accordingly, which is also called Unequal Error Protection (UEP), as shown in figure 10 and 11. In figure 11, UEP (green) can achieve similar classification rate as full-encoding (red), and both outperform non-protection scheme (blue).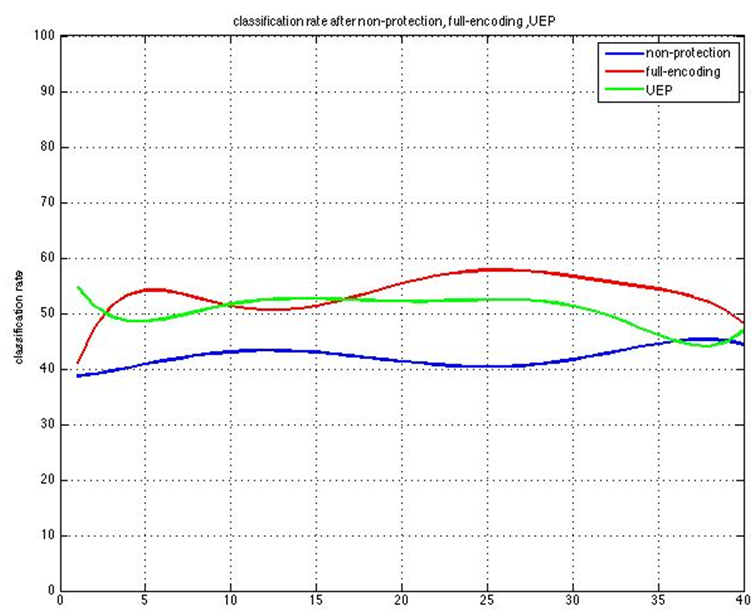 | Figure 10. Comparison of classification rates of non-protection, full-encoding and UEP schemes |
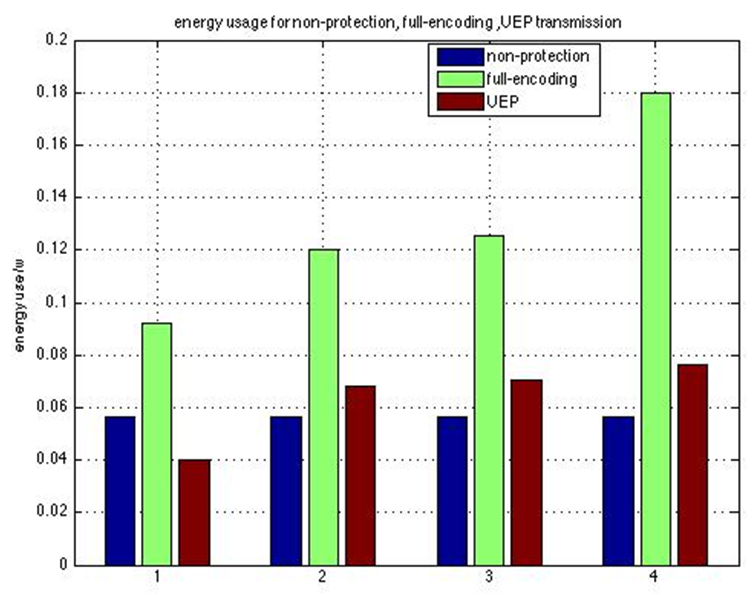 | Figure 11. Energy Cost of Three Schemes under various channel environments (Respectively, 1: SNR=-10dB, 2: SNR=-5dB, 3: SNR=5 dB, and 4: SNR=10dB) |
Meanwhile in figure 11, Energy Cost of Three Schemes under four various channel environments, which are 1: SNR=-10dB, 2: SNR=-5dB, 3: SNR=5 dB, and 4: SNR=10dB, respectively. For full encoding scheme, each original data will be encoded and then the energy cost will be increase 1.5-3 times. UEP scheme only consume 60% or even less energy by on protecting important low frequency and very low frequency bands.
5. Conclusions
In this paper, a real-time ECG signal monitoring system has been built up through Shimmer® wireless body sensor platform. Then, we used Discrete Wavelet Transform for emotional stress features extraction. After that, K-Nearest Neighbor classification method for stress level classify has been applied. Simulation results show our proposed unequal error protection human stress level assessing system is not only quality guaranteed but also energy efficient. The future work includes its application in frequency-selective channel and to build up a comprehensive UEP stress level assessing system through multiple biomedical signals, e.g., ECG, EMG and blood pressure signals.
ACKNOWLEDGEMENTS
Part of this work is supported by the National Natural Science Foundation of China under grant No. 61271170.
References
| [1] | B. Zheng; M. Murugappan, S. Yaacob, S. Murugappan, "Human emotional stress analysis through time domain electromyogram features", Industrial Electronics and Applications (ISIEA), IEEE, 2013 IEEE Symposium on, pp.172 – 177, AUG 2014. |
| [2] | C. Lai; Min Chen; J. Pan; C. Youn; H. Chao “A Collaborative Computing Framework of Cloud Network and WBSN Applied to Fall Detection and 3-D Motion Reconstruction” Biomedical and Health Informatics, IEEE Journal of (Volume:18, Issue: 2), pp. 457 – 466, AUG 2014. |
| [3] | Honggang Wang Dongming Peng; Wei Wang; Sharif, H.; Hsiao-Hwa Chen; Khoynezhad, A.” resource aware secure ECG healthcare monitoring through body sensor networks” Wireless Communications, IEEE (Volume:17, Issue: 1), February 2010. |
| [4] | Haboba, J.; Mangia, M.; Pareschi, F.; Rovatti, R.; Setti, G. "A Pragmatic Look at Some Compressive Sensing Architectures With Saturation and Quantization", Emerging and Selected Topics in Circuits and Systems, IEEE Journal on (Volume:2 , Issue: 3 ), pp. 443 – 459, AUG 2014. |
| [5] | Jingbing Li; Chunhua Dong; Mengxing Huang; Yong Bai; Huaiqiang Zhang "The medical images watermarking using DWT and Arnold”, Computer Science and Automation Engineering (CSAE), 2012 IEEE International Conference onpp. 27 – 31, AUG 2014. |
| [6] | Rajendra G. Sutar; Ashwin G. Kothari; A. G. Keskar “Development of an embedded system for real time Heart Rate Variability analysis”, Communications and Information Technologies (ISCIT), 2013 13th International Symposium onpp. 288-291, AUG 2014. |
| [7] | J.G. Proakis Digital Communications, McGraw-Hill Book Company, 1983, pp146. |
| [8] | B.P. Lathi, Moden Digital and Analog Communication Systems, 3rd ed. 198 Madison Avenue, New York: Oxford University Press, 1998, pp. 467–471. |
| [9] | R. Benzid, F. Marir. And N.E. Bouguechal, “Electrocardiogram Compression Method Based on the Adaptive Wavelet Coefficients Quantization Combined to a Modified Two Role Encoder”. IEEE Signal Processing Letters, Vol. 14, No.6, June 2007. |
| [10] | W. Wang, “Energy-Constrained Distortion Reduction Optimization for Wavelet-Based Coded Image Transmission in Wireless Sensor Networks”, IEEE TRANSACTIONS ON MULTIMEDIA, VOL. 10, NO. 6, OCTOBER 2008. |
| [11] | W. Wang, D. Peng, H. Wang, H. Sharif, and H. H. Chen, “Optimal image component transmissions in multirate wireless sensor networks,” in Proc. IEEE GlobeCom, Nov. 2007, pp. 976–980. |
| [12] | W. Wang, D. Peng, H. Wang, H. Sharif, and H. H. Chen, “Taming underlying design for energy efficient Distributed source coding in multirate wireless sensor network,” in Proc. IEEE VTC, Apr. 2007, pp. 124–129. |
| [13] | W. Wang, D. Peng, H. Wang, H. Sharif, and H. H. Chen, “Energy efficient multirate interaction in distributed source coding and wireless sensor network,” in Proc. IEEE WCNC, Mar. 2007, pp. 4091–4095. |
| [14] | H. Wang, D. Peng, W. Wang, H. Sharif, and H. H. Chen, “Interplay between routing and distributed source coding in wireless sensor network,” in Proc. IEEE ICC, June 2007, pp. 3776–3781. |
| [15] | K. Hua, H. Wang, W. Wang and S. Wu, “Adaptive Data Compression in Wireless Body Sensor Networks”, in Computational Science and Engineering (CSE). 2010 IEEE 13th International Conference on, 2010, pp. 1-5. |
 Abstract
 Reference
 Full-Text PDF
 Full-text HTML