-
Paper Information
- Previous Paper
- Paper Submission
-
Journal Information
- About This Journal
- Editorial Board
- Current Issue
- Archive
- Author Guidelines
- Contact Us
International Journal of Composite Materials
p-ISSN: 2166-479X e-ISSN: 2166-4919
2013; 3(6A): 45-57
doi:10.5923/s.cmaterials.201309.05
Quantification of Matrix and Reinforcement Effects on the Young’s Modulus of Carbon Nanotube/Epoxy Composites using a Design of Experiments Approach
 Abstract
 Reference
 Full-Text PDF
 Full-text HTML
Hossein Rokni 1, 2, Abbas S. Milani 2, Rudolf J. Seethaler 2, Meisam Omidi 3
1Department of Mechanical Engineering, University of Michigan, Ann Arbor, MI 48109, USA
2School of Engineering, University of British Columbia Okanagan, Kelowna, BC V1V 1V7, Canada
3School of Science, Shahid Beheshti University, Tehran, Iran
Correspondence to: Abbas S. Milani , School of Engineering, University of British Columbia Okanagan, Kelowna, BC V1V 1V7, Canada.
| Email: |  |
Copyright © 2012 Scientific & Academic Publishing. All Rights Reserved.
The focus of this work is to present a methodology to systematically study and classify the influence of a set of controllable parameters during the fabrication of carbon nanotube (CNT)/epoxy composites on the material’s elastic modulus. The chosen factors include two types of polymer matrices (i.e., LY 5052 and LY 564), two types of carbon nanotubes (i.e., single- and multi-walled carbon nanotubes), functionalized and pristine carbon nanotubes, and different weight-percents (wt.%) of CNTs. A factorial design of experiment (DOE) with mixed levels has been employed to estimate the contribution of the aforementioned factors, along with their interactions, in the maximization of the Young’s modulus of the fabricated CNT/epoxy composites. Over 120 specimens were fabricated and tensile tests were carried out to obtain an optimum Young’s modulus of the CNT/epoxy composite. The results indicate that among control parameters, the wt.% of CNTs and the type of CNTs have the highest effects, whereas their interaction has the least effect. It is also shown that the functionalized CNTs can significantly diminish the effect of noise factors, arising from the CNT waviness, debonding between CNTs and polymer matrices, the random orientation of CNTs and non-uniform CNT dispersion. Among tested material configurations, the highest Young’s modulus (4.135 GPa) was achieved on the functionalized single-walled carbon nanotube/amine resin LY5052 containing 1.5 wt.% of CNTs. This corresponded to a 33% improvement compared to the pure epoxy resin LY5052. The presented methodology is straightforward and can be applied to other types of CNT-reinforced composites.
Keywords: A. Polymer-matrix composites (PMCs), B. Mechanical properties, C. Statistical properties/method, D. Mechanical testing
Cite this paper: Hossein Rokni , Abbas S. Milani , Rudolf J. Seethaler , Meisam Omidi , Quantification of Matrix and Reinforcement Effects on the Young’s Modulus of Carbon Nanotube/Epoxy Composites using a Design of Experiments Approach, International Journal of Composite Materials, Vol. 3 No. A, 2013, pp. 45-57. doi: 10.5923/s.cmaterials.201309.05.
Article Outline
1. Introduction
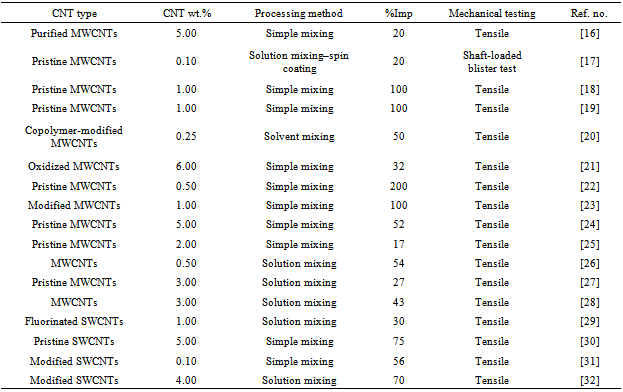
- After being recognized in 1991 by Iijima[1], carbon nanotubes (CNTs) rapidly attracted the attention of many research groups due to their exceptional mechanical properties as reinforcing materials. Today CNTs are used in a wide range of applications including lightweight composite structures, field emission devices, electronics, micro/nano-electro-mechanical system (MEMS/NEMS) devices, sensors, actuators, nano-robotics and medical applications. CNTs can be classified into two most widely recognized categories: single-walled carbon nanotubes (SWCNTs) and multi-walled carbon nanotubes (MWCNTs). SWCNTs have more intimate contacts with the matrix material, leading to more efficient load transfer between the composite constituents. On the other hand, MWCNTs can be produced in much larger quantities at lower cost.The present literature reveals that the introduction of CNTs as reinforcing materials in polymer matrices can significantly improve mechanical properties[2–12]. An excellent survey of the research studies on the mechanical and electrical properties of CNT-polymer composites has been recently carried out by Ma et al.[13], Spitalsky et al.[14] and Sahoo et al.[15]. Among earlier works published on the subject, only a few have specifically dealt with the effect of MWCNTs or SWCNTs on the Young’s modulus of epoxy-based composites and, hence, they will be addressed in the following review sections. Table 1 summarizes highlights of this background work by other research groups.
1.1. Effect of MWCNTs
- One of the earliest reports on the Young’s modulus of CNT/epoxy composites dates back to the work of Schadler et al.[16], in which the elastic modulus increased from 3.1 to 3.71 GPa (i.e., a 20% increase) by adding 5 wt.% of MWCNTs. Xu et al.[17] reported an increase in the Young’s modulus of MWCNTs-reinforced epoxy composites from 4.2 to 5 GPa (19% increase) at only 0.1 wt.% of MWCNTs. Allaoui et al.[18] reported that the elastic modulus of the MWCNT/epoxy composites can be doubled when 1.0 wt.% of MWCNTs was mixed with a rubbery matrix. A double increase of the Young’s modulus from 1.2 to 2.4 GPa was also observed by Bai[19] for MWCNT/epoxy composites with 1.0 wt.% of CVD-MWCNTs. Li et al.[20] achieved 50% enhancement in stiffness by introducing 0.25 wt.% of copolymer-modified MWCNTs to the epoxy composite. Breton et al.[21] achieved a 32% increase in the Young’s modulus of oxidized MWCNT/epoxy composites with the addition of 6 wt.% CVD-MWCNTs. An experimental investigation for properties of MWCNT/epoxy composite was conducted by Ci and Bai[22]. They reported that only 0.5 wt.% MWCNT addition can increase the Young’s modulus of the epoxy composite up to 200%. Tseng et al.[23] showed an over 100% improvement of the Young’s modulus of functionalized MWCNT/epoxy composites with only 1.0 wt.% addition of MWCNTs. Yeh et al.[24] added MWCNTs to the epoxy resin E120-H100 and demonstrated that the addition of 5 wt.% MWCNTs increases the Young's modulus of MWCNT/epoxy composite up to 51.8%. Chen et al.[25] showed that the incorporation of 2 wt.% of MWCNTs led to an increase of the Young’s modulus of epoxy composites up to 17%. Spitalsky et al.[26] observed a two fold increase of the Young’s modulus of oxidized MWCNT/epoxy composites by adding of 0.5 wt.% of MWCNTs. With 3 wt.% addition of MWCNTs, an enhancement of up to 27% in Young’s modulus of MWCNT/epoxy composite was observed by Montazeri et al.[27]. Recently, Omidi et al.[28] reported that only a 3 wt.% addition of MWCNTs enhanced the Young’s modulus of the epoxy composite up to 43.1%.
1.2. Effect of SWCNTs
- A review of the past literature indicates that generally less attention has been devoted to SWCNT-reinforced epoxy composites as compared to MWCNT composites. A 30% improvement in the Young’s modulus was obtained by Zhu et al.[29] after adding 1.0 wt.% functionalized SWCNTs to the epoxy composite. Li et al.[30] also observed an increase up to 75% with 5 wt.% SWCNTs in epoxy composites. Valentini et al.[31] reported that 56% improvement in the Young’s modulus of amino-functionalized SWCNT/epoxy composites was achieved by adding only 0.1 wt.% of SWCNTs. Zhu et al.[32] showed that up to 70% improvement in the Young’s modulus was found for epoxy composites with 4 wt.% of functionalized SWCNTs.
1.3. Motivation and Organization of the Work
- In all studies reported in Table 1, a significant improvement in mechanical properties of epoxy composites has been obtained by means of varying different process parameters in the fabrication of specimens. However, there has been no systematic approach recommended to quantify the effect of each fabrication parameter and study potential interaction effects between them in controlling the mechanical response of the ensuing nanocomposites1.
|
2. Experimental Procedure
2.1. Materials
- SWCNTs, MWCNTs and their functionalized counterparts, produced by chemical vapor deposition (CVD), were purchased from Research Institute of Petroleum Industry (RIPI). The SWCNTs varied from 0.9 to 1.1 nm in diameter with the average length of 10 μm while the MWCNTs were characterized by an average outer wall diameter of 20-50 nm and an average length of 20 μm with a carbon purity of 96%. In order to prepare functionalized SWCNTs/MWCNTs, the oxidized SWCNTS/MWCNTs (SWCNTS/MWCNTs-COOH) were first achieved according to the HNO3 washing procedure; 8 g of pristine SWCNTS/MWCNTs were boiled in 400 ml of concentrated HNO3 for 40min. Then, SWCNTS/MWCNTs-COOH were filtered, washed with 600ml distilled water for several times to remove acid, and dried at 105◦C in an oven. During the second step, SWCNTS/MWCNTs-COOH was converted to acid chloride-functionalized SWCNTS/MWCNTs by refluxing in thionyl chloride for 72 h. Figure 1 shows the Fourier transform infrared spectroscopy (FTIR) of carboxylated MWCNTs, which peaks at 1704cm-1, 1206 cm-1 and 1079 cm-1 corresponding to C=O, C-O-C asymmetric, and C-O-C symmetric stretches, respectively. These peaks indicate successful generation of –COOH groups on the CNTs. The CNTs were embedded in two commercially available thermosetting polyester epoxies LY 5052/LY 564 with a low viscosity and HY 5052/HY 560 hardeners, respectively.
2.2. Preparation of the CNT/epoxy Composite Specimens
- SWCNTs and MWCNTs were initially dispersed into hardener by tip sonication for 30 min to achieve a good dispersion. The sonication process was carried out in pulse mode and sonication power was adjusted at 60% amplitude to avoid over-heating the samples. The epoxy resin and hardener were mixed at a weight ratio of 100:30. Subsequently, the mixture was stirred with high-speed dispersant under 900rpm for 15 min. The mixture was cast into a metallic mold and cured at 50°C for 15 hour. The prepared composite samples were then mechanically polished to form smooth surfaces. Another thermal curing procedure for each sample was conducted at 100°C for 4 hours to achieve higher mechanical properties of the CNT/epoxy composites. Here the assumption is that both SWCNT and MWCNT nanocomposites have been prepared under the same chemical procedure, hence allowing the subsequent statistical analyses to be unbiased. Figure 2 shows a typical Transmission Electron Microscope (TEM) image of MWCNTs.
2.3. Micrography of Tested CNT/epoxy Composites
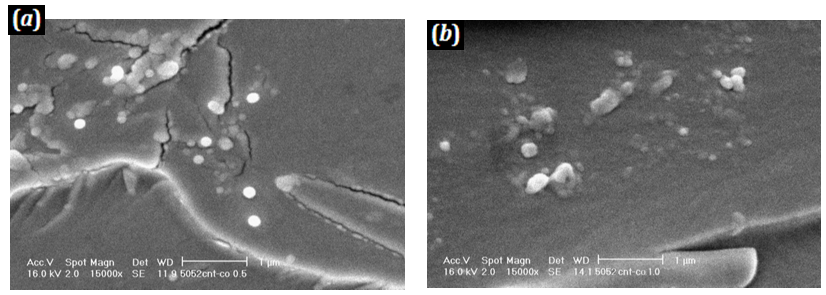
- Based on the ASTM D 638 (Type I), uniaxial tensile tests were performed at room temperature using Zwick Roel/Amsler under a crosshead speed of 1 mm/min. The dimensions of the specimens were 168 mm in length, 13 mm in width and 5 mm in thickness. Samples without CNT addition (pure polymer samples) were also fabricated for comparison purposes. To achieve more reliable experimental results, four samples were fabricated and tested for each wt.% of MWCNTs.Scanning electron microscopy (SEM) was employed to observe the fracture surface of the samples after the tensile tests. Figures 3(a) and 3(b) show the SEM micrographs of fractured surface of the pristine epoxy LY 564 and the 0.5 wt.% functionalized MWCNT/epoxy composite, respectively. The fracture surface of the epoxy resin LY 5052 reinforced with 0.5 and 1.0 wt.% of functionalized MWCNTs are also shown in Figures. 4(a) and 4(b), respectively. Figures 3 and 4 indicate that functionalized MWCNTs have been reasonably well distributed and dispersed in the pure epoxy resin and the original traces of the imbedded MWCNTs can be clearly distinguished from the pattern of the fracture surfaces. In addition, a good interfacial adhesion can be observed due to the extremely low pull out of functionalized MWCNTs from the pure polymer matrix.
2.4. Mechanical Properties of the Tested Composites
- Mechanical properties of CNT/epoxy composite specimens made of LY564 and LY5052 polymers reinforced with 0.25, 0.50, 1.00 and 1.50 wt.% of pristine and functionalized SWCNTs/MWCNTs are plotted in Figure 5, where the average values of four samples are taken into account for each composition. The Young’s modulus of each material configuration is calculated as the average of the slope of the stress–strain curve in the linear region (<2% strain). Figures 5(a) and 5(b) show that the addition of CNTs resulted in an increase in both the Young’s modulus and the tensile strength for all wt.% of CNTs, when compared with the pure polymer samples made of LY5052 and LY564. It should be noted that PSWCNT, FSWCNT, PMWCNT and FMWCNT in Figure 5 represent pristine SWCNT, functionalized SWCNT, pristine MWCNT and functionalized MWCNT, respectively.
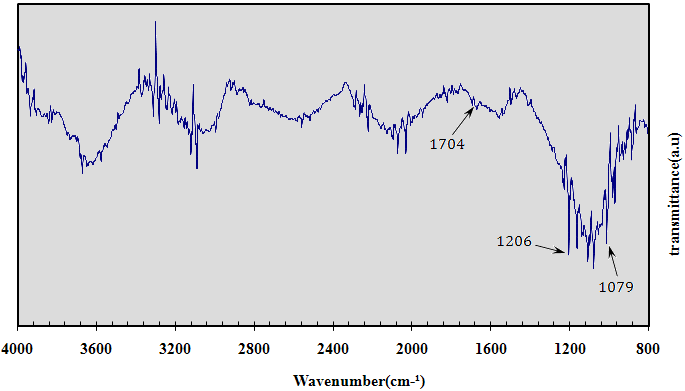 | Figure 1. FTIR spectrum of functionalized CNTs (MWCNT-COOH) |
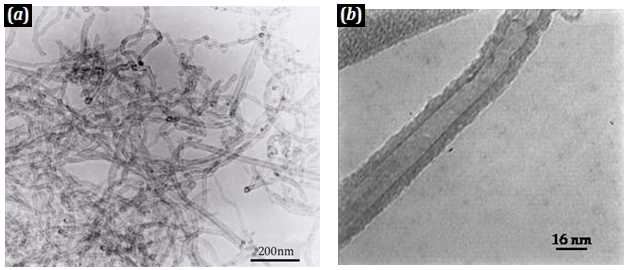 | Figure 2. TEM micrographs of MWCNTs: (a) low magnification micrograph; (b) high magnification micrograph |
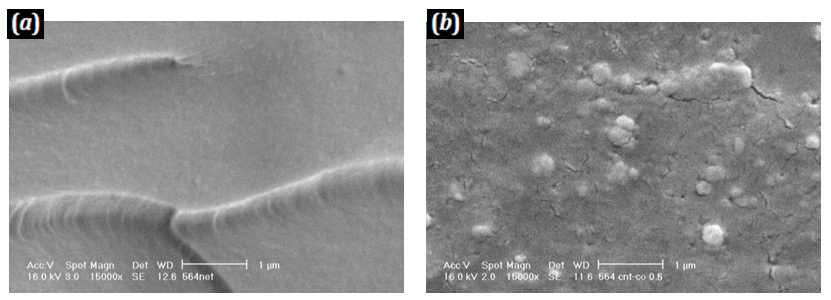 | Figure 3. SEM micrographs of fracture surface of (a) pure polymer matrix LY 564, and (b) 0.5 wt.% functionalized MWCNT/epoxy LY 564 composites |
 | Figure 4. SEM micrographs of fracture surface of (a) 0.5 wt.% functionalized MWCNT/epoxy LY 5052 composites, and (b) 1.0 wt.% functionalized MWCNT/epoxy LY 5052 composites |
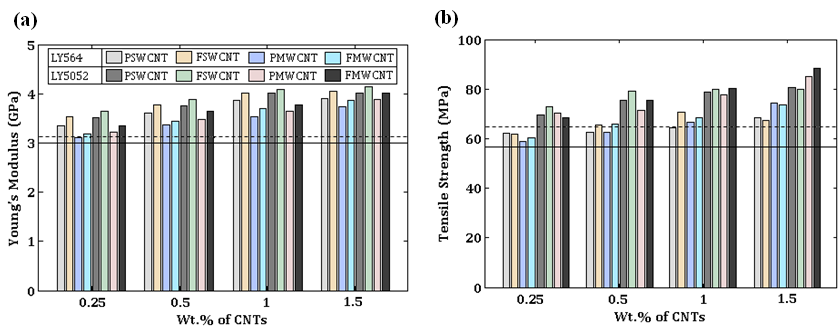 | Figure 5. Mechanical response of the CNT/epoxy composites vs. CNT weight percentage: (a) Young’ modulus, (b) tensile strength. The dashed and solid lines represent the properties of pure epoxy LY5052 and LY564, respectively. PSWCNT, FSWCNT, PMWCNT and FMWCNT represent pristine SWCNT, functionalized SWCNT, pristine MWCNT and functionalized MWCNT, respectively |
3. Methodology: Design of Experiments (DOE)
- DOE is a widely used technique to study different factors affecting the output of an experiment. In fact, DOE helps experimenters conduct a set of experiments strategically in such a way that they can gain the most possible information with minimal effort.
3.1. Mixed-level Factorial Designs
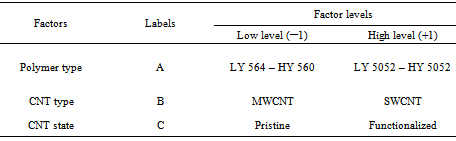
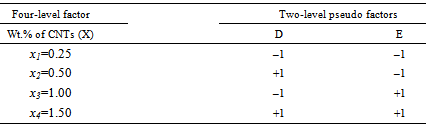
- One of the most used techniques in DOE is the factorial design in which all the possible combinations of variables and levels are experimented. In a standard factorial design, all factors (study parameters) have an identical number of levels. If the number of levels from one factor to another is different, however, mixed-level designs should be adapted [33].In the present study, the two types of polymer matrix (i.e., LY 5052 and LY 564), the two types of CNTs (i.e., SWCNTs and MWCNTs), the two CNT states (i.e., pristine and functionalized SWCNTs/MWCNTs) along with four wt.% of CNTs are considered as the main (controllable) factors. Table 2 summarizes the chosen two-level DOE used for the first three factors. Each factor takes coded values of –1 and +1 for its low and high levels, respectively.The wt.% of CNTs, on the other hand, is considered to have four possible levels as shown in Table 3. As a result, a mixed-level design of 41×23 (indicating 32 nominal experiments) should be considered. During subsequent statistical analyses, in order to accommodate the latter four-level factor (X) next to the other two-level factors (A, B, C in Table 2), an equivalent 22 design with pseudo factors D and E has been used to represent X (Table 3).
3.2. A Taguchi Analysis Method
- Taguchi’s approach in the field of DOE is frequently used for robust optimization problems by means of distinguishing between controllable and uncontrobale factors. In the Taguchi approach, experiments are performed at pre-specifed combinations of design runs (e.g., using orthognal arrays, facoraial designs, etc). Results of the experiments are then analysed and compared via the so-called signal-to-noise (S/N) ratios. Formally, a S/N ratio is the measure of the mean square deviation from the ideal reposne[33]. A higher S/N ratio renders a higer robustness in a design.Since the objective of the present work is to maximize the Young’s modulus of the CNT/epoxy composites, a “larger-the-better” type of S/N is adapted as follows[34].
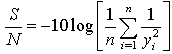 | (1) |
3.3. Designing and Running the Experiments
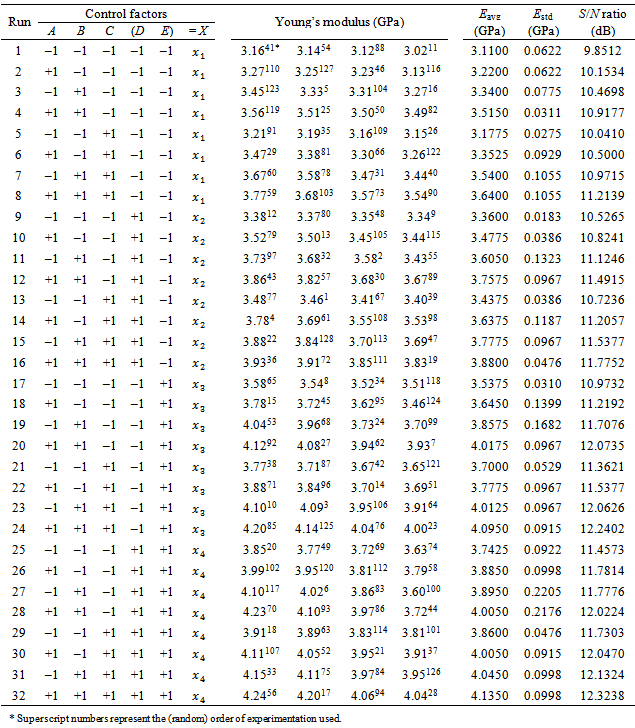
- In view of descriptions in Sections 3.1 and 3.2, the test matrix along with the obtained experimental results for the Young’s modulus of the CNT/epoxy composites for all factor combinations are summarized in Table 4. A total of 128 experiments (32 runs multipled by 4 repeats) were run in a random order as indicated in the table footnote. The high resolution of the 25 factorial design[33] allows us to estimate all main and interaction effects during the subsequent statistical analysis as follows.
|
|
|
4. Results and Discussion
4.1. The Effect of Control Factors and Checking the Model Assumptions
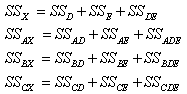
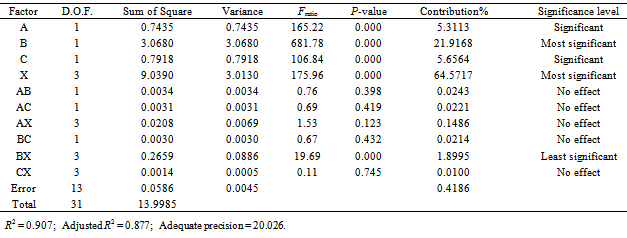
- The standard analysis of variance (ANOVA)[33] was employed to determine factors that have had statistically a significant effect on the Young’s modulus of the tested CNT/epoxy composites. Before any inferences are drawn from the analysis, however, let us check the main assumptions underlying standard ANOVA processes. The two main assumptions in this regard are the normality and randomness of the measurements to ensure the independence of test data (for more details of underlying assumptions in a standard ANOVA, please see[33]).Figures 6 and 7 depict the normal probability plots and the random distribution of data for the Young’s modulus response on the basis of the S/N ratio and mean values responses, respectively. It should be noted that the S/N response is normally used in robust design/optimization practice, whereas the mean response (i.e., signal only) is normally used in the absence of large noise effects. For comparison purposes in the present case, we employ both of these response types. The distributions of obtained residual errors along the (theoretical) normal line, and also the random distribution of data points versus the run order, ensure the reliability of the performed ANOVA.Next, to study the significance of control factors and their interactions, results of ANOVA for the S/N ratio and the mean response of the Young’s modulus are summarized in Tables 5 and 6, respectively. The analysis is undertaken for a minimum confidence level of 95%. Any p-value less than 0.05 in the ANOVA table indicates that the effect of the respective factor is significant, with a 95% confidence at least. The sum of squares (SS) for the factors including the mixed-level factor X were obtained as follows,
 | (2a-d) |
|
|

4.1.1. Main and Interaction Effect Plots: Determining the Optimum Material Configuration
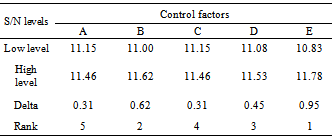
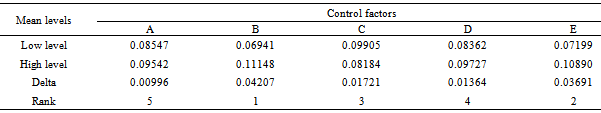
- The average of S/N ratios at each factor level from Table 5 were calculated and listed in Table 7. Delta values (absolute difference between the responses at high and low levels) are used in Table 7 as a criterion for ranking the control factors. The factors with higher delta values indicate greater impact on the response. Accordingly, the main factors can be ranked as E > B > D > C > A. This ranking could also be made through the percentage contribution of each factor, given in Tables 5 and 6.Next, using the values in Table 7, the main effect plots were established as shown in Figure 8(a). The plots indicate that all the four factors A, B, C and X (which is represented by a combination of D and E) have positive effects (positive slopes). Hence, if only the main effects are taken into account, they should be set at their high level to maximize the Young’s modulus of the CNT/epoxy composites. This means that the highest Young’s modulus (i.e., 4.135 GPa) is obtained for functionalized SWCNT/epoxy-LY5052 composites with 1.5 wt.% of CNTs. Based on Figure 8(a) for factor C, the improvement seen in response of the functionalized CNT/epoxy composites compared to the ones with pristine CNTs would also prove a better dispersion of the functionalized CNTs in the polymer matrix.Similarly, all possible two-factor interactions are plotted in Figure 8(b). It is seen from this figure that there are some interactions between the main factors B and D, B and E as well as D and E, though statistically they are not of high significance as measured by the ANOVA analysis in Table 5. It is worth noting from the BD and BE interactions that the effect of wt.% of CNTs is small when the SWCNTs are used, and is large when the MWCNTs are introduced to the polymer matrix. Although Tables 5 and 6 show that the BC interaction factor has a very low contribution, Figure 8(b) reveals the fact that the functionalization has less effect on the enhancement of the Young’s modulus in the MWCNT/epoxy composites, when compared to the SWCNT/epoxy composites. Similarly, in spite of the lack of statistically significant interaction between factors A and E, it can be deduced from the AE interaction plot in Figure 8(b) that the effect of wt.% of CNTs on the pure polymer LY5052 is smaller than that of LY564. Finally, it is worth recalling that a main advantage of Taguchi DOE is that it relies on a robust optimization approach by taking into account both controllable and uncontrollable (noise) factors. This is done through making use of statistical information from repeats of a test and defining a signal-to-noise index as in Eq. (1). Revisiting Table 4, it is noticed that the highest Young’s modulus (4.1350 GPa) has been obtained for the factor combination (run) #32 where all the experimental factors are set at level ‘+1’. However, this point has also had the highest standard deviation in the corresponding column. Thus for the analyst to make a final decision regarding both the average performance and robustness of the design points, S/N ratios should be employed. If the analysis only relies on the average response, non-robust points/material factors may be chosen.
|
4.2. A more in-depth Discussion on the Effect of Noise Factors
- Section 4.1 presented the analysis of test data regarding the effect of controlled parameters during the fabrication of CNT/epoxy composites. As shown through the obtained ANOVA results in Tables 5 and 6, the overall effect of noise factors (aggregated in the error term in ANOVA) have been insignificant for the performed experiments. Practically speaking, a variety of factors including the CNT waviness, the random orientation of CNTs, inappropriate CNT dispersion within the matrix, and debonding between CNTs and the matrix can be sources of error and cause variability in the Young’s modulus of the CNT/epoxy composites. Since these factors have been uncontrollable during the manufacturing process of the tested specimens, they are considered as noise. To exemplify the presence of these effects, Figure 9(a) shows a typical non-uniform dispersion of PMWCNTs 1.0 wt.% embedded in the epoxy LY 564 due to the van der Waals interactions. Similarly, TEM micrograph of the dispersed MWCNTs in ethanol shows the presence of waviness of the CNTs, Figure 9(b). Often experimenters are curious to know which ‘control’ factor would result in the highest or lowest magnitude of variability in the material response through its possible interactions with uncontrollable noise factors. Subsequently, appropriate control factors can be chosen to minimize data variability while improving the mean response of the material. In order to quantify the effect of noise factors on the Young’s modulus of the tested composite samples, the standard deviation values of Table 4 may be used as a measure of variability. For a given combination of control factors (i.e., each row in Table 4), a higher standard deviation indicates a higher variability in the mean Young’s modulus response. Consequently, Table 8 was established to present the mean standard deviation of the Young’s modulus over low and high levels of each control factor. It is noteworthy from Table 8 that the variability seems to be the highest when the type of CNT (factor B) is set at its high level (i.e., SWCNT). Similarly, it can be seen that the variability is the least when the type of the polymer (factor A) is set at its low level (i.e., LY 564 – HY 560 resin). Finally, Figure 10 was plotted based on the values of Table 8, to further indicate the positive effect of functionalization of the CNT surface (i.e., high level of factor C) in yielding a lower variability in the material response.
|
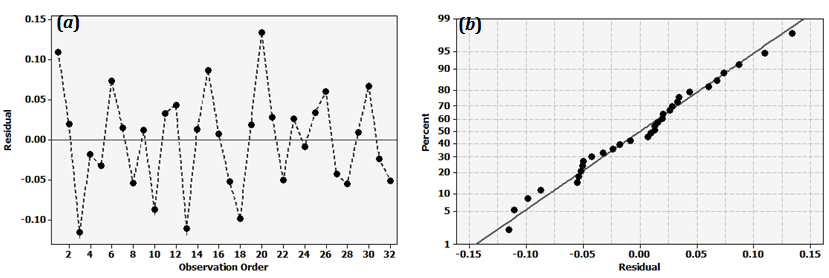 | Figure 6. (a) The variation of residuals versus observation order, and (b) the normal probability plot of residuals based on the S/N ratios |
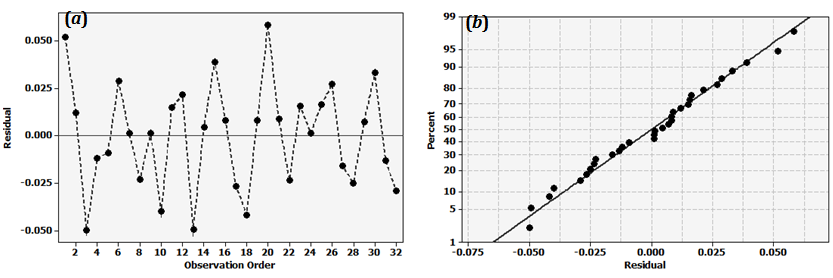 | Figure 7. (a) The variation of residuals versus observation order, and (b) the normal probability plot of residuals based on the mean response |
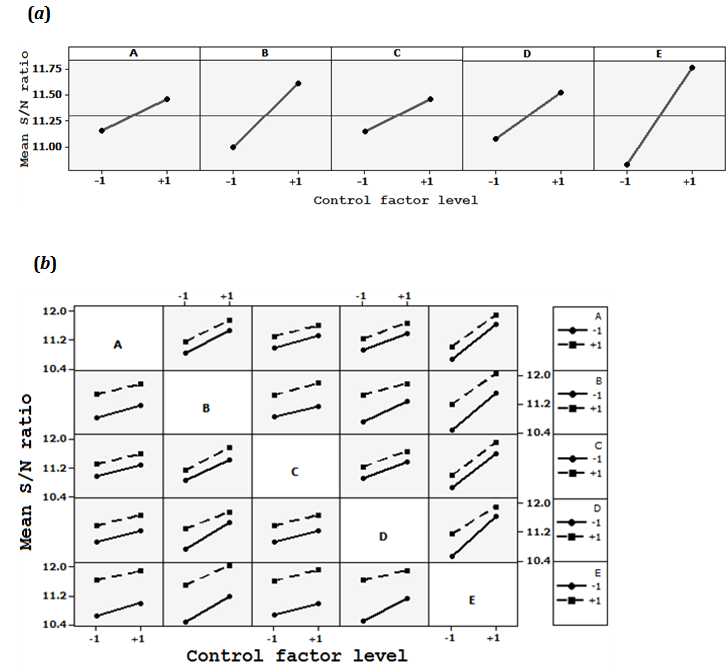 | Figure 8. Plots of (a) the main effects and (b) interaction effects based on the S/N response |
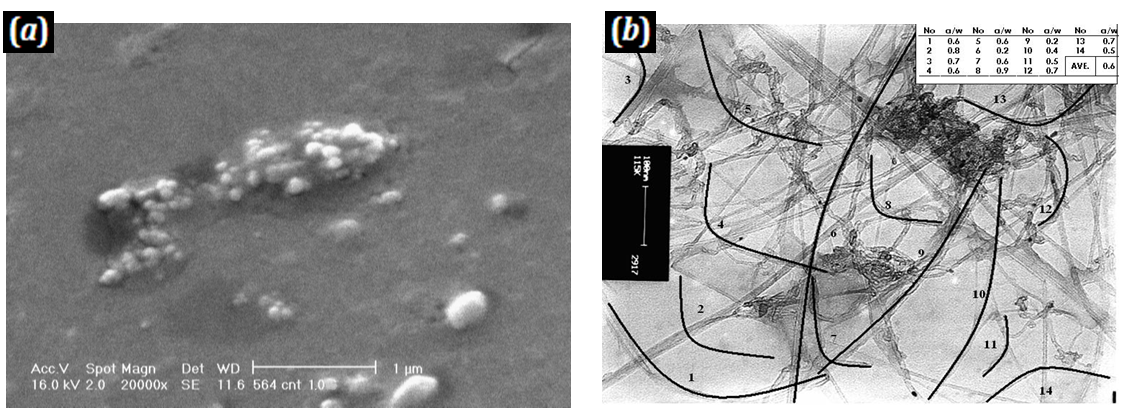 | Figure 9. (a) SEM micrographs of fracture surface of 1.0 wt.% MWCNT/epoxy LY 564 composites; (b) TEM micrograph of MWCNTs after the ultrasonic bath in ethanol for 20 min |
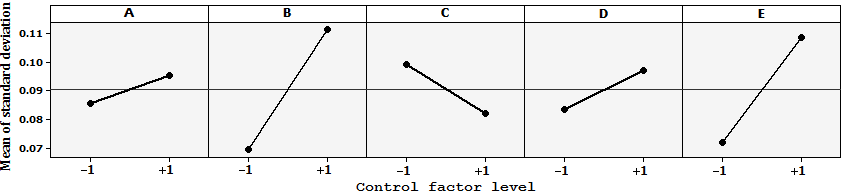 | Figure 10. Average standard deviation graph for different control factor levels |
5. Conclusions
- A DOE methodology was presented to systematically quantify effects of controllable parameters during the fabrication of carbon nanotube (CNT)/epoxy composites, on the material’s elastic modulus. As a case study, two types of polymer matrix (LY 5052 and LY 564), two types of CNTs (SWCNTs and MWCNTs), two CNT states (pristine and functionalized), and four wt.% of CNTs were considered as the main (controllable) factors. Tensile tests were performed to obtain the Young’s modulus of the fabricated samples and accordingly a set of ANOVA analyses was conducted in conjunction with the Taguchi method to estimate both the main and interaction effects. The following highlights emerged from the analyses:1. FSWCNT/epoxy-LY5052 composites with only 1.5 wt.% of CNTs had the Young’s modulus of 4.14 GPa, showing 33% improvement over the pure epoxy resin LY5052 with the Young’s modulus of 3.11 GPa. Furthermore, the Young’s modulus of the LY564 epoxy-based composites increased from 3.00 to 4.05 GPa (i.e., a 35% increase) by adding 1.5 wt.% of FSWCNTs. The latter could prove that SWCNTs and functionalized CNTs are superior to MWCNTs and pristine CNTs, respectively, at least in terms of elastic properties of the tested CNT/epoxy composites.2. All control factors, especially the wt.% of CNTs and the CNT type, significantly affected the Young’s modulus of the composites. Among different factor interactions, the highest interaction was between the wt.% of CNTs and the CNT type (<2%), which was deemed negligible compared to the main effects.3. The effect of the wt.% of SWCNTs on the growth rate of the Young’s modulus was smaller than that of MWCNTs. The functionalization had lower effect for the MWCNTs on the growth rate of the Young’s modulus when compared with the SWCNTs. The effect of wt.% of CNTs on the LY5052–HY5052 was smaller than that of LY564–HY560.4. The variability of response (i.e., the effect of noise factors) was most notable through changing the CNT type, and least notable through changing the polymer type. Functionalization of the CNT surface decreased the effect of noise factors on the Young’s modulus of the CNT/epoxy composites.It was also shown how the presented DOE approach can be used to select the optimal set of factors that maximizes the material’s Young’s modulus. Future work may include the inclusion of other fabrication parameters; such as the effects of curing process, higher reinforcement volume fractions (see, e.g.,[35]), different CNT aspect ratios, or different levels of functionalization on the properties of CNT/epoxy composites.
ACKNOWLEDGMENTS
- Financial support from the Natural Sciences and Engineering Research Council (NSERC) of Canada is greatly acknowledged.
Notes
- Simply defining, an interaction between two parameters means the positive or negative effect of one parameter on the response (in the present case, the Young’s modulus of nancomposite) will depend on the level/value of the other parameter, and hence, they should be considered at the same time for controlling the response.