International Journal of Biophysics

p-ISSN: 2168-4979    e-ISSN: 2168-4987

2013;  3(1A): 9-17

doi:10.5923/s.biophysics.201311.02

Introduction of FRET Application to Biological Single-molecule Experiments

Kenji Okamoto

Cellular Informatics Laboratory, RIKEN, Wako, Saitama, 351-0198, Japan

Correspondence to: Kenji Okamoto, Cellular Informatics Laboratory, RIKEN, Wako, Saitama, 351-0198, Japan.

Email:

Copyright © 2012 Scientific & Academic Publishing. All Rights Reserved.

Abstract

Since the fluorescence resonance energy transfer (FRET) measurement is based on the fluorescence measurement technology, the signal can be obtained from single molecules. The single-molecule FRET (smFRET) measurement has already been extensively used in the field of biology. The combination of the single-molecule sensitivity, the nanometer-scale spatial resolution and the realtimeness gives us the exclusive information on the structure and the dynamics of biomolecules, such as coexisting multiple conformational states or temporal evolution of conformational changes. As an introductory review of the smFRET measurement, this article briefly explains the theory, the basic apparatus, the typical data analysis methods and some examples of experiments applied to biomolecules.

Keywords: FRET, Single-molecule Measurement, Molecular Structure, Conformational Dynamics

Cite this paper: Kenji Okamoto, Introduction of FRET Application to Biological Single-molecule Experiments, International Journal of Biophysics , Vol. 3 No. 1A, 2013, pp. 9-17. doi: 10.5923/s.biophysics.201311.02.

1. Introduction

The fluorescence resonance energy transfer (FRET) has been extensively used in biological experiments. According to its nature that the distance between two fluorophores can be detected as the ratio of fluorescence intensities, it is sometimes referred to as a “spectroscopic ruler”[1] and is often used to examine the molecular structure. Since the FRET measurement is typically most sensitive at the distance of several nanometers, which is comparable to the dimension of biomolecules or their structural dynamics, its application to biological molecules seems to be inevitable. In addition, since the FRET measurement is based on the fluorescence measurement technology, it can be carried out with the single molecule sensitivity.
FRET was experimentally applied to biological molecules after a while from its formulation by Förster[2]. The dependence on the distance[3] and the relative orientation[4] between fluorophores was shown to be consistent with the Förster’s theory. On the other hand, advances in fluorescence microscopy enabled the single- molecule measurement, so-called the single-molecule detection (SMD) or the single-molecule spectroscopy (SMS), in 1990s. Single fluorescent molecules on the glass surface were successfully imaged by using the scanning near-field optical microscopy (SNOM)[5-7], the confocal microscopy[8,9] and the total internal reflection fluorescence (TIRF) microscopy[10-13]. SMD of diffusing fluorophore molecules were also demonstrated[14, 15]. In 1996, Ha et al. first succeeded the single-molecule FRET (smFRET) measurement of biological molecules by acquiring the fluorescence spectrum using SNOM[16]. Successively, other smFRET experiments, such as the conformational dynamics of proteins in catalytic reactions [17], the ligand-induced conformational change[18] and the protein folding[19], were reported, which indicated the ability of the smFRET measurement to directly observe the dynamics of individual molecules. smFRET measurements of diffusing molecules, which are free from influence by the glass surface, were also demonstrated, suggesting the possibility of detection and analysis of subpopulations [20-23]. In 2000, the smFRET measurement on a live cell was also realized[24]. Then application of smFRET has been extended into the wide range of research on the biomolecular structure and dynamics. A handful of examples will be introduced in the later section.
The smFRET measurement enables us to examine individual molecules one by one while the bulk measurement gives only the average. While the bulk measurement cannot distinguish whether only molecules with the middle FRET exist or it consists of the high and the low FRET species, the smFRET measurement tells which is the case. If the FRET distribution is composed of subpopulations, smFRET measurement can resolve them. If the molecular conformation temporally changes, the smFRET measurement traces the dynamics of individual molecules, which is in many cases thermodynamically stochastic and then asynchronous among molecules. At the present time, smFRET is almost the only way to realize such measurement.
In the relatively short history of smFRET, which is less than twenty years, superb reviews[25-27] have been already written. They must be helpful for readers to understand the details of smFRET and to build their own instrument. Here this article would be an introductory review of smFRET to summarize basic topics.

2. Theory for smFRET

When two kinds of fluorophores exist in close proximity to each other and one of them (donor) is in the excited state, the energy can be transferred to the other (acceptor) via nonradiative dipole-dipole interaction without photon emission. That phenomenon is called the FRET. FRET occurs only when the emission spectrum of the donor and the absorption spectrum of the acceptor overlap. The efficiency of energy transfer EFRET was formulated by Förster as[2, 28]
(1)
with the donor-acceptor distance r and the Förster distance R0, which is given as
(2)
where QD is the quantum yield of the donor in the absence of the acceptor, n is the refractive index of the medium, N is Avogadro’s number. The term 
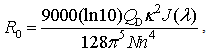
is the orientation factor, which reflects the relative orientation in space of fluorophores and will be mentioned below. represents the overlap integral, which expresses the degree of spectral overlap between the donor emission and the acceptor absorption. R0 represents the distance, at which the transfer efficiency is 0.5 and is typically 5–10 Å for opt-used dye pairs. The term of 6th power seen in (1) indicates the strong dependence of EFRET on r around R0.
EFRET can be calculated as the fraction of the energy transferred to the acceptor in the total energy absorbed by the donor. When fluorescence is detected from a single pair of FRET dyes on two wavelength-separated detector channels, the apparent FRET efficiency Eapp may be approximated with the ratio of detected intensities as
(3)
where IA and ID are the intensities detected on the acceptor and the donor detector channels, respectively[28]. We can discuss relative changes of the FRET efficiency, which corresponds to the donor-acceptor distance, based on this Eapp. However, the measured Eapp is not generally identical to what is defined by (1,2) due to various factors including experimental limitations. The further compensation is usually required to obtain the true EFRET, which corresponds to (1,2). However, in the bulk measurements, which measures the average FRET efficiency, there are additional factors, which causes difficulty obtaining the true EFRET, such as the coexistence of subpopulations with different FRET efficiencies, including ones with photobleached dyes. On the other hand, the smFRET measurement, which distinguishes photobleached species and resolves subpopulations, allows us to determine the FRET efficiency of each species. It is worth the effort to obtain the true EFRET for smFRET.
Practically, there are two major factors to be considered in smFRET experiments to compensate Eapp. First, the energy absorbed by the dye is lost before converting to the signal on the detector due to, for example, the nonradiative energy dissipation, the light loss in the optical paths and the imperfect detection efficiency of detectors. Since the whole efficiency is dependent on the dye species and the fluorescence wavelength, it is different between the donor and the acceptor. Second, when fluorescence is divided by, for example, a dichroic filter onto two detection channels, a fraction of donor fluorescence is leaked onto the acceptor detector. Considering these factors, the true FRET efficiency EFRET can be obtained as
(4)
where 
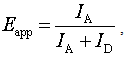
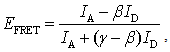
is the coefficient to correct the first factor, the ratio of the detection efficiency between dyes and is for compensation of the second factor, the fluorescence leakage[22,29,30]. be determined experimentally. If the detected wavelength is restricted by, for example, a band pass filter before the acceptor detector, can be assumed at the expense of a portion of photons.
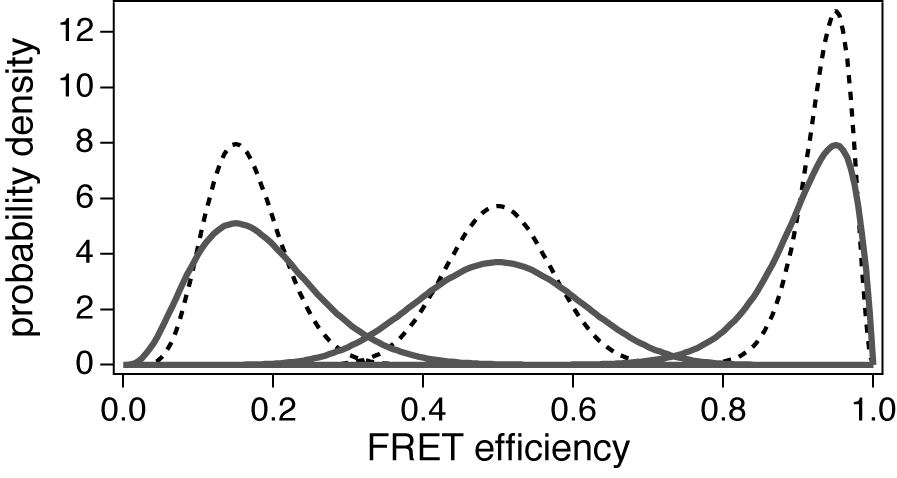
Figure 1. The theoretical distribution of the FRET efficiency. Solid lines are peaks with I = 20 and E = 0.15, 0.5 and 0.95, respectively. I = 50 for dashed lines
Once the FRET efficiencies are calculated for single molecules, they are often gathered to evaluate their distribution. Even if the interdye distance does not change and the excitation light intensity is constant, the measured FRET efficiency has some uncertainty. Because of the weakness of the signal from a single molecule and stochasticity of the photon emission, the detected photon count obeys the Poisson distribution. Uncertainty due to this stochasticity, which is called the ‘shot noise,’ is contained in both the donor and the acceptor fluorescence signals and unavoidable in principle. The distribution of EFRET of the molecules with a certain FRET efficiency forms a peak with some width (Figure 1). It was theoretically shown that the shape of the peak is represented as a Beta distribution with the standard deviation of , where E = and are the mean FRET efficiency and the intensity, respectively, with the average of detected photon counts for the acceptor and the donor 
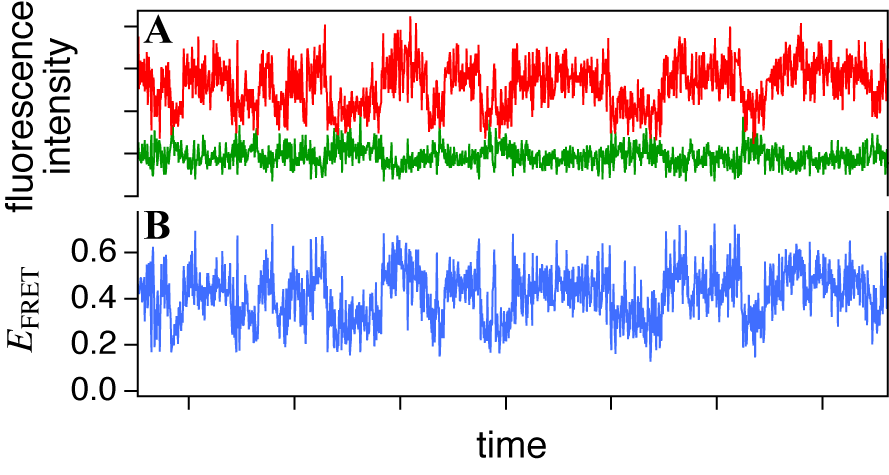
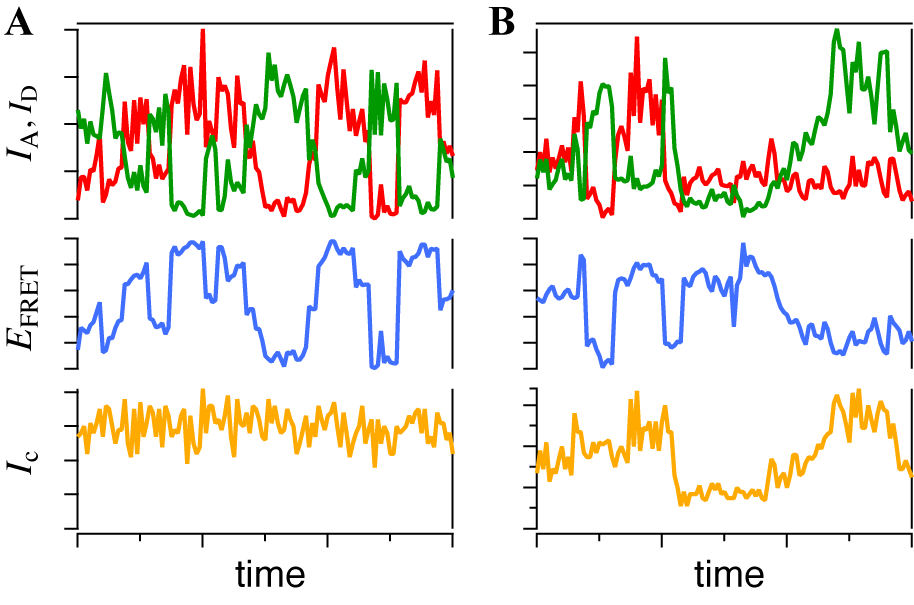
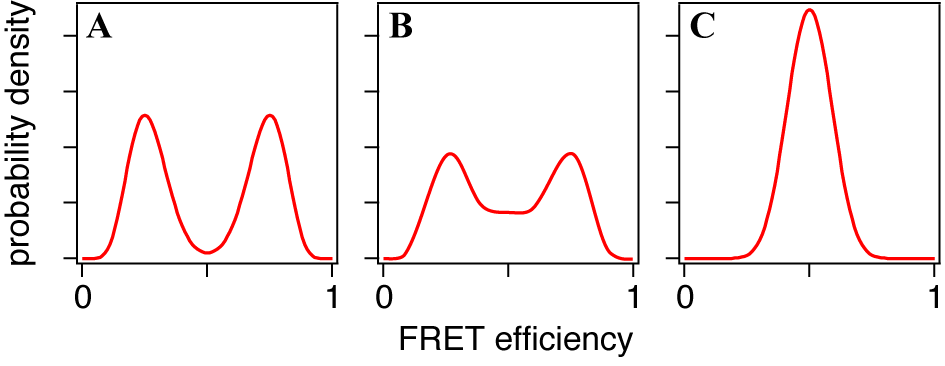
respectively[22]. It suggests that larger I gives a sharper peak and if I is same, the peak becomes sharper near the boundary (E = 0, 1) compared to at the center (E = 0.5). It should be kept in mind that if the compensation of (4) is applied, the Beta distribution describes the distribution before compensation.
One of the advantages of smFRET measurement is the ability to trace the time evolution of the FRET changes in realtime like shown in Figures 2. If the FRET efficiency varies with changes in the interdye distance, the acceptor intensity increases while the donor intensity decrease, or vice versa (Figure 2A). However, the fluorescence intensity can be modulated by other reasons than FRET, such as photochemical effects like blinking or photobleach, which are explicitly observed in the single-molecule measurements. When such fluctuations occur, the anti-correlation relationship of the fluorescence intensities is diminished (Figure 2B). In order to distinguish the intensity modulation due to the FRET changes from those instabilities, calculating the cross correlation between two intensity signals was proposed to quantitatively evaluate the anti-correlation relationship[31]. Or more simply, the compensated total intensity Ic can be calculated as[30]
(5)
which is kept constant with the stochastic fluctuation while only the FRET change causes the intensity modulations (Figure 2A) and varies beyond the noise-level if it contains the fluorescence instability caused by other reasons (Figure 2B).
Figure 2. Examples of FRET time series (simulation). The fluorescence intensities of the donor (green) and the acceptor (red), respectively. The calculated FRET efficiency EFRET (blue). The compensated intensity Ic (orange). (A)Fluorescence intensities change only due to the FRET changes. (B)Intensities also change, for example, by instability of dyes
Once the FRET value EFRET is obtained either from the histogram or from the time series, the absolute distance can be evaluated by (1). While this FRET-distance relationship is well known, practical application is not straightforward. For example, R0 includes the orientation factor 
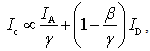
which depends on the relative orientation of two dyes while it is generally difficult to know the actual molecular orientation in real experiments. However, when dyes are labeled via linkers, may be approximated to 2/3, which is the theoretical average under the assumption of random orientation. If one can obtain EFRET values for three different FRET states, the relative distance change can be absolutely calculated.
The FRET efficiency can be measured from the fluorescence lifetime, too. The fluorescence lifetime is the time lag between the absorption of the excitation light and the fluorescence photon emission on a fluorophore. In order to measure the fluorescence lifetime, which is typically in the order of nanoseconds, a pulsed laser is used for excitation and the decay constant for an exponential distribution of the lag times is calculated from a bunch of photon detection. Then the FRET efficiency can be obtained as
(6)
where are the fluorescence lifetime of the donor dye with and without FRET, respectively[28].

3. smFRET Methods

Experimental conditions necessary for the single-molecule experiments are similar to what is required to look at the stars in the sky. First, the background light must be very dark like the night sky. It is essential to achieve a sufficiently high signal-to-noise ratio because each light spot is not very bright. In experiments, care must be taken to keep solvent pure and glass substrates clean. Second, the light spots must be sparsely distributed in order to discriminate each, not like the Milky Way. smFRET samples must be sufficiently diluted so that only a single molecule exists in the spatially resolved detection volume of the microscope. In addition, the optics must be carefully designed to effectively collect fluorescence photons and the detectors must be equipped with the single-molecule sensitivity. Typical detectors used in smFRET experiments are highly sensitive cameras, e.g. EM-CCD and sCMOS, and the single photon counting (SPC) detectors, e.g. a photomultiplier tube (PMT) and an avalanche photodiode (APD). Fluorescence is divided by wavelength, for example, by a dichroic filter, onto two detection channels or its spectrum can be measured by a spectrometer.
There are two types of apparatus, which are practically employed for smFRET measurements. They are briefly introduced in the following.

3.1. Solution-phase smFRET

The dilute solution is a simple way to satisfy experimental requirement of the sparse distribution mentioned above. The focus of a microscope is fixed in a solution (Figure 3A) and then only molecules crossing the focal volume are excited and emit photons. A confocal microscope equipped with SPC detectors is suitable for this type of experiment. Typical time traces of the solution-phase smFRET consist of the low background signal and intermittent fluorescence bursts as shown in Figure 4A. At sufficiently low concentrations, each burst can be regarded as a single molecule. Then the FRET histogram can be constructed by counting photons from each burst (Figure 4B).
Figure 3. Two types of typical configuration for smFRET measurement. (A) Solution-phase smFRET using confocal microscopy, which detects diffusing molecules. Surface-immobilized smFRET can be conducted on (B) the objective-type or (C) the prism-type total internal reflection fluorescence (TIRF) microscopy
Figure 4. An example of solution-phase smFRET result obtained from the mixture of two kinds of dsDNAs. (A) Time series of the fluorescence intensities consist of intermittent bursts. (B) The reconstructed FRET histogram typically contains a distribution at E=0. (C) The same data is plotted as the cumulative distribution function (CDF). Dashed lines represent three Gaussian functions and error functions obtained by fitting to the histogram and the CDF-plot, respectively
There are some points we should take care of when we read the histogram obtained by the solution-phase smFRET measurement. First, for biomolecules in aqueous solution, the residence time in the detection volume is typically a few milliseconds or less. Since this relatively short detection time limits the number of detected photons, the FRET distribution obtained by the solution-phase measurement tends to be relatively broad. Second, if the molecule is equilibrated among some conformational states, the shape of the histogram depends on that transition rate. If the transition rate is very slow compared with the residence time of the molecule in the detection volume, the reconstructed histogram represents a snapshot of coexisting subpopulations (Figure 5A). On the contrary, if the state transition dynamics is very fast, the histogram seems to consist of a single component with the average FRET efficiency (Figure 5C). For dynamics with the time constant comparable to the residence time, the FRET histogram drastically changes the shape depending on the relationship between them[32-34] (Figure 5B).
Figure 5. The typical FRET distributions of the molecules in equilibrium between two conformational states with (A) slow, (B) intermediate and (C) fast transition rates, respectively

3.2. Surface-immobilized smFRET

One of advantages of smFRET measurement is its ability to trace dynamic changes of the molecular structure. In addition to the confocal microscope, the focus of which is adjusted on the substrate surface, the TIRF microscopy is often used (Figure 3B and 3C) to acquire photons from the single molecules immobilized on the surface of the glass substrate. In TIRF microscopy, the evanescent field of the illumination light is generated by reflection on the glass-solution boundary with the larger incident angle than the critical angle. Two types of TIRF configurations, the objective- (Figure 3B) and the prism-type (Figure 3C), are commonly used for that purpose. Since the penetration depth of the evanescent field is typically ~100nm or less, only the surface-bound molecules can be illuminated while suppressing the background signal from solution. Cameras are available with TIRF apparatus while a confocal microscope with SPC detectors achieves the very high signal-to-noise ratio. Examples of the fluorescence time series and the FRET efficiency calculated from them for an immobilized single molecule are shown in Figures 6. The measurement can run until the dye is photobleached. The lifetime of the dye is typically over seconds while it is dependent on various factors, such as solvent composition. The reductant, such as 
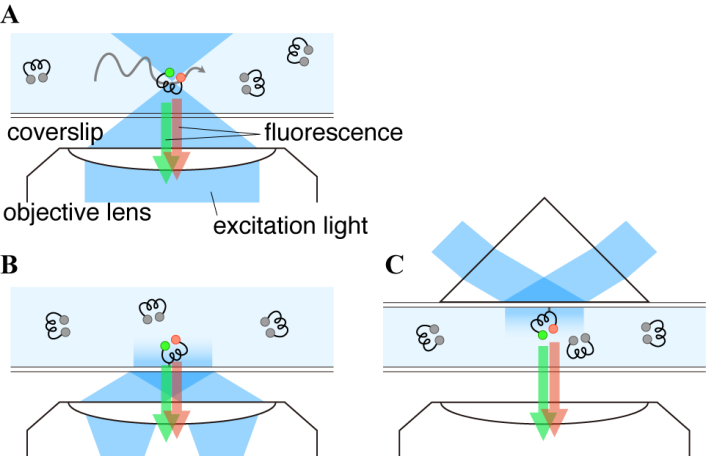
to suppress the fluorescence instability or the oxygen scavenger, such as the combination of glucose, glucose oxidase and catalase, to suppress the photobleach, are often mixed into the solution.
Figure 6. Example of smFRET time series measurement obtained from branch migration dynamics of a Holliday junction DNA. (A) The donor (green) and acceptor (red) fluorescence intensities and (B) the FRET efficiency calculated from them
In order to observe molecular dynamics for a certain period, molecules must be stationary in the detection volume while diffusing molecules in solution are too fast and spend too short residence time in the focal volume. Various surface-immobilization strategies have been developed for that purpose. Basically, specific and strong avidin-biotin coupling interaction is often used. The biotinylated target molecules are bound to biotinylated bovine serum albumin (BSA), which are unspecifically adsorbed on the surface, or to polyethylene glycol (PEG)-coated surface, which contains small amounts of biotinylated PEGs, via streptavidin or NeutrAvidin. These surfaces block unspecific binding to the surface at the same time. The BSA-surface works very well for DNA molecules while the PEG-surface is desirable for adsorptive proteins. It was also proposed to encapsulate the sample molecule in a vesicle[35], which can keep the molecule free from interaction with the surface and dispenses with any modification for immobilization.
smFRET measurements on live cells have been successfully conducted (some examples are introduced in the later section). In those cases, the stationary or slowly diffusing molecules on the plasma membrane were observed. So the situation is similar to the surface-immobilized smFRET measurement.

4. Data Analysis for smFRET

4.1. Preliminary Filtering

Sample preparation for smFRET experiments includes many stochastic processes, such as fluorescence labeling and surface immobilization. It is difficult to prepare sample molecules with 100% accuracy. Some molecules may be singly labeled, which may be due to mislabeling or photobleach of either of dyes, and some may be multiply labeled with the same dye. There may be some molecules influenced from the substrate surface because of imperfect blocking. smFRET measurement explicitly detects such unsuccessful molecules as well as fluorescent impurities. Typically, only a fraction of detected molecules gives the meaningful information. Therefore it is desirable to exclude bad molecules before further detailed analysis, such as time-series analysis described below. In the surface- immobilized experiments, since each molecule can be examined with its intensity, FRET efficiency and their temporal changes, one may be able to specify the obviously bad molecules. On the other hand, in solution-phase experiments, it is difficult to discriminate each burst. Distribution analysis described below may help to distinguish them if they form a subpopulation.

4.2. Distribution Analysis

Once the FRET efficiencies of a bunch of single molecules are measured, their distribution is often summarized as a histogram and devoted to further analyses. When a histogram can be considered to be composed of a few or several components, multiple distribution functions are usually fitted to it. As mentioned in the Section 2, each component can be theoretically represented by a Beta distribution. However, Gaussian functions are practically used to approximate peaks for convenience especially when the signal is not acquired by the SPC detectors because the non-SPC signals are commonly deviated from Poisson statistics. In order to avoid dependence on the binning conditions, a method to fit error functions to the cumulative distribution function without binning was proposed[36] (Figure 4C).
Figure 4B shows an example of the smFRET distribution, which is obtained from the mixture of two kinds of dsDNAs. A peak centered at E ~ 0 is typically seen in the experimental smFRET distribution and corresponds to molecules without the acceptor due to mislabeling or photobleach. However, it may possibly include the molecules with the very open structure, the contributions from which are indistinguishable from those from the donor-only molecules in principle. In order to distinguish them, additional information must be acquired, for example, by direct excitation of the acceptor [37].

4.3. Time-series Analysis

A smFRET time series obtained from an immobilized molecule gives us the time evolution of conformational dynamics. It often shows stepwise changes as shown in Figures 6 and 7, i.e. the time series consists of successive periods, within each of which the signal level is constant, and instantaneous jumps connecting them. Such trajectory is usually explained by the consecutive transitions among the conformational states. The molecule stays in one of conformational states within a flat period and gives the FRET signal corresponding to that state while the transition dynamics itself completes too fast for time resolution of the smFRET measurement. From that point of view, what we have to do is to divide the trajectory into short periods, each of which corresponds to a stay in a state (blue lines in Figures 7). It is straightforward when the FRET change is large and the fluctuation is small (Figure 7A). States can be discriminated by defining thresholds or can be assigned ‘by eye.’ However, it is not always easy because the smFRET signals usually contain stochastic fluctuations and the FRET change may not be large enough (Figure 7B). In such cases, simple thresholding may cause the ‘artifact’ in detection of the state transitions[38].
Figure 7. Examples of the FRET time series. State discrimination by defining thresholds (gray dashed lines) is (A) relatively easy when the FRET change is large and the fluctuation is small, but (B) difficult when the fluctuation is large. Blue lines are the true FRET trajectories to be reproduced
In order to avoid such ‘artifact’ and arbitrariness in judging ‘by eye’ in this state discrimination problem, a number of methods based on statistics and the information theory have been proposed. For example, if the time series can be assumed to be a simple Markov process, the hidden Markov model (HMM) can be used. The HMM assigns one of states to each data point and then gives us the state transition trajectory (STT). The maximum likelihood estimation (MLE)[39,40] or the variational Bayes (VB) inference[30,41] are used to solve the HMM. Assuming the probability distributions of the signal corresponding to the states, the change point detection (CPD) method finds the discontinuity in the signal as the state transition. The CPD on two time-stamped intensity signals using MLE[42] or on the FRET trajectory using Bayesian statistics[43] have been demonstrated. Another method to divide a time trajectory into the local equilibrium states (LES), within which the signal shows the characteristic statistics, such as the mean or the variance, was also proposed[44]. Above methods reconstruct the STT and determine the number of states only from the experimental data without any presumed models.
Once the STT is obtained, the further detailed analysis can be applied. For example, the transition rates can be evaluated from the statistics of the residence time in each state. The relationships between the FRET efficiencies before and after the transitions can be drawn as a transition map[40,45]. If the dynamics is not a simple Markov process and the trajectory includes the complex behaviors, such as the reaction memory, they can be thoroughly examined since the trajectory holds detailed information.

5. smFRET Applications to Biomolecules

smFRET has been extensively applied in the wide range of biological researches. In this section, I would like to introduce only a handful of examples.
Figure 8. Examples of smFRET applications to biomolecules. (A) dsDNA with different interdye distances. (B) Flip-flop motion and (C) branch migration of the Holliday junction DNA. (D) ‘Hand-over-hand’ model for the movement of a molecular motor on a filament. (E) Typical enzymatic reaction. The enzyme waits for a substrate in the open structure (left) and holds and catalyzes the substrate in the closed structure (right). The green and red circles represent the donor and acceptor dyes, respectively
In order to demonstrate the concept of the measurement or to test the instruments, the reference sample is generally used. For smFRET experiments, the double-strand DNA (dsDNA) has been often used as such reference[21,32]. DNA is stable and easy to treat, compared to proteins. The nucleic acid sequence can be freely decided and the fluorescence label can be attached at the arbitrary position. Since the short dsDNA can be regarded as a rigid rod structure, the interdye distance can be controlled by the number of base-pairs separating dyes (Figure 8A). Besides dsDNA, polyproline has been used as a standard, too[32,46].
Nucleic acids are not only rigid structure, but can show dynamical motion. Holliday junction (HJ) is a four-way junction structure composed of four DNA strands. Dynamics of flip-flop motion[47-49] (Figure 8B) and branch migration, which is movement of crossing point along DNA strand [30,50] (Figure 8C), of HJ have been investigated. A ribosome, which is an RNA-protein complex, translates the sequence of an mRNA into the amino acid sequence by the complex sequence, which involves selective binding of tRNAs, sliding movement of the tRNA-bound mRNA strand and release of tRNA, driven by the conformational dynamics of the ribosome. Blanchard et al. investigated the translation process by observing the movement of tRNAs [51,52].
Protein folding is one of most important protein dynamics and has been extensively investigated. smFRET has been also employed to study the folding-unfolding transition dynamics of the two-state[53,54] and the larger multi-domain molecules[45]. The determination of speed of transition dynamics, which is generally much faster than smFRET time resolution, was also attempted by analyzing detection times of single photons[55].
Proteins are sometimes compared to machinery. One of typical molecular machines is the molecular motor. smFRET successfully caught the movement of myosin’s heads[56] and kinesin’s neck linker[57] during ATP-driven motility to validate ‘hand-over-hand’ motion model (Figure 8D). Yasuda et al. revealed the ATP-waiting conformation of a rotary motor F1-ATPase, which could not be predicted from the crystal structure[58]. Dynamic polymorphism of the single actin molecules forming the filament was found by smFRET observation[59].
Enzymatic reactions are commonly thought to be driven by conformational dynamics. In a classical picture, an enzyme is supposed to wait for a substrate in an open structure and catalyze a substrate in a closed structure (Figure 8E), and the reaction proceeds asynchronously among molecules. Hanson et al. observed the catalytic reaction of the adenylate kinase (AK) and obtained the consistent results with the recent bulk measurements, which suggested that AK was in equilibrium between the open and the closed structure regardless of binding of a substrate and only changed the transition rates, and even further details, such as the entire distribution of an ensemble of conformational substates with and without a substrate, from smFRET trajectories[60]. He et al. found coherence in conformational dynamics of single HPPK enzyme molecules [61]. Berezhna et al. investigated the roles that the conformational dynamics of the DNA polymerase plays in DNA replication[62].
In contrast to X-ray crystallography or NMR, which are standard techniques to determine the structure of biomolecules, smFRET measurement does not require the molecule to take the high-order structure. Therefore it is applicable to evaluate the structure of floppy molecules like the intrinsically disordered proteins (IDPs). Since IDP is thought to be similar to random chain and its structural fluctuation is much faster than the time resolution of the smFRET measurement, the detected FRET efficiency should reflect the average of the fluctuating structure. Müller-Späth et al. compared the dimension of a globular protein and IDPs and their dependence on the denaturant concentration and found that the repulsive interaction between charged amino acids dominated the dimension of IDPs[63].
The smFRET measurement has been conducted not only in solution or reconstructed environment in vitro, but also on live cells. Sako et al. prepared the donor- and the acceptor-labeled epidermal growth factor (EGF) and observed FRET upon binding to the EGF receptor (EGFR) on the plasma membrane of a live cell[24]. Occurrence of FRET evidenced the existence of multiple EGFRs in close proximity, i.e. dimerization of EGFRs. Observation of binding kinetics using intermolecular FRET[64,65] as well as the conformational dynamics using intramolecular FRET [66,67] have been also carried out on live-cell membranes.

6. Conclusions

The fundamental techniques for the smFRET measurement, including instrumentation, sample preparation and data analysis, have been developed and the practical knowledge has been accumulated in the last two decades. smFRET has been extensively used to investigate biological phenomena, especially dynamic reactions and provided new findings. smFRET has become one of the indispensable tools in life science. On the other hand, it should be kept in mind that, of course, the smFRET measurement is not perfect. It gives structural information only indirectly via the one-dimensional interdye distance. For example, X-ray diffraction crystallography and NMR, which have three-dimensional atomic resolution, are superior in the spatial resolution. Nevertheless, it is an exclusive advantage to possess the single-molecule sensitivity, the nanometer-spatial resolution and the realtimeness, simultaneously. There is certainly the area only smFRET can reach. The smFRET technique will continue to play an important role in biology.

References

[1]  Selvin, P. R., 2000, The renaissance of fluorescence resonance energy transfer., Nat. Struct. Biol., 7(9), 730–734.
[2]  Förster, V. T., 1946, Energiewanderung und Fluoreszenz., Die Naturwissenschaften, 33(6), 166–175.
[3]  Stryer, L., and Haugland, R. P., 1967, Energy transfer: A spectroscopic ruler., Proc. Natl. Acad. Sci. USA, 58(2), 719–726.
[4]  Haas, E., Katchalski-Katzir, E., Steinberg, I. Z., 1978, Effect of the orientation of donor and acceptor on the probability of energy transfer involving electronic transitions of mixed polarization., Biochemistry, 17(23),5064–5070.
[5]  Trautman, J. K., Macklin, J. J., Brus, L. E., Betzig, E., 1994, Near-field spectroscopy of single molecules at room temperature., Nature, 369, 40–42.
[6]  Xie, X. S., and Dunn, R. C., 1994, Probing single molecule dynamics., Science, 265, 361–364.
[7]  Ambrose, W. P., Goodwin, P. M., Martin, J. C., Keller, R. A., 1994, Single molecule detection and photochemistry on a surface using near-field optical excitation., Phys. Rev. Lett., 72(1), 160–163.
[8]  Macklin, J. J., Trautman, J. K., Harris, T. D., Brus, L. E., 1996, Imaging and time-resolved spectroscopy of single molecules at an interface., Science, 272, 255–258.
[9]  Trautman, J. K., and Macklin, J. J., 1996, Time-resolved spectroscopy of single molecules using near-field and far-field optics., Chem. Phys., 205(1-2), 221–229.
[10]  Funatsu, T., Harada, Y., Tokunaga, M., Saito, K., Yanagida, T., 1995, Imaging of single fluorescent molecules and individual ATP turnovers by single myosin molecules in aqueous solution., Nature, 374, 555–559.
[11]  Sase, I., Miyata, H., Corrie, J. E. T., Craik, J. S., Kinosita, Jr., K., 1995, Real time imaging of single fluorophores on moving actin with an epifluorescence microscope., Biophys. J., 69(2), 212–218.
[12]  Schmidt, T., Schuetz, G. J., Baumgartner, W., Gruber, H. J., Schindler, H., 1995, Characterization of photophysics and mobility of single molecules in a fluid lipid membrane., J. Phys. Chem., 99(49), 17662–17668.
[13]  Dickson, R. M., Norris, D. J., Tzeng, Y.-L., Moerner, W. E., 1996, Three-dimensional imaging of single molecules solvated in pores of poly(acrylamide) gels., Science, 274, 966–968.
[14]  Nie, S., Chiu, D. T., Zare, R. N., 1994, Probing individual molecules with confocal fluorescence microscopy., Science, 266, 1018–1021.
[15]  Keller, R. A., Ambrose, W. P., Goodwin, P. M., Jett, J. H., Martin, J. C., Wu, M., 1996, Single-molecule fluorescence analysis in solution., Appl. Spectrosc., 50(7), 12A–32A.
[16]  Ha, T., Enderle, T., Ogletree, D. F., Chemla, D. S., Selvin, P. R., Weiss, S., 1996, Probing the interaction between two single molecules: Fluorescence resonance energy transfer between a single donor and a single acceptor., Proc. Natl. Acad. Sci. USA, 93(3), 6264–6268.
[17]  Ha, T., Ting, A. Y., Liang, J., Caldwell, W. B., Deniz, A. A., Chemla, D. S., Schultz, P. G., Weiss, S., 1999, Single-molecule fluorescence spectroscopy of enzyme conformational dynamics and cleavage mechanism., Proc. Natl. Acad. Sci. USA, 96(3), 893–898.
[18]  Ha, T., Zhuang, X., Kim, H. D., Orr, J. W., Williamson, J. R., Chu, S., 1999, Ligand-induced conformational changes observed in single RNA molecules., Proc. Natl. Acad. Sci. USA, 96(16), 9077–9082.
[19]  Jia, Y., Talaga, D. S., Lau, W. L., Lu, H. S. M., DeGrado, W. F., Hochstrasser, R. M., 1999, Folding dynamics of single GCN-4 peptides by fluorescence resonant energy transfer confocal microscopy., Chem. Phys., 247, 69–83.
[20]  Fries, J. R., Brand, L., Eggeling, C., Köllner, M., Seidel, C. A. M., 1998, Quantitative identification of different single molecules by selective time-resolved confocal fluorescence spectroscopy., J. Phys. Chem. A, 102(33), 6601–6613.
[21]  Deniz, A. A., Dahan, M., Grunwell, J. R., Ha, T., Faulhaber, A. E., Chemla, D. S., Weiss, S., 1999, Single-pair fluorescence resonance energy transfer on freely diffusing molecules: Observation of Förster distance dependence and subpopulations., Proc. Natl. Acad. Sci. USA, 96(7), 3670–3675.
[22]  Dahan, M., Deniz, A. A., Ha, T., Chemla, D. S., Schultz, P. G., Weiss, S., 1999, Ratiometric measurement and identification of single diffusing molecules., Chem. Phys., 247(1), 85–106.
[23]  Deniz, A. A., Laurence, T. A., Beligere, G. S., Dahan, M., Martin, A. B., Chemla, D. S., Dawson, P. E., Schultz, P. G., Weiss, S., 2000, Single-molecule protein folding: Diffusion fluorescence resonance energy transfer studies of the denaturation of chymotrypsin inhibitor 2., Proc. Natl. Acad. Sci. USA, 97(10), 5179–5184.
[24]  Sako, Y., Minoguchi, S., Yanagida, T., 2000, Single- molecule imaging of EGFR signalling on the surface of living cells., Nat. Cell Biol., 2(3), 168–172.
[25]  Weiss, S, 1999, Fluorescence spectroscopy of single biomolecules., Science, 283, 1676–1683.
[26]  Ha, T, 2001, Single-molecule fluorescence resonance energy transfer., Methods, 25(1), 78–86.
[27]  Roy, R., Hohng, S., Ha, T., 2008, A practical guide to single-molecule FRET., Nat. Methods, 5(6), 507–516.
[28]  J. R. Lakowicz, Principles of Fluorescence Spectroscopy, 3rd ed., New York, USA: Springer, 2006.
[29]  McCann, J. J., Choi, U. B., Zheng, L., Weninger, K., Bowen, M. E., 2010, Optimizing methods to recover absolute FRET efficiency from immobilized single molecules., Biophys. J., 99(3), 961–970.
[30]  Okamoto, K. and Sako, Y., 2012, Variational Bayes analysis of a photon-based hidden Markov model for single-molecule FRET trajectories., Biophys. J., 103(6), 1315–1324.
[31]  Hanson, J. A. and Yang, H., 2008, Quantitative evaluation of cross correlation between two finite-length time series with applications to single-molecule FRET., J. Phys. Chem. B, 112(44), 13962–13970.
[32]  Schuler, B., Lipman, E. A., Eaton, W. A., 2002, Probing the free-energy surface for protein folding with single-molecule fluorescence spectroscopy., Nature, 419, 743–748.
[33]  Gopich, I. V., and Szabo, A., 2003, Single-macromolecule fluorescence resonance energy transfer and free-energy profiles., J. Phys. Chem. B, 107(21), 5058–5063.
[34]  Gopich, I. V., and Szabo, A., 2007, Single-molecule FRET with diffusion and conformational dynamics., J. Phys. Chem. B, 111(44), 12925–12932.
[35]  Boukobza, E., Sonnenfeld, A., Haran, G., 2001, Immobilization in surface-tethered lipid vesicles as a new tool for single biomolecule spectroscopy., J. Phys. Chem. B, 105(48), 12165–12170.
[36]  Okamoto, K., and Terazima, M., 2008, Distribution analysis for single molecule FRET measurement., J. Phys. Chem. B, 112(24), 7308–7314.
[37]  Kapanidis, A. N., Lee, N. K., Laurence, T. A., Doose, S., Margeat, E., Weiss, S., 2004, Fluorescence-aided molecule sorting: Analysis of structure and interactions by alternating-laser excitation of single molecules., Proc. Natl. Acad. Sci. USA, 101(24), 8936–8941.
[38]  Terentyeva, T. G., Engelkamp, H., Rowan, A. E., Komatsuzaki, T., Hofkens, J., Li, C.-B., Blank, K., 2012, Dynamic disorder in single-enzyme experiments: Facts and artifacts., ACS Nano, 6(1), 346–354.
[39]  Liu, Y., Park, J., Dahmen, K. A., Chemla, Y. R., Ha, T., 2010, A comparative study of multivariate and univariate hidden Markov modelings in time-binned single-molecule FRET data analysis., J. Phys. Chem. B, 114(16), 5386–5403.
[40]  McKinney, S. A., Joo, C., Ha, T., 2006, Analysis of single-molecule FRET trajectories using hidden Markov modeling., Biophys. J., 91(5), 1941–1951.
[41]  Bronson, J. E., Fei, J., Hofman, J. M., Gonzalez Jr., R. L., Wiggins, C. H., 2009, Learning rates and states from biophysical time series: A Bayesian approach to model selection and single-molecule FRET data., Biophys. J., 97(12), 3196–3205.
[42]  Xu, C. S., Kim, H., Hayden, C. C., Yang, H., 2008, Joint statistical analysis of multichannel time series from single quantum dot-(Cy5)n constructs., J. Phys. Chem. B, 112(19), 5917–5923.
[43]  Ensign, D. L., and Pande, V. S., 2010, Bayesian detection of intensity changes in single molecule and molecular dynamics trajectories., J. Phys. Chem. B, 114(1), 280–292.
[44]  Baba, A., and Komatsuzaki, T., 2007, Construction of effective free energy landscape from single-molecule time series., Proc. Natl. Proc. Sci. USA, 104(49), 19297–19302.
[45]  Pirchi, M., Ziv, G., Riven, I., Cohen, S. S., Zohar, N., Barak, Y., Haran, G., 2011, Single-molecule fluorescence spectroscopy maps the folding landscape of a large protein., Nat. Commun., 2, 493.
[46]  Schuler, B., Lipman, E. A., Steinbach, P. J., Kumke, M., Eaton, W. A., 2005, Polyproline and the “spectroscopic ruler” revisited with single-molecule fluorescence., Proc. Natl. Acad. Sci. USA, 102(8), 2754–2759.
[47]  McKinney, S. A., Déclais, A.-C., Lilley, D. M. J., Ha, T., 2003, Structural dynamics of individual Holliday junctions., Nat. Struct. Biol., 10(2), 93–97.
[48]  Hohng, S., Joo, C., Ha, T., 2004, Single-molecule three-color FRET., Biophys. J., 87(2), 1328–1337.
[49]  Sarkar, S. K., Andoy, N. M., Benítez, J. J., Chen, P. R., Kong, J. S., Chen, C. H., 2007, Engineered Holliday junctions as single-molecule reporters for protein-DNA interactions with application to a MerR-family regulator., J. Am. Chem. Soc., 129(41), 12461–12467.
[50]  Karymov, M. A., Chinnaraj, M., Bogdanov, A., Srinivasan, A. R., Zheng, G., Olson, W. K., Lyubchenko, Y. L., 2008, Structure, dynamics, and branch migration of a DNA Holliday junction: A single-molecule fluorescence and modeling study., Biophys. J., 95(9), 4372–4383.
[51]  Blanchard, S. C., Gonzalez Jr., R. L., Kim, H. D., Chu, S., Puglisi, J. D., 2004, tRNA selection and kinetic proofreading in translation., Nat. Struct. Mol. Biol., 11(10), 1008–1014.
[52]  Blanchard, S. C., Kim, H. D., Gonzalez Jr., R. L., Puglisi, J. D., Chu, S., 2004, tRNA dynamics on the ribosome during translation., Proc. Natl. Acad. Sci. USA, 101(35), 12893–12898.
[53]  Rhoades, E., Cohen, M., Schuler, B., Haran, G., 2004, Two-state folding observed in individual protein molecules., J. Am. Chem. Soc., 126(45), 14686–14687.
[54]  Merchant, K. A., Best, R. B., Louis, J. M., Gopich, I. V., Eaton, W. A., 2007, Characterizing the unfolded states of proteins using single-molecule FRET spectroscopy and molecular simulations., Proc. Natl. Acad. Sci. USA, 104(5), 1528–1533.
[55]  Chung, H. S., Louis, J. M., Eaton, W. A., 2009, Experimental determination of upper bound for transition path times in protein folding from single-molecule photon-by-photon trajectories., Proc. Natl. Acad. Sci. USA, 106(29), 11837–11844.
[56]  Warshaw, D. M., Kennedy, G. G., Work, S. S., Krementsova, E. B., Beck, S., Trybus, K. M., 2005, Differential labeling of myosin V heads with quantum dots allows direct visualization of hand-over-hand processivity., Biophys. J., 88(5), L30– L32.
[57]  Tomishige, M., Stuurman, N., Vale, R. D., 2006, Single-molecule observations of neck linker conformational changes in the kinesin motor protein., Nat. Struct. Mol. Biol., 13(10), 887–894.
[58]  Yasuda, R., Masaike, T., Adachi, K., Noji, H., Itoh, H., Kinosita, Jr., K., 2003, The ATP-waiting conformation of rotating F1-ATPase revealed by single-pair fluorescence resonance energy transfer., Proc. Natl. Acad. Sci. USA, 100(16), 9314–9318.
[59]  Kozuka, J., Yokota, H., Arai, Y., Ishii, Y., Yanagida, T., 2006, Dynamic polymorphism of single actin molecules in the actin filament., Nat. Chem. Biol., 2(2), 83–86.
[60]  Hanson, J. A., Duderstadt, K., Watkins, L. P., Bhattacharyya, S., Brokaw, J., Chu, J.-W., Yang, H., 2007, Illuminating the mechanistic roles of enzyme conformational dynamics., Proc. Natl. Acad. Sci. USA, 104(46), 18055–18060.
[61]  He, Y., Li, Y., Mukherjee, S., Wu, Y., Yan, H., Lu, H. P., 2011, Probing single-molecule enzyme active-site conformational state intermittent coherence., J. Am. Chem. Soc., 133(36), 14389–14395.
[62]  Berezhna, S. Y., Gill, J. P., Lamichhane, R., Millar, D. P., 2012, Single-molecule Förster resonance energy transfer reveals an innate fidelity checkpoint in DNA polymerase I., J. Am. Chem. Soc., 134(27), 11261–11268.
[63]  Müller-Späth, S., Soranno, A., Hirschfeld, V., Hofmann, H., Rüegger, S., Reymond, L., Nettels, D., Schuler, B., 2010, Charge interactions can dominate the dimensions of intrinsically disordered proteins., Proc. Natl. Acad. Soc. USA, 107(33), 14609–14614.
[64]  Murakoshi, H., Iino, R., Kobayashi, T., Fujiwara, T., Ohshima, C., Yoshimura, A., Kusumi, A., 2004, Single-molecule imaging analysis of Ras activation in living cells., Proc. Natl. Acad. Sci. USA, 101(19), 7317–7322.
[65]  Huppa, J. B., Axmann, M., Mörtelmaier, M. A., Lillemeier, B. F., Newell, E. W., Brameshuber, M., Klein, L. O., Schütz, G. J., Davis, M. M., 2010, TCR–peptide–MHC interactions in situ show accelerated kinetics and increased affinity., Nature, 9, 963–967.
[66]  Hibino, K., Shibata, T., Yanagida, T., Sako, Y., 2009, A RasGTP-induced conformational change in C-RAF is essential for accurate molecular recognition., Biophys. J., 97(5), 1277–1287.
[67]  Sakon, J. J., and Weninger, K. R., 2010, Detecting the conformation of individual proteins in live cells., Nat. Methods, 7(3), 203–205.