Inah Sylvester A., Yaro Margaret A., Agbor Emmanuel A., Ukene Daniel
Department of Urban and Regional Planning, Cross River University of Technology, P.M.B 1123, Calabar, Nigeria
Correspondence to: Yaro Margaret A., Department of Urban and Regional Planning, Cross River University of Technology, P.M.B 1123, Calabar, Nigeria.
| Email: |  |
Copyright © 2014 Scientific & Academic Publishing. All Rights Reserved.
Abstract
In Nigerian urban areas, policy initiators of residential housing are of the opinion that any housing meets the satisfaction needs of the urban poor without due regards to environmental quality variables of the surroundings. This undoubtedly have influence on the various types of public residential houses developed for the urban poor. However, residential housing satisfaction goes beyond considering the technical quality of the components of the house to include how well the building and its environment have met the needs and expectations of its dwellers. This study undertakes a differential evaluation in residential housing satisfaction of two subgroups within the urban poor. The paper made use of cross-sectional survey of 250 households, drawn from 11 wards cutting across different urban poor socio-economic strata in Calabar metropolis. Findings showed that the urban poor have low level of residential housing satisfaction with variation existing between subgroups. This implies that housing policy formulators in Nigeria need to review the old tenement structures and include normative housing needs (infrastructure and amenities such as the quality satisfaction attributes) of the urban poor that have been overlooked over the years to articulate the overall integrated housing development framework in Nigeria.
Keywords:
Residential housing satisfaction, Urban poor, Slum development, Sustainability, Relative weights, Quality attributes, Calabar metropolis
Cite this paper: Inah Sylvester A., Yaro Margaret A., Agbor Emmanuel A., Ukene Daniel, Residential Housing Satisfaction of the Urban Poor in Calabar Metropolis, Nigeria, Architecture Research, Vol. 4 No. 1A, 2014, pp. 1-8. doi: 10.5923/s.arch.201401.01.
1. Introduction
Urban residential housing delivery in developing countries, particularly in Nigeria has become a subject of public discourse with regards to quality and quantity. It is believed that the bulk of this housing inadequacy is borne by the less privileged in the society [1]. Available facts have it that elites in authority who formulate and implement housing policies were giving wrong impression that any type of housing will do because the urban poor just needs shelter [2].However, the environmental quality requirements of the consumers were not taken into consideration as no conscious effort was made to understand the desires and needs of the urban poor housing consumer. Many scholars concentrated their research preferences within Nigeria. Their studies have been limited in scope and general in outlook [3 - 6]. These studies treat the urban poor as an isolated people and their approach tend to reduce the reliability of their research outcome. Similarly, urban scholars like [7 - 11] have focused their studies on urban housing and neighbourhood environmental quality. Thus, there is an obvious lack of vital data necessary for relating environmental quality with housing satisfaction of low-income consumers. This situation has resulted in the urban poor occupying dilapidated, decrepit and derelict residential houses which translate to slum development, ghettos and urban blight. This paper examines the variables that have relationship with the urban poor housing consumers deriving residential housing satisfaction and attaining sustainable environmental quality in the Calabar metropolis.
2. Literature Review
Generally, housing satisfaction according to Oliveira and Heineck [12] is a concept with assigned prominent indicators used by many researchers and analysts as an evaluation measure of private and public sector building performance; as an indicator of residential mobility and as an evaluation of occupants’ perception of their residential environment and improvements in new projects. Residential housing satisfaction as evaluation criteria is governed by a number of considerations which highlight the point of view of the housing consumers themselves. Residential housing satisfaction in the views of Olatubara and Fatoye [13] is a reflection of the degree to which the occupants of a dwelling unit feel that their housing helps them to achieve their goals. They explained further that it is a measure of the degree to which housing (quality) performance is meeting the occupants expectation in terms of benefit and needs.Nowadays, human elements perceive their areas of habitation as a shield to protect them from daily economic and social life stress. Thus, urban poor residential dwellings should be able to meet the socio economic and physiological needs of their residence. This can be achieved when adequate conception of housing moves beyond mere architectural design considerations to include environmental quality perception of surroundings. [14] report that customer satisfaction is not only a matter related to the hand-out of a new completed building, but is a life-cycle issue which has to be taken into account already in the preconstruction phase.The total dwelling place in which housing occupants live is the sum total of the physical and socio-cultural environment with the propensity to improve the welfare of its dwellers. This environment can maintain commitments, portray positive and responsible image and improve productivity of the dwellers [13]. In order to clearly delineate the conceptual domain of this study, the residential housing satisfaction attribute variable of [2, 13] would be adopted to achieve standard valid measure of satisfaction. Their foci of satisfaction attributes of measurement were divided into six subsystems viz: physical, environmental, functional, behavioral, economic and timing subsystems. The physical subsystem comprises the architectural design and the materials used for the erection of the house. The environmental subsystem is defined as the surrounding geographical space in which the dwelling is located. The functional subsystem gives the utility derived by the occupant in relation to daily life in the house. The behavioral subsystem entails the level of privacy, accessibility of neighborhood conveniences to security and shared facilities. The economic subsystems relate to the minimum cost incurred by house dweller with respect to the means of livelihood and the timing element explains in the institutional arrangement under which the dwelling is being managed.The concept of sustainability as a new planning paradigm has emerged as a theme in environmental economics. It is a term that cannot be used without making reference to sustainable development. Sustainable development in the context of Swilling and Annecke [15] is the development that harmonizes social, economic and ecological objectives links technologies for infrastructure and utility development with a commitment to long term vision of poverty-eradication and local economic development objectives. Sustainability as an adjunct term of sustainable development is explained by Oyalowo [16] to mean an economic development that is intrinsically balanced by integrating environmental protection and social justice. In physical planning, sustainable environmental quality can be achieved from a holistic point of view. This is when an occupant of a dwelling unit derives satisfaction in terms of the totality of the quality of life in a given physical space. The sustainability attributes of measurement of environmental quality can be judged by following: the threshold distance to move to access basic facilities; the availability of such facilities to support daily needs; the heterogeneous activities available to support and enhance common existence, the level of social strata economic mixed living and ecologically safe, healthy, planned and well laid out housing in terms of accessibility to efficient public transport to local food markets, place of work and other commercial and public facilities.In housing literature, the concept of housing encompasses more than shelter to include access to social infrastructure that enhances livability indices in and around individual homes, shops, schools, open spaces, employment to physical infrastructure such as roads, water electricity, security, waste disposal and telecommunication [17]. Hence either in design or occupation of a dwelling unit to achieve optimum satisfaction, the environmental quality should strike a balance with the three cardinal elements that ensure sustainability; balancing ecological and environmental protection, inclusiveness, integration and combination of a diversified social mix and egalitarian provision of economic opportunities for the poor and the rich alike [16].Thus, this paper intends to assess how the urban poor housing consumers consider the satisfaction of their dwelling units in terms of sustainable environmental quality variables.
3. Research Methods
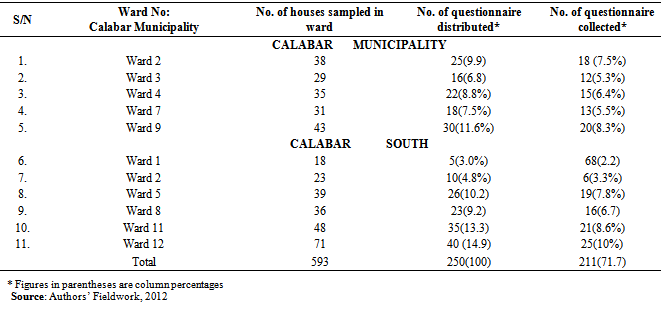
Data collection employed in this study was from primary and secondary sources. Data from primary sources were collected through the use of questionnaires. The questionnaire was designed to collect data on two interacting subsystems of residential housing satisfaction and sustainable environmental quality. The questionnaire comprised two sections; the first section sought to obtain information on behavioral, economic, functional and timing characteristics of housing satisfaction. The second section elicited information on physical and environmental quality attributes. The survey required occupants to scale their satisfaction with each of the 24 basic satisfaction attributes based on a five point likert scale response, using 5 for extremely satisfactory, 4 for very satisfactory, 3 for satisfactory, 2 for unsatisfactory and 1 for very unsatisfactory. The stratified sampling technique was adopted based on the 22 wards in the study area. A total of eleven (11) wards were selected from 22. Five wards were picked from the ten wards in Calabar Municipality and six also picked from the 12 wards that make up Calabar South Local Government Area (Table 1).Table 1. Questionnaires distribution among selected housing units
 |
| |
|
Table 1 also shows that 593 houses form the sample frame with the distribution of 250 questionnaires. The sample size was based on 5% sample, with the use of systematic sampling technique of the number of questionnaires distributed, 211 (71.7%) were properly filled/completed, retrieved and used for analysis. The calculation of the degree of satisfaction indices (DSI) with each of the attributes of satisfaction and the whole of building satisfaction was based on the notion that a dweller’s scores on all the selected attributes considered together were determined indices of degree of satisfaction. The index of degree of satisfaction of a dweller is the sum of the dwellers scores expressed as a percentage of the sum of the dwellers maximum scores possible on all the attributes [2 in 13]. In mathematical symbol, this is represented in equation (1) as follows: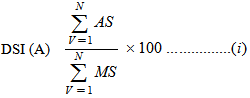 Where DSI = Index of degree of satisfaction of a dwellerA =Attributes or instruments of measurementAs =Actual scores by a dweller on the ‘V’th variable∑ =Summation signMs =Maximum score that variable ‘V’ could have on the scale used i.e. for a five point scale (Ms = 5)N =Total number of variablesThe degree of satisfaction of a dweller in any housing unit is the maximum sum of the dweller’s potential scores on all the attributes of quality satisfactory variables. The outcome shows the distribution of DSI scores showing the level/extent of satisfaction of the housing units through the ratio of dwellers under the degree of satisfaction. The interpretation of the five point scale was done by harmonizing it into two points, zero (0) or one (1) degree of satisfaction. A dweller that scores any attribute between 1 and 3 is coded as zero meaning “not satisfied” while between 4 and 5 is coded as 1 and translated as “satisfied”. The analysis showed the ratio of dwellers under “satisfied” and “not satisfied” regions. An average attribute score (AAS) was calculated for each of the satisfaction for variables and were ranked in order of importance. The analysis of data collected from the field was done with the use of Analysis of Variance (ANOVA) as well as descriptive and inferential statistics with the respondent’s data presented in frequency distributions and percentages.
4. Data Analysis
4.1. Measuring Degree of Satisfaction of Dwellers
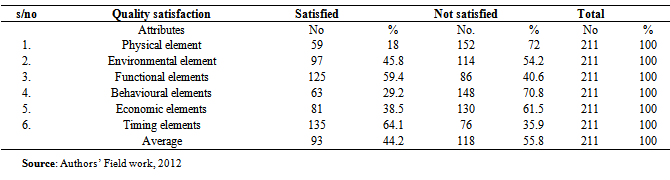
To measure the average degree of satisfaction of dwellers under each category of satisfaction attributes, the 34 selected attributes of satisfaction were sub-classified into six elements of dimension that summarized all the essential information in the 34 independent attributes of housing unit satisfaction. The six elements are shown in Table 2, with the physical elements having the highest percentage of satisfaction of 72%. This is followed by behavioural elements (70.8%), economic elements 62.5%, environmental elements (54.2%), functional elements (40.6%) and timing elements (35.9%).Table 2. Dwellers degree of satisfaction with elements
 |
| |
|
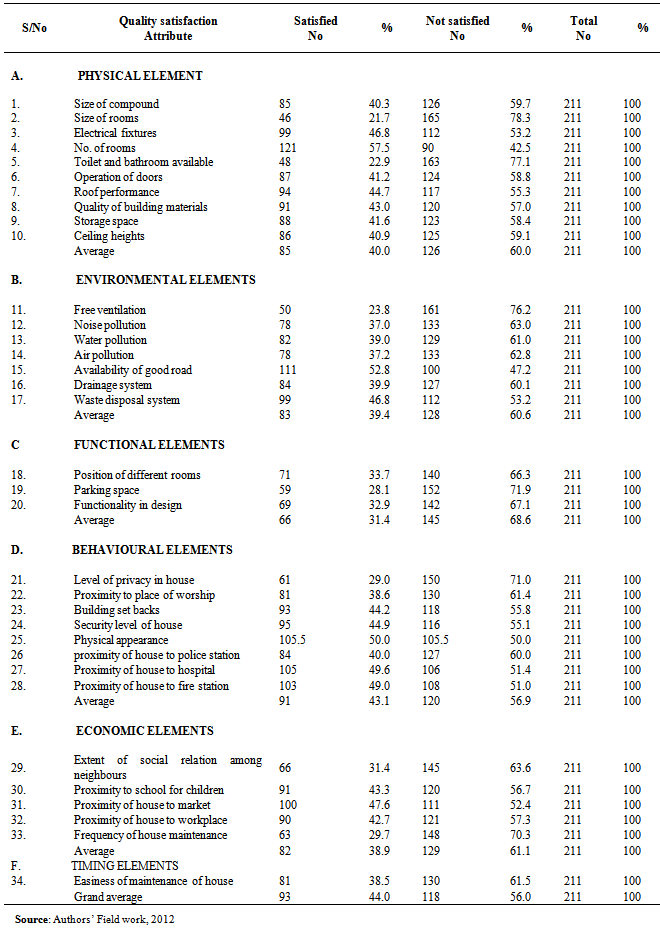
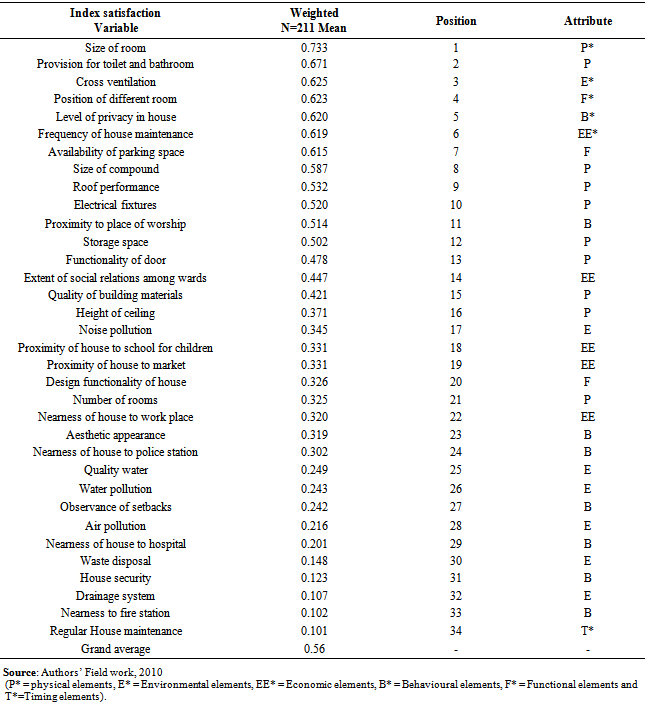
The overall satisfaction/dissatisfaction frequency proportion is 44% and 56 % (that is 22:28).All details of individual elements used for evaluation are presented in Table 3. From this Table, the distribution of the dwellers degree of satisfaction indices of the residential housing units under the instruments of housing satisfaction shows the numbers of respondents who are dissatisfied with each of the satisfaction attribute, starting with the highest. This implies that the attribute having the highest percentage of degree of dissatisfaction index will have the least percentage of degree of satisfaction. Assessing the entire dissatisfaction attributes irrespective of the element of classification, respondents who are dissatisfied with the size of rooms in their dwellings has the highest percentage of 78.3%. This is followed by poor toilets and bathrooms facilities 77.1%, inadequate free ventilation 76.2%, lack of parking space in yard, 71.9%, low level of privacy in house 71.0% and low frequency of maintenance 70.3% etc.Table 3. Elements for measuring dwellers degree of satisfaction
 |
| |
|
4.2. Determination of Relative Index of Satisfaction of Low-Income Earners
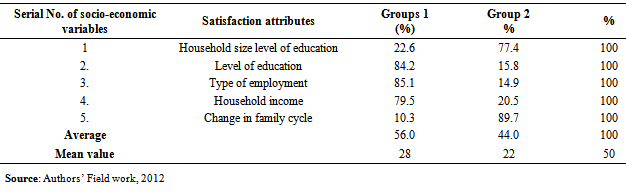
The low income earners in this study were identified through the sub division of the entire study area into two strata groups. Low incomes were selected through the categorization of the respondents into groups reflecting their low income status. The mean low-income index value served as the basis for the categorization. The maximum and minimum mean index values of 56% and 44% (that is 28:22) were obtained. This is shown in Table 4 and is used in defining the low-income earners range.As the identification of all respondents that belong to the urban poor, their respective corresponding satisfaction scores were collated. The process was determined under each of the elements by assessing dwellers whose attributes provide dissatisfaction or satisfaction.Table 4. Low income mean value derivation using socio-economic status
 |
| |
|
The extent of dissatisfaction or satisfaction is the measurement of a relative weight attached to an element by all the dwellers taken together. It is expressed as the sum of all the actual scores on the five point scale given by all the various dwellers as a ratio of the sum of the maximum possible scores on the five points that all the dwellers could give to that element. This is represented in equation 2 as follows: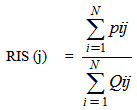 Where ∑ = summation signRIS(j)= relative index of satisfaction for attribute (i)N= Number of respondentsPij= Original score on the five-point relative satisfaction by “i”th respondents on the “j” attribute.Pij= Maximum score that respondents “i” could give to attribute “j” on the relative satisfaction scale.From the above formula the mean item score (MIS) for each attribute is calculated to obtain the RIS as given in equation 3 below:
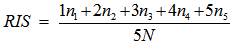 Where n1 = Number of respondents for very unsatisfactory, n2 = unsatisfactory N3 = satisfactory, n4 = very satisfactory, n5= very very satisfactory and N = Total number of respondentsThe numerical information identified were graded to a two point scale of zero and one, where one through three on the five point scale were coded as zero for “not satisfied” and 4 to 5 were coded as 1 for satisfied.Therefore,
 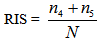 The variables are then graded according to the diminishing order of their relative satisfaction index. The maximum index that a variable could have is 1 but the lowest depends on the study area. Therefore the more RIS approaches 1, the more the contribution of the variable to the satisfaction for the dwellers. To find the weighted mean of the RIS for each of the thirty- four (34) variables of the eleven (11) wards, as in (18 cited in 13), calculation was done by summing-up the products of the RIS for each ward and the proportion of respondents from the corresponding ward as indicated in Table 5. This Table depicts the mean for variables having the same characteristics. From the Table, the variables of size of room, availability of toilets and bathrooms had the indices of 0.733 and 0.671 to show the level of satisfaction attained in the physical elements of a housing unit. This is followed by proper air circulation, position of rooms, level of privacy, number of times housing units are maintained and so on with indices of (0.625, 0.623, 0.620 and 0.619) in the environmental, functional, behavioural and economic elements respectively. However, the highest level of dissatisfaction is indicated by the variables of accessibility to environmental facilities, pollution services and prompt attention paid to house maintenance with indices of 0.101, 0.102, 0.107, 0.148 and 0.216.To gain further understanding of the relative index of satisfaction of the low-income earners, two major groups were obtained from Table 5 using socio-economic characteristics such as large household size, low income tenement and non-tenement housing for group 1 and small household size, high income, tenement and non-tenement for group 2. To identify the highest level of satisfaction a series of ANOVA test for significant difference in housing satisfaction between the two low income group earners were conducted. The result indicates that the F-cal = 4.157>F-tab = 3.920 at P>0.5 was obtained for the group of large and small household size, hence the large household size has an RIS of 0.58 or 58% for the dissatisfied as against 0.42 or 42% satisfaction derived for small household size.
Table 5. Relative index of satisfaction for the eleven wards
 |
| |
|
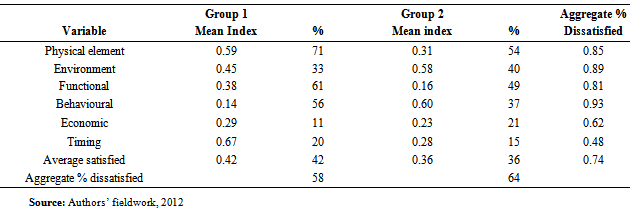
Also, the result for the tenement and non-tenement low income residents group showed that F-cal = 17.311>F-tab = 6.850 at P>.01, thus having an RIS of 0.64 or 64% for the dissatisfied as against 0.36 or 36% non-tenement satisfaction as shown in Table 6. This Table also shows that the low-income socio-economic group with large household- size, tenement recorded the lowest satisfaction score of 11%, while high score of satisfaction of 71% for the non-tenement was obtained in physical elements.Table 6. Aggregate percentage indices of the two urban poor subgroups
 |
| |
|
In the high-income small household size, 15% score was recorded for the lowest score for tenement, while 54% being the highest score for satisfaction was recorded for the non-tenement in the physical element. The proportion of the dissatisfied population with each group illustrated urban housing problems in a pronounced perspective. This is because as much as 0.74 or 74% on the aggregate proportion of the population portrayed their housing dissatisfaction. Both the non-tenement and tenement small household size character were dissatisfied with behavioural elements that is associated with level of privacy, security and physical appearance of house with a high percentage of 93% followed by environmental elements 89%, physical elements 85% and functional elements 81%.
4.3. Interpretation of Results
The result of this study revealed that each attribute constitute a source of housing problem to almost the two subgroups of the low income earners, signifying that the urban poor does not just require anything (building) for residential purpose as mostly exemplified by public housing initiators but that public tenement housing providers should endeavour to ensure that infrastructural facilities and amenities are provided and maintained to forestall the development of shacks identifiable in slum areas of urban housing. The study also uncovered that the urban poor earners have a high tolerance for high occupancy ratio per room as compared to officially acceptable standard bias for the provision of single unit bungalows which is neither feasible nor sustainable for low-income earners.
5. Conclusions
The study was designed to examine the urban poor housing satisfaction and sustenance of environmental quality in the study area. The socio-economic characteristics of household size, level of education, type of employment household income and change in family cycle were used to classify urban poor into two groups and their degree of satisfaction was measured within the two groups.Findings indicated that there were differences between the two groups in the study area especially in the variation of discontentment in the six major attributes which were used as variables for the study. The two groups within the eleven wards studied in Calabar metropolis were not satisfied with their housing as they contend with varying dimensions of persuasive housing problems.
5.1. Recommendations
The study calls for a new housing policy initiative that caters for the needs and desires of the poor through a change and redirection from narrow and unsustainable housing conception and development to broad and sustainable housing initiatives which are rooted in consumer housing needs and desires to address the present colossal urban housing problems in Nigeria.
References
| [1] | Federal Republic of Nigeria, ‘’National Housing policy”, Federal Ministry of Works and Housing, Lagos, 1991. |
| [2] | Onibokun, A. G., 1982, “Evaluating Consumers Satisfaction with Housing: An application of a system approach”. American Institute of Planners Journal, Vol. 1, no.1 Pp189-200. |
| [3] | Iwuenze, L. I. “Habitability of Public housing scheme”: A regional evaluation of the Enugu Housing Development Authority. Unpublished PhD Dissertation University of Ibadan, Ibadan1977. |
| [4] | Elegbefor, A. A.,’’ Correlates of housing and demographic structures in Metropolitan Lagos’’. Unpublished PhD Dissertation, University of Ibadan, Ibadan, 1978. |
| [5] | Awotona, A.’’The Urban poor’s perception of housing conditions in Urban Development in Nigeria’’. (Ed.) Taylor, Avebury, Aldershot, Pp.130-144, 1993. |
| [6] | Ndubueze, O. J., 2001,’’ Urban Residential Housing Satisfaction of the low socio economic Group in Enugu metropolis’’. Journal of Nigerian Institute of Town Planners. Vol.1, no.14, Pp11-26. |
| [7] | Bilham Boult, A., Blades, H., Hancock, J. and Ridout, M. “People places and Themes”. Chicago. Heinemann, 200-224, 1999. |
| [8] | Diogu, J.O.,2002,’’Appraisal of consumer satisfaction in urban mass housing: A survey report in Mosaku’’, T. O. (ed) proceedings of the Millennium conference “building in the 21st century” Zaria, 206-213. |
| [9] | Olanrewaju, D. O and Fadairo, G., “Flooding as an induced environmental problem: A case study of Ala River in Akure, Nigeria”. Journal of Nigerian Institute of Town Planners Vol.1, no.16, Pp 85-96, 2003. |
| [10] | Oyesiku, K. O, 2003,” Sustainable Transportation strategies for intermediate cities in Nigeria” Journal of the Nigerian Institute of Town Planners, Vol.16, no.1, Pp 35-44. |
| [11] | Mba, H. C., 2004, “Physical Development Standards and Environmental Sustainability in Nigeria’’. Journal of Nigerian Institute of Town Planners. Vol.1, no.1, Pp15-30. |
| [12] | Oliveira, M. C. G. and Heineck, L. F. M., “An investigation into the determinants of built Environmental customer satisfaction: A focus for Research and practices. Cape Town, South Africa. 5-10, September, 1999. |
| [13] | Olatubara, C.O. and Fatoye, E.O., 2006, “Residential satisfaction in public Estatesin Lagos State, Nigeria”. Journal of Nigerian Institute of Town Planners, Vol.1, no.19, Pp103-124. |
| [14] | Lahdenpara, P. J. and Tiuri, U, A., “Setting up preconditions for long term customersatisfaction by means of open building”. CIB W55 and W65 symposium on customer satisfaction: A focus for research and practice. Cape Town, South Africa. 5 -10 September, 1999. |
| [15] | Swilling, M. and Annecke E.,2006, “Building Sustainable Communities in South Africa: Learning from the Lynedoch case”. Environment and Urbanization Journal, Vol.18, no.1 Pp 315 -332. |
| [16] | Oyalowo, B. A.,“Best Practices in the Design of Sustainable Neighbourhood”in Waheed A. Kadiri (Ed). Our cities our future: Dialogue on Urban Planning challenges and management Fabiyi Press Ltd, Lagos, Nigeria, 2009. |
| [17] | Wahab, K. A, 2002, “Urban Housing Nigeria” Proceedings of National Conference on the Cities in Nigeria. Organized by Faculty of Environmental Design and Management. OAU, Ile-Ife October, 73-78. |
| [18] | Moham, R.U., Kumaraswamy, D.A and Chan, C.S., 1998,“Contributors to construction Delay Journal of Construction Management and Economics 16: Pp 17-29. |
 Abstract
 Reference
 Full-Text PDF
 Full-text HTML