-
Paper Information
- Next Paper
- Previous Paper
- Paper Submission
-
Journal Information
- About This Journal
- Editorial Board
- Current Issue
- Archive
- Author Guidelines
- Contact Us
American Journal of Polymer Science
p-ISSN: 2163-1344 e-ISSN: 2163-1352
2015; 5(1A): 18-27
doi:10.5923/s.ajps.201501.03
Corrosion Resistant Polypyrrole/Flyash Composite Coatings Designed for Mild Steel Substrate
 Abstract
 Reference
 Full-Text PDF
 Full-text HTML
G. Ruhi, H. Bhandari, S. K. Dhawan
Polymeric & Soft Materials Section, CSIR-National Physical Laboratory, New Delhi, India
Correspondence to: G. Ruhi, Polymeric & Soft Materials Section, CSIR-National Physical Laboratory, New Delhi, India.
| Email: |  |
Copyright © 2015 Scientific & Academic Publishing. All Rights Reserved.
Polypyrrole-flyash (PPy-flyash) composite was synthesized by chemical oxidative emulsion polymerization of pyrrole monomer using FeCl3 as an oxidant. The synthesized composite was loaded in epoxy resin and subsequently coated on mild steel substrate using powder coating technique. XRD and FTIR analyses of the synthesized composite show the interaction between polypyrrole and flyash. SEM micrograph shows the embedded flyash particles in polypyrrole matrix. TGA thermograms show good thermal stability of the PPy-flyash composite as compared to neat polypyrrole. TGA thermograms of the coatings (epoxy alone and epoxy with different wt% loading of PPy-flyash composite) show appreciable increase in the thermal degradation temperatures of the coatings with PPy-flyash composite. Corrosion studies in 3.5% NaCl solution suggest significantly high corrosion protection efficiency (%P.E.) and high pore resistance (Rpore) for the epoxy coating with 2.0wt% loading of PPy-flyash composite (PF2). The EIS data obtained for the coatings exposed to 3.5% NaCl solution for 30 days show a superior corrosion resistance offered by the specimen PF2. The enhanced corrosion resistance of the coatings is due to the synergistic interaction between polypyrrole and flyash in the composite. Here, polypyrrole provides anodic protection to the steel substrate, whereas, flyash particles reinforce the integrity of the coating under corrosive conditions.
Keywords: Coatings, Polypyrrole, Flyash, EIS
Cite this paper: G. Ruhi, H. Bhandari, S. K. Dhawan, Corrosion Resistant Polypyrrole/Flyash Composite Coatings Designed for Mild Steel Substrate, American Journal of Polymer Science, Vol. 5 No. 1A, 2015, pp. 18-27. doi: 10.5923/s.ajps.201501.03.
Article Outline
1. Introduction
- Mild steel is a versatile engineering material because of its low cost, superior mechanical strength and good machinability. However, tendency to corrode limits its service life in various industrial applications. Application of corrosion resistant coatings can prevent or delay the degradation of steel exposed to aggressive environments, like sea water [1-4]. Flyash is a solid by product, generated in huge quantity during combustion of coal in thermal power stations. The mass scale dumping of flyash has led to severe environmental threat by contaminating surrounding air and land area. Therefore, utilization of flyash in various applications is required to avoid these problems [5-7]. Flyash, being rich in metal oxides like SiO2, Al2O3, Fe2O3 and TiO2, has tremendous potential in corrosion protection purposes. The ternary blends of flyash cement and silica fume is reported to improve the resistance to chloride ion penetration and reduce corrosion significantly [8]. Further, the fineness of fly ash improves the pore refinement and minimizes the access to deteriorating agents even at accelerated corrosion process [9]. Flyash as filler is important from both economic and commercial point of view [10-12].Conjugated polymers like polypyrrole (PPy), polyaniline (PANI) have been identified as corrosion inhibitors. The oxidizing property of these polymers provides anodic protection to the metal surface. Polypyrrole is a well known conjugated polymer because of its environmental stability, biocompatibility, physical and electrical properties. It is reported as a suitable coating material for corrosion protection purpose [13-15]. However, mechanical integrity and thermal stability of these polymeric coatings in harsh climatic conditions are still questionable. The objective of this work is to design polypyrrole-flyash (PPy-flyash) composite coatings for corrosion protection of mild steel substrate. The corrosion inhibition property of polypyrrole and reinforcing ability of flyash is utilized to design coatings with superior corrosion resistance for saline conditions. Electrochemical Impedance Spectroscopy (EIS) and Tafel plots were employed for the electrochemical characterizations of the test specimens. The coated specimens were exposed to Salt spray fog chamber to evaluate the corrosion resistance under accelerated test conditions.
2. Experimental Procedures
2.1. Chemicals and Materials
- Pyrrole (Acros Organics) was distilled and stored under nitrogen at 4C for further use. Sodium lauryl sulphate (SLS) and ferric chloride (FeCl3) were purchased from Merck Chemicals. A fine cenosphere type flyash powder was collected from the Badarpur Thermal Power Plant, India. Iron oxide was removed using a magnetic bar. Froth floatation method was used to remove the carbon content and dust impurities. The chemical composition of cleaned flyash shows that it has SiO2 (60–70%) and alumina (10–18%) as major constituents and MgO and alkalies varied between 1 and 5% each. The low carbon steel sheet of thickness 2 mm of composition, C = 0.18%, Mn = 0.5%, P = 0.04%, S = 0.06% and Fe = balance, is used as substrate. The steel specimens were obtained by cutting the steel sheet to a dimension of 10mm x 40mm x 2mm for corrosion studies and 150mm x 100 mm x 2mm for salt spray tests. The cut specimens were polished metallographically by grinding them with emery papers of 120, 600 and 800 grit size to attain a smooth finish. Thereafter, the steel specimens were degreased properly with acetone and kept in desiccator.
2.2. Synthesis of the Polymer Composite
- Chemical oxidative polymerization of pyrrole monomer was carried out in presence of FeCl3 to synthesize PPy-flyash composite. Flyash was added as filler by taking 10 wt% of pyrrole monomer. First of all flyash particles were dispersed in deionised water using a mechanical stirrer. 0.05 M of sodium lauryl sulphate (SLS) was added to the above suspension with continuous stirring. Afterwards, 0.1 M of pyrrole was added slowly followed by drop wise addition of ferric chloride solution (0.2M). The polymerization of pyrrole occurred with the appearance of black colour in the reaction suspension. The polymerization was carried out at room temperature for a period of 4-5 hrs. The obtained black suspension was filtered and washed thoroughly with ethanol and water. Thereafter, the synthesized black powder was dried under vacuum at 60C.
2.3. Development of the Coatings
- The synthesized polymer composite was blended with epoxy powder coating formulation in various wt% loadings (1.0, 2.0, 3.0 and 4.0%) using a laboratory ball mill. The composition of epoxy powder coating formulation is as follows: resin {epoxy (bisphenol A+polyester) (70%), Flow agent (D-88) (2.3%), degassing agent (benzoin) (0.7%), fillers (TiO2 and BaSO4) (27%). A homogeneously mixed polymer composite in epoxy was applied on mild steel specimens using an electrostatic spray gun held at 67.4 KV potential. The powder coated steel specimens were baked in oven at 180C for 30 minutes. The epoxy coating developed on steel substrate is designated as EC and epoxy coatings with different wt% loading of polymer composite are designated as PF1 (1.0%), PF2 (2.0 %), PF3 (3.0%) and PF4 (4.0%).
2.4. Characterizations
2.4.1. Characterization of the Polymer Composites
- Fourier Transform infrared (FTIR) spectroscopy (Model- Nicolet 5700) was employed in the spectral range of 4000-600cm-1 to analyse the chemical composition of the PPy-flyash composite. Scanning Electron Microscope (JEOL- JSM-6360A) was used estimate the size of the flyash particles and the morphology PPy-flyash composite. The energy dispersive X-Ray (EDX) was used to determine the elemental composition of the composite. X-Ray diffraction technique (Bruker D8 Advanced diffractometer) was employed to check the crystallinity of flyash and PPy-flyash composite. The thermal stability of the composite was analyzed using thermogravimetric analysis (TGA) (Mettler Toledo TGA/SDTA 851) at a heating rate of 15C min-1 in nitrogen atmosphere.
2.4.2. Characterization of the Coatings
- TGA of the final coating composition was carried out at a temperature range of 25-700C to evaluate the thermal stability of the designed coatings.
2.4.3. Electrochemical Characterization of the Coatings
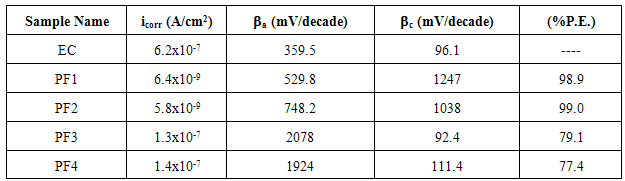
- Open Circuit Potential (OCP) vs time, Tafel polarization and Electrochemical Impedance Spectroscopy (EIS) was carried out using a traditional three electrode cell system Autolab Potentiostat/ Galvanostat, PGSTAT100 (NOVA Software). A three electrode cell assembly having coated steel specimens (1 cm2 area exposed) were taken as working electrodes, Pt as counter electrode and Ag/AgCl as reference electrode. All the tests were conducted in 3.5% NaCl solution at room temperature (25±2ºC). The test specimens were allowed to attain equilibrium in NaCl solution under open circuit potential (OCP) condition, for 60 minutes prior to the electrochemical tests. Tafel plots were obtained by carrying out potentiodynamic polarization at a constant scan rate of 1mV/sec by sweeping the potential between ±100 mV vs Ag/AgCl from Ecorr. The values of corrosion potential (Ecorr), corrosion current density (icorr), anodic (βa) and cathodic (βc) Tafel constants were extracted from Tafel plots. EIS was performed to extract the values of pore resistance (Rpore) and coating capacitance (Cc) by applying a sine potential signal of 10 mV in a frequency range of 100 KHz to 0.1 Hz at OCP. The values were derived by fitting suitable equivalent circuits. The corrosion protection efficiency (%P.E.) was determined from the measured icorr {corrosion current density of uncoated steel (icorr) and corrosion current density of coated steel (iccorr)} values by using the relationship [16] as mentioned in Equation 1.
 | (1) |
3. Results and Discussions
3.1. FTIR and XRD Spectra
- Figure 1 shows the FTIR spectra of flyash and PPy-flyash. The spectrum for flyash exhibits a band at 1090 cm-1, which corresponds to asymmetric stretching of Si-O or Al-O. A low intensity peak at 782 cm-1 is due to the presence of quartz (SiO2) and a peak at 552 cm-1 is due to presence of mullite (Al2O3) in the flyash. The FTIR spectrum of PPy-flyash shows a peak at 1540 cm-1 corresponding to typical pyrrole ring vibration [17]. The low intensity peak at 1474 cm−1 is attributed to =CH in plane vibration. A peak of considerable intensity at 1038 cm-1 is the N–H in plane deformation absorption of polypyrrole. The corresponding peak of C-N stretching [18] of polypyrrole occurs at 1186 cm-1which is shifted to 1166 cm-1 due to interaction between polypyrrole and flyash particles. The peaks at 782 cm-1 and 550 cm-1 shifted to 793 cm-1 and 561 cm-1, respectively for PPy-flyash composite due to weak van der waal forces. The occurrence of a broad band in PPy-flyash composite at 3436 cm-1 is due to hydrogen bonding between N-H of polypyrrole and oxygen of SiO2/Al2O3. The FTIR observations show synergistic interaction between polypyrrole and flyash particles.
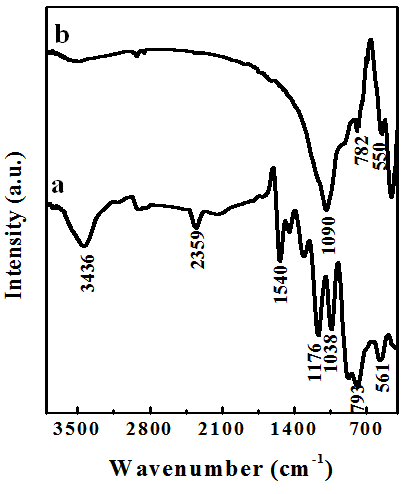 | Figure 1. FTIR spectra of (a) Flyash and (b) PPy-flyash composite |
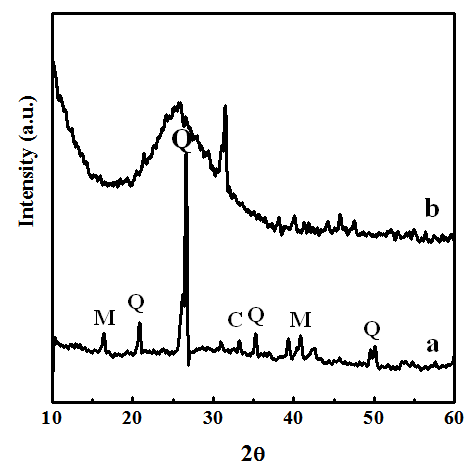 | Figure 2. XRD spectrum of (a) flyash showing peaks of Mullite, Quartz and Calcite. The spectrum for (b) PPy-flyash composite shows its amorphous nature |
3.2. Thermogravimetric Analysis (TGA)
- The TGA thermograms of flyash, polypyrrole and PPy-flyash composite are shown in Figure 3. The thermograms were recorded by heating the samples at a temperature range of 25 to 700ºC under nitrogen atmosphere (60 ml/min). The flyash has shown high thermal stability with no weight loss over the entire range of temperature. The thermograms of polypyrrole and PPy-flyash indicated two stage weight loss. The first stage weight loss (5-6%) at 100º C is attributed to the loss of water molecules from the polymer matrix [19]. The second stage weight loss started at 234 and 285C for polypyrrole and PPy-flyash, respectively. The corresponding weight loss represents the thermal degradation of polymer backbone [20]. Interestingly, a considerable enhancement of degradation temperature (50C) is noticed for the PPy-flyash composite. This is basically due to the presence of flyash particles as filler in the polypyrrole matrix. Flyash is stable in the range from room temperature to 700°C and when incorporated in polypyrrole, restricts the thermal motion of the polypyrrole chains and shields the degradation of polymer [21]. The weight loss for polypyrrole and PPy-flyash composite at 700ºC is found to be 87% and 58%, respectively.
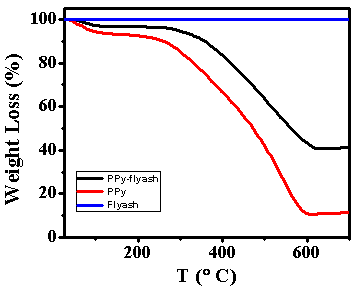 | Figure 3. TGA thermograms of flyash, polypyrrole (PPy) and PPy-flyash |
3.3. Microstructural Analysis
- Figure 4a shows the SEM micrograph of flyash. The micrograph revealed the spherical morphology of flyash particles. The SEM micrograph of PPy-flyash composite (Figure 4b) showed a regular cauliflower like morphology of polypyrrole matrix embedded with flyash particles. The EDS analysis shows presence of elements, Carbon (62.1%), Oxygen (24.0%), Aluminium (1.4%), Silicon (2.5%) and Nitrogen (5.2%) in the composite.
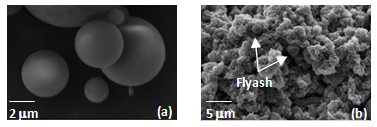 | Figure 4. SEM micrograph of (a) flyash (b) PPy-flyash composite |
3.4. TGA Thermograms of the Coating System
- Figure 5 shows the TGA thermograms of coating formulations (epoxy and epoxy with different wt% loading of PPy-flyash composites). All the samples exhibited almost similar trends of weight loss. For epoxy, almost no weight loss is observed till the attainment of 347C. However, an abrupt weight loss observed above this temperature shows the thermal degradation of epoxy resin. This is basically due to the physical cracking of the cross-linking of epoxy resin at this temperature. Interesting results are obtained for epoxy with 2.0, 3.0 and 4.0 wt% loading of PPy-flyash composite. An appreciable difference in the thermal degradation temperature of epoxy and epoxy with PPy-flyash composite is observed. The thermal degradation temperature of PF2, PF3 and PF4 occurred at 371, 382 and 393C, respectively. The appreciable shift of thermal degradation temperature clearly shows that the PPy-flyash composite enhances the thermal stability of epoxy resin.
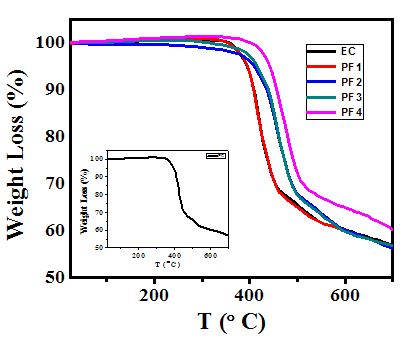 | Figure 5. TGA thermograms of epoxy resin (EC) and epoxy with 1.0wt% (PF1), 2.0wt% (PF2), 3.0wt% (PF3) and 4.0wt% (PF4) loading of PPy-flyash |
3.5. Corrosion Studies of the Coatings
3.5.1. Open Circuit Potential (OCP) vs Time
- Figure 6 depicts the variation of OCP against time for epoxy coating (EC) and epoxy coatings with different wt% loading of PPy-flyash composite (PF1, PF2, PF3 and PF4) in 3.5% NaCl solution at room temperature (25±2C). The trend of OCP variation for epoxy coating shows a sharp decrease of potential towards negative direction, within few minutes of immersion. This is due to the rapid diffusion of chloride ions through the coating. This was followed by the sudden shift of potential towards positive direction. However, the potential decreased steeply within few minutes and became almost stable till the end of the test. The steady state value of OCP for epoxy coating is observed to be 0.46 V vs Ag/AgCl. The epoxy coatings with PPy-flyash composite have demonstrated almost similar trend of the OCP variation with the passage of time. The OCP of the specimens PF1, PF2 and PF3 shifted negatively followed by a positive shift till the end of immersion time. The positive shift of OCP basically shows the passive state of under lying metal because of the good corrosion protection ability of the surface film [22]. However, trend of OCP variation of epoxy coating with 4.0% loading of PPy-flyash (PF4) shifted sharply towards negative potential after 76 minutes of immersion. This shows the rapid diffusion of chloride ions through the coating to the metal surface. The steady state values of OCP for specimens PF1, PF2 and PF3 is measured to be 360 mV, 280 mV and 350 mV more positive than the specimen EC. The occurrence of high positive OCP values is due to the effective barrier property of PPy-flyash composite towards the ingress of chloride ions to the metal surface.
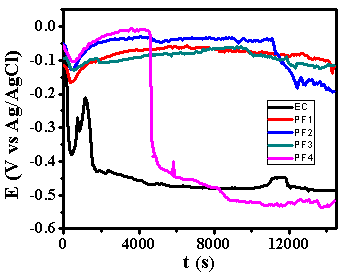 | Figure 6. The OCP vs time graphs of epoxy coating (EC) and epoxy with 1.0wt% (PF1), 2.0wt% (PF2), 3.0wt% (PF3) and 4.0wt% (PF4) loading of PPy-flyash composite coatings in 3.5% naCl solution at 25±2C |
3.5.2. Tafel Plots
- Figure 7 shows the Tafel polarization behaviour of epoxy coating (EC) and epoxy coatings with different wt% loading of PPy-flyash composite (PF1, PF2, PF3 and PF4) after 1 h of immersion in 3.5% NaCl solution at room temperature (25±2ºC). The plots were drawn to derive the values of different electrochemical parameters like corrosion current density (icorr), anodic (βa) and cathodic (βc) Tafel constants by extrapolating the anodic and cathodic curve using Tafel extrapolation method (Table 1).
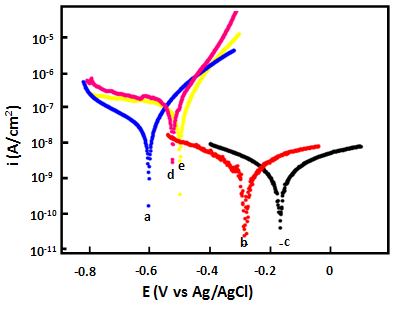 | Figure 7. The Tafel plots of (a) epoxy coating and epoxy coatings with (b) 1.0wt% (PF1), (c) 2.0wt% (PF2), (d) 3.0wt% (PF3) and (e) 4.0wt% loading of PPy-flyash composite coatings in 3.5% naCl solution at 25±2C |
|
 | Figure 8. Schematic representation of corrosion resistance shown by PPy/flyash composite present in epoxy coatings |
3.5.3. Electrochemical Impedance Spectroscopy (EIS)
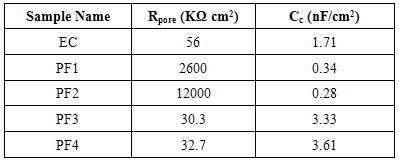
- Test specimens were kept at OCP conditions for 1 hr in 3.5% NaCl solution for impedance analysis. All the measurements were carried out at room temperature (25±2C). The impedance graphs obtained for epoxy coating (EC) and epoxy coatings with different wt% loading of PPy-flyash composite (PF1, PF2, PF3 and PF4) are displayed in Nyquist plots (Figure 9) and Bode plots (Figure 11).The Nyquist plot of specimen EC shows a small arc of semi-circle with a low value of impedance (Figure 9b). Interestingly, the Nyquist plot for specimen PF1 shows a high frequency capacitive behavisour followed by low frequency diffusion controlled behaviour of the coating. The capacitive behaviour shown by the specimen PF1 in the high frequency region demonstrates the corrosion resistance property of the coating, while the diffusion controlled behaviour in the low frequency region indicated the occurrence of diffusion process at the coating/metal interface [27]. The Nyquist plot for specimen PF2 shows capacitive and resistive behaviour with significantly high impedance. The corresponding Nyquist plots for specimens PF3 and PF4 exhibit a very small semicircle with a very low impedance value. The Nyquist plots of specimens EC, PF2, PF3 and PF4 have shown one time constant. Therefore, a simplistic circuit (Figure 10a) having a resistor connected in series to a parallel connected capacitor and resistor is applied to measure parameters like, pore resistance (Rpore) and coating capacitance (Cc). Whereas, for specimen PF1, (shows diffusion behaviour), an additional circuit element, Warburg impedance (W) is introduced in the equivalent circuit (Figure 10b).The electrical resistance of a coating system is measured in terms of pore resistance (Rpore) and it signifies the performance of the surface coating. Whereas, coating capacitance (Cc) is an important parameter to measure the integrity of the coating and is related to water uptake tendency of the coating. Among the test specimens, the specimen EC evidenced the occurrence of a low pore resistance (Rpore) and high coating capacitance (Cc) (Table 2). This is due to the high water uptake by the epoxy coating due to its weak barrier property. The Rpore increased almost one and two orders of magnitude for specimen PF1 and PF2, respectively as compared to specimen EC. The specimen PF2 evidenced the highest Rpore (1.2x10⁷ Ω) among the test specimens exhibiting its superior corrosion resistance property. The coating capacitance (Cc), occur in the decreasing order as, PF4, PF3, EC, PF1, PF2 (Table 2). The low coating capacitance observed for epoxy coatings with 1.0 and 2.0wt% loading of PPy-flyash composite is due to the low electrolyte uptake by the surface coating. However, the Cc increased with the further increase of the wt% loading of composite in the epoxy system. So, we can say that the increased wt% loading of PPy-flyash composite causes high electrolyte uptake and has a detrimental effect on the barrier property of the coating.
 | Figure 9. Nyquist plots of epoxy coating (EC) and epoxy coatings with 1.0wt% (PF1), 2.0wt% (PF2), 3.0wt% (PF3) and 4.0 wt% (PF4) loading of PPy-flyash composite in 3.5% NaCl solution at 25±2 C. A magnified view of high frequency region is shown in figure (b) |
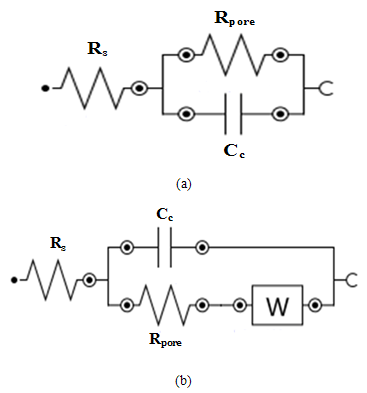 | Figure 10. Electrical equivalent circuits of (a) intact coating in contact with 3.5% NaCl solution, (b) coatings showing diffusion of chloride ions. Here Rs is the electrolyte resistance, Rpore the pore resistance, Cc the coating capacitance |
|
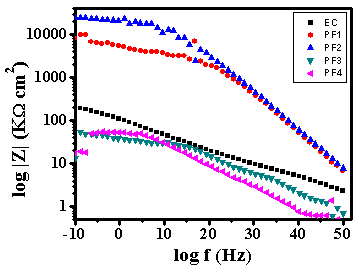 | Figure 11. Bode plots of epoxy coating (EC) and epoxy coatings with 1.0wt% (PF1), 2.0wt% (PF2), 3.0wt% (PF3) and 4.0 wt% (PF4) loading of PPy-flyash composite in 3.5% NaCl solution at 25±2C |
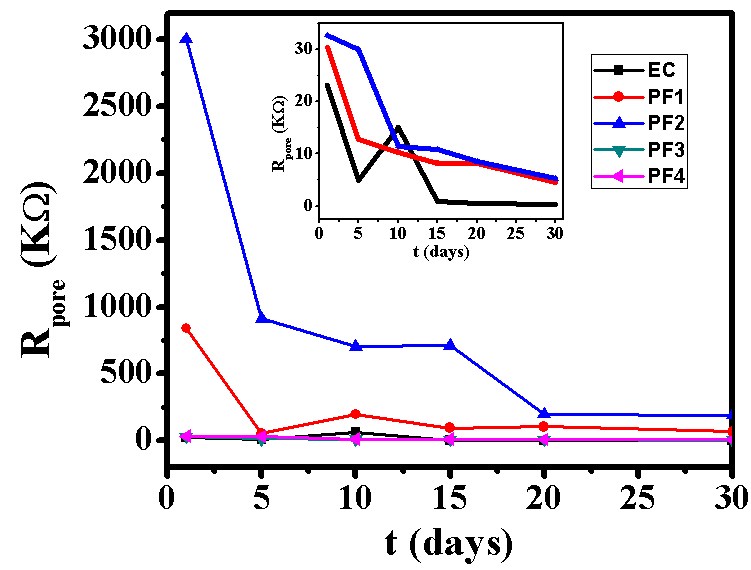 | Figure 12. Variation of Rpore of epoxy coating (EC) and epoxy coatings with 1.0wt% (PF1), 2.0wt% (PF2), 3.0wt% (PF3) and 4.0 wt% (PF4) loading of PPy-flyash composite in 3.5% NaCl solution. The variation of Rpore of specimens EC, PF3 and PF4 is shown in inset |
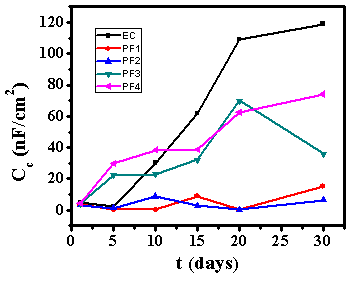 | Figure 13. Variation of Cc of epoxy coating (EC) and epoxy coatings with 1.0wt% (PF1), 2.0wt% (PF2), 3.0wt% (PF3) and 4.0 wt% (PF4) loading of PPy-flyash composite in 3.5% NaCl solution |
3.6. Salt Spray Test
- Figure 14 shows the photographs of epoxy coated mild steel panels (EC) and epoxy with different wt% loading of PPy-flyash composite (PF1, PF2 and PF3) coated steel panels after exposure to salt spray fog for 150 days. Epoxy coated mild steel panel reveals the appearance of severe rusting and blistering along the scribe mark as shown in Figure 14a. The appearance of rust clearly indicates the loss of adherence of the epoxy coating to its substrate during prolong exposure to the salt spray fog. Several pin holes are also visible on the surface of epoxy coating.
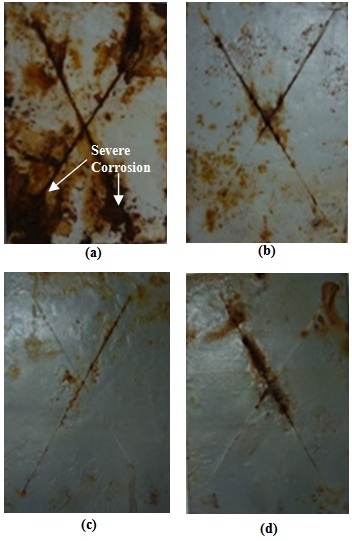 | Figure 14. Photographs of (a) epoxy coated and epoxy with (b) 1.0wt%, (c) 2.0wt%, (d) 3.0wt% loading of PPy-flyash composite coated steel specimens exposed to salt spray fog after 150 days |
4. Conclusions
- In this study, PPy-flyash composite was synthesized to design coatings for corrosion protection of mild steel substrate in 3.5% NaCl solution and under accelerated test conditions. The synergistic interaction between polypyrrole and flyash in the composite resulted in the improved thermal stability of the coatings. The corrosion resistant properties of the coatings were established from the results of Tafel polarization, impedance analysis and salt spray tests. In all these studies, epoxy coatings with 1.0 and 2.0 wt% loading of PPy-flyash composite exhibit significantly high corrosion resistance as compared to epoxy coating alone. The PPy-flyash composite acts as an effective barrier layer to passivate the metal surface and delay the degradation of coating under extremely corrosive conditions.
ACKNOWLEDGEMENTS
- Authors thank the Director, (CSIR)-National Physical Laboratory, New Delhi for providing the laboratory facilities for conducting experiments and characterizations. Their thanks are extended to Mr. Brij Bisht for salt spray test results. One of the authors Gazala Ruhi is thankful to CSIR for her RA fellowship.