-
Paper Information
- Previous Paper
- Paper Submission
-
Journal Information
- About This Journal
- Editorial Board
- Current Issue
- Archive
- Author Guidelines
- Contact Us
American Journal of Geographic Information System
p-ISSN: 2163-1131 e-ISSN: 2163-114X
2017; 6(1A): 23-28
doi:10.5923/s.ajgis.201701.03

Applying Logistic Regression for Landslide Susceptibility Mapping. The Case Study of Krathis Watershed, North Peloponnese, Greece
 Abstract
 Reference
 Full-Text PDF
 Full-text HTML
Dionysis Horafas1, Theodora Gkeki2
1Civil Engineer, Xylokastro, Greece
2Civil Engineer, Derveni, Greece
Correspondence to: Dionysis Horafas, Civil Engineer, Xylokastro, Greece.
| Email: |  |
Copyright © 2017 Scientific & Academic Publishing. All Rights Reserved.
This work is licensed under the Creative Commons Attribution International License (CC BY).
http://creativecommons.org/licenses/by/4.0/

The main objective of the present study was to produce a landslide susceptibility map by applying a Logistic regression model in the watershed of Krathis River that is located in the Achaia County, North Peloponnese, Greece. Five parameters were analyzed, namely: engineering geological units, slope angle, slope aspect, distance from faults and distance from river network. Each parameter was classified into different classes and weighted according to their susceptibility to slide. It was evaluated that the developed model classified correctly over 80% of the validation data. The developed model could be considered as a useful tool for the national and local authorities in order to evaluate strategies to prevent and mitigate the impact of landslides.
Keywords: Landslide susceptibility, Logistic regression, Krathis River, Greece
Cite this paper: Dionysis Horafas, Theodora Gkeki, Applying Logistic Regression for Landslide Susceptibility Mapping. The Case Study of Krathis Watershed, North Peloponnese, Greece, American Journal of Geographic Information System, Vol. 6 No. 1A, 2017, pp. 23-28. doi: 10.5923/s.ajgis.201701.03.
Article Outline
1. Introduction
- Landslides are geological phenomena that are characterized by a wide range of soil, debris or rock mass movements that may occur in offshore, coastal and inland areas, driven by the force of gravity and the aid of water [1]. Landslides are the result of the progressive or extreme evolution of natural events that occur due to the action of geological, tectonic, geomorphological and climatic processes. The methods and techniques that are used in landslide susceptibility assessments, which are defined by the spatial component of landslide occurrence, could be classified into two main approaches; the data driven approach that is based on the exploration of data and the knowledge driven approach that is based on the assessment of knowledge [2]. The knowledge driven approach methods are based on the site specific experience of experts with the landslide susceptibility determined directly in the field or by combining different layered index maps, while the data driven approach methods perform statistical and probabilistic analysis or follow deterministic approaches [3].Among the wide range of statistical methods proposed in the assessment of landslide susceptibility, logistic regression analysis (LR) is one of the most reliable approaches [4-7]. LR is a statistical technique that involves one or more independent variables in order to predict the probability of a binary or categorical dichotomous dependent variable [8]. The objective of LR analysis is to identify the best predictive model which describes the relations between the dependent variable and multiple independent variables [9]. Thus, by utilizing LR it could be possible to model the probability of presence and absence of the dependent variable. The main advantage of LR model over linear and log-linear regression models is that it does not assume normality among variables.In this context, the present study utilizes the logistic regression method to establish a landslide susceptibility map. As a case study, Krathis water basin at North Peloponnesus, Greece has been selected.
2. Study Area and Data
- The study area is located at the northern part of Peloponnesus, Greece. It concerns the Krathis watershed, approximately 145 km2 (Figure 1). Concerning the morphological settings, the relief of the wider area is influenced by the geological structure, the recent tectonic activity and the ongoing weathering and erosion mechanisms. The area is characterized as mountainous with strong relief, massive rocky limestone ridges and high peaks. In particular, the highest observed altitude is 2,310 m, with a mean elevation 985 m. Areas with slopes greater than 46° cover approximately 3.0% of the total area, while areas with slope angle less than 15° cover about 25%.
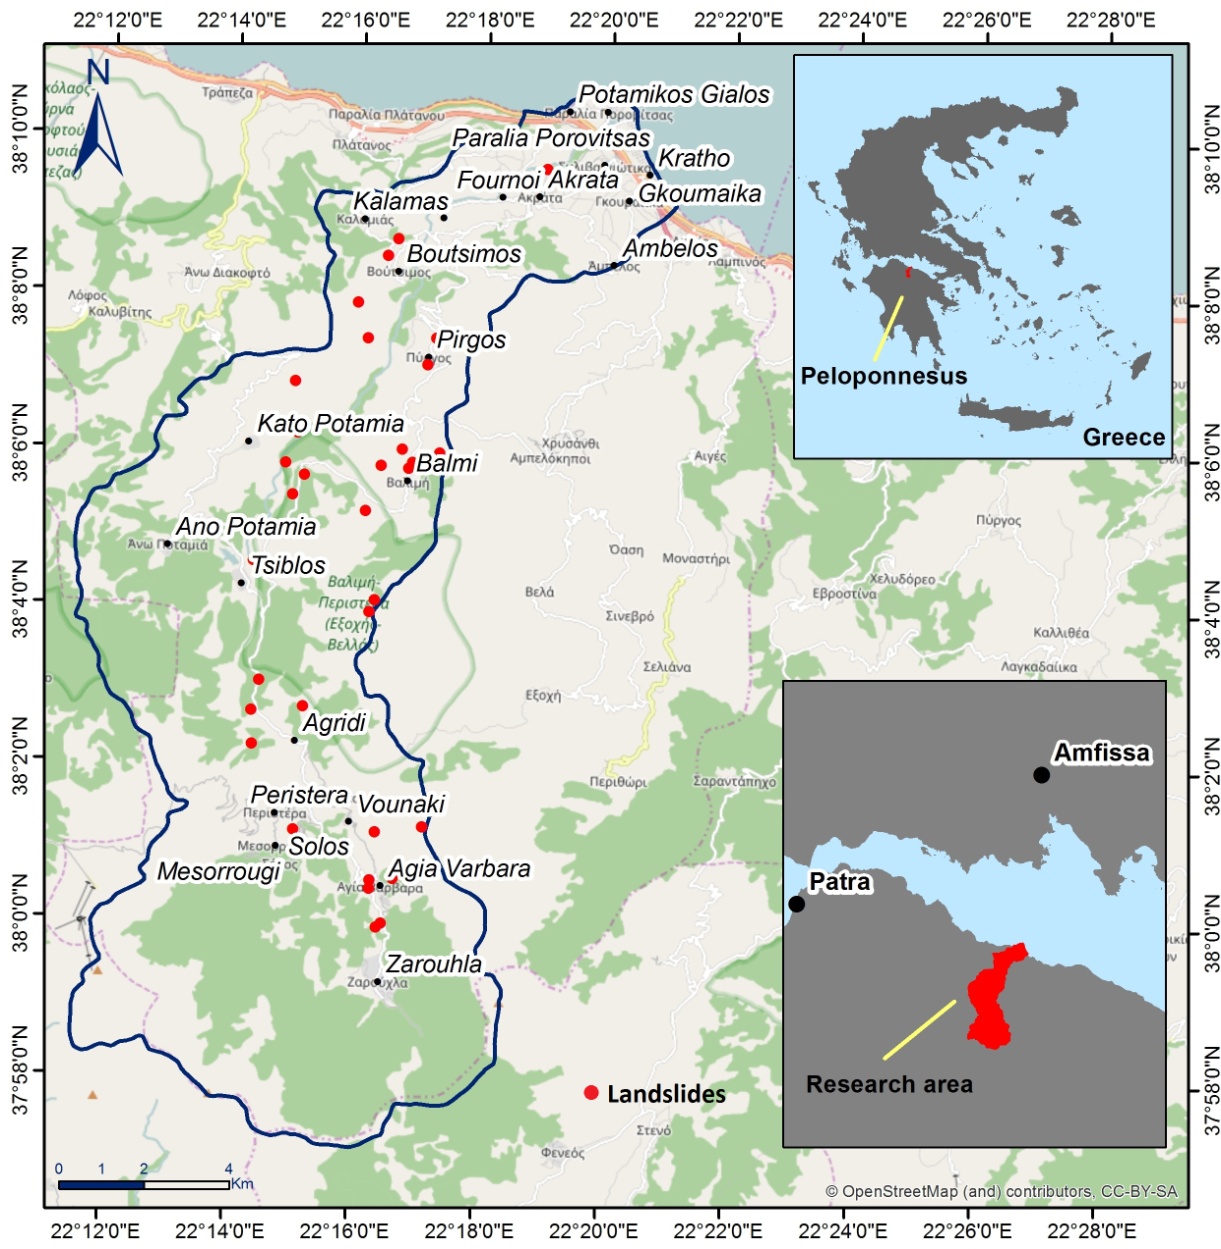 | Figure 1. Study area |
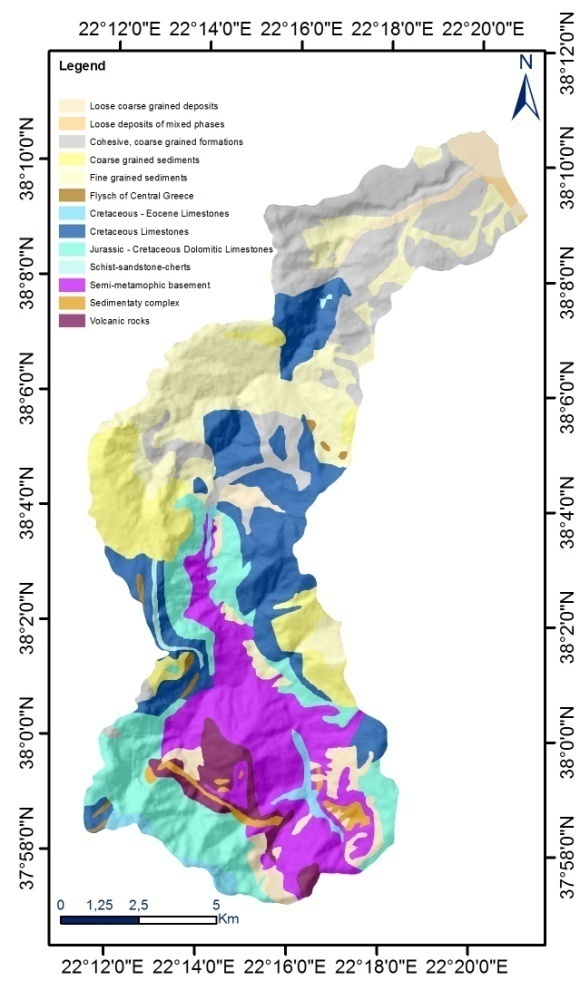 | Figure 2. Engineering geology units |
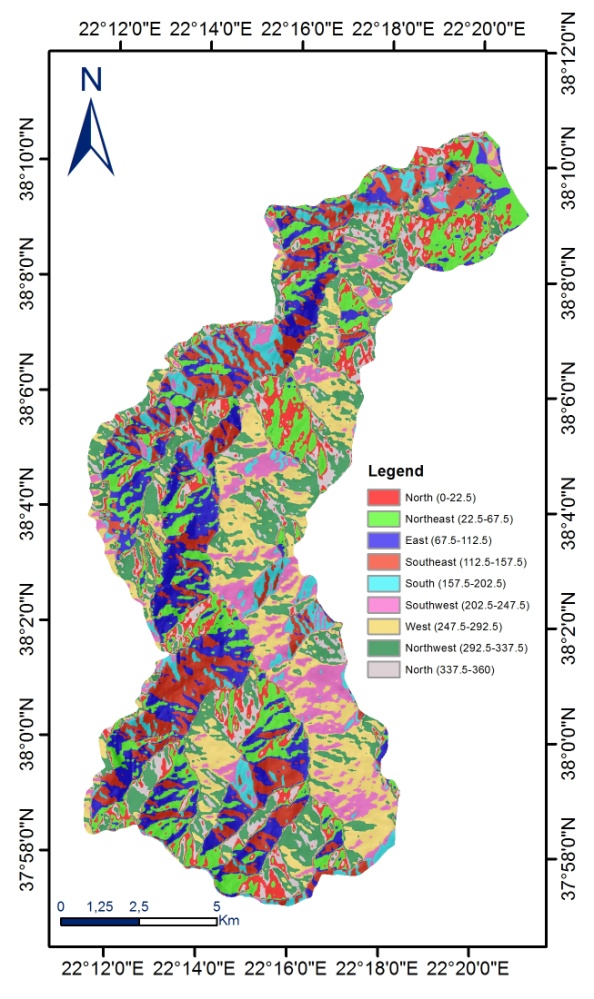 | Figure 3. Slope aspect |
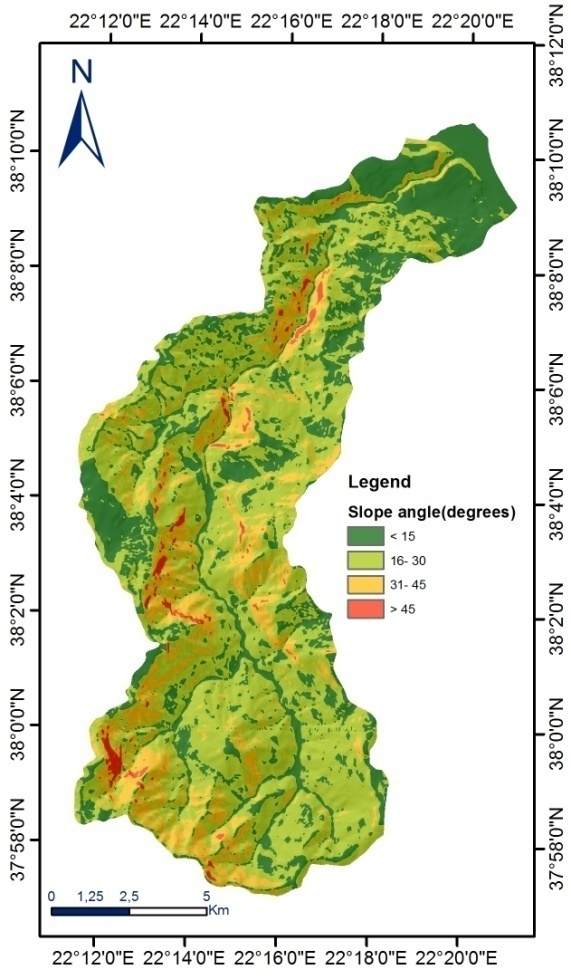 | Figure 4. Slope angle |
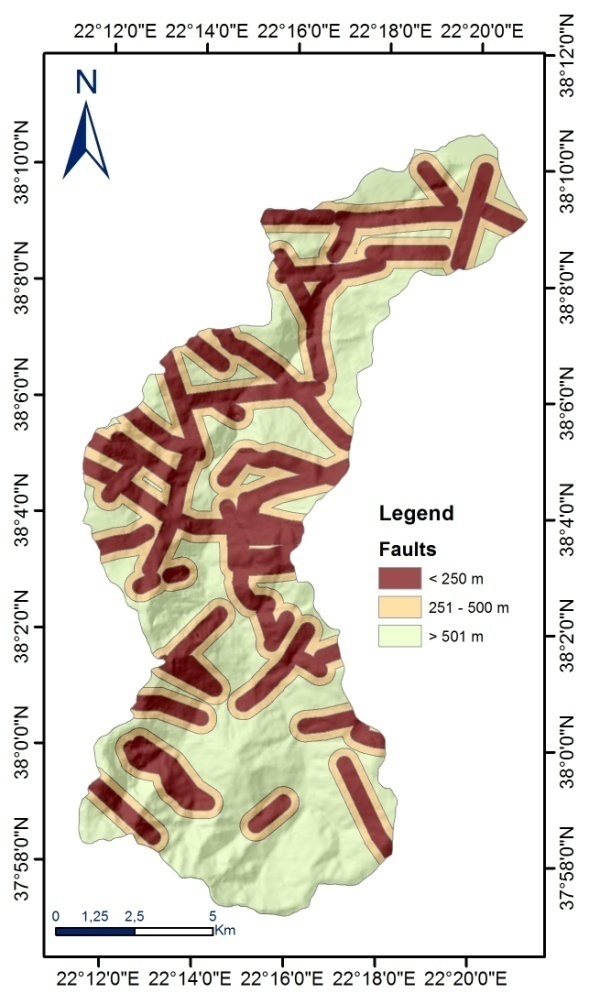 | Figure 5. Distance from faults |
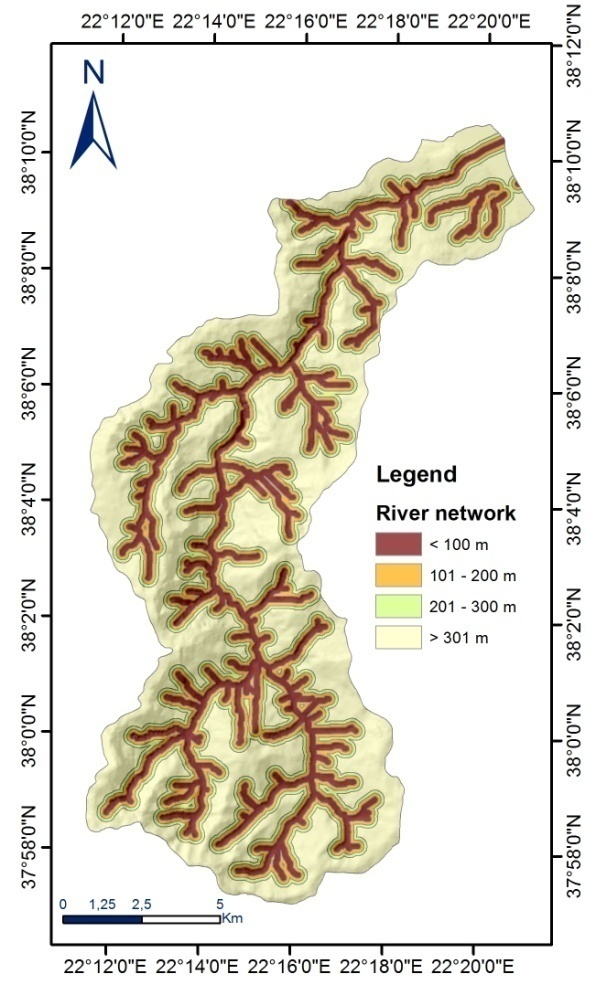 | Figure 6. Distance from river network |
3. Methodology
3.1. Data Preparation
- For the purpose of the study, the landslide dataset was randomly divided into two subsets: 80% of the landslide data were used for training and the remaining 20% for validating the developed model. Thirty six non-landslide areas were selected randomly within the research area and separated also into training and validating data.
3.2. Logistic Regression
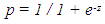
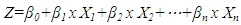
- When performing LR analysis the objective is to correlate the probability of landslide occurrence, that can take values from 0 to 1, to the “logit” Z (−∞ < Z < 0 for higher odds of non - occurrence and 0 < Z < ∞ for higher odds of occurrence). The probability of landslide occurrence is expressed by the following equation:
 | (1) |
 | (2) |
3.3. Landslide Susceptibility Mapping
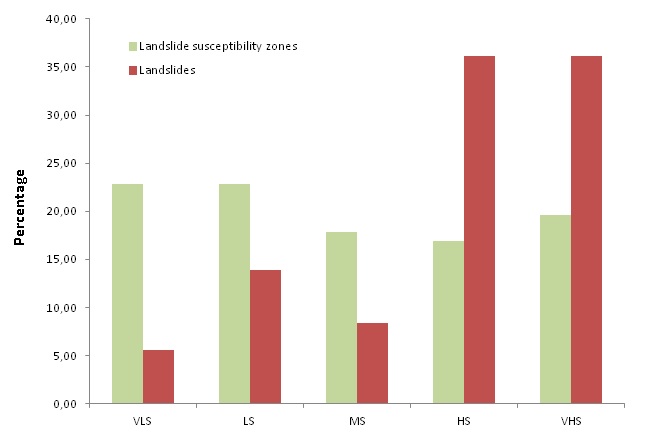
- The produced map was classified into five categories of susceptibility, namely very high susceptibility (VHS), high susceptibility (HS), moderate susceptibility (MS), low susceptibility (LS) and very low susceptibility (VLS), using the natural break method for the determination of the class intervals [12]. The computation process was carried out using SPSS for applying logistic regression and ArcGIS 10.3 was used for compiling and analysing the data and also for producing the landslide susceptibility maps.
4. Results and Discussion
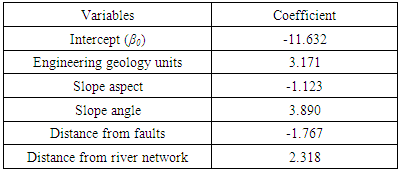
- The relative importance of the independent parameters was assessed using the coefficients of the logistic regression function (Table 1). According to the findings, the variables of engineering geology units, slope angle and distance from river network had a positive effect on the LR function. On the other hand, the slope aspect and distance from faults had a negative effect on landslide occurrence. Slope angle and engineering geologic units were found to be the most important variables that contribute to slope instability as they have the highest coefficients, 3.890 and 3.171 respectively. The outcomes of the present study is in agreement with the majority of the LS literature concerning landslide assessments [13-15], which have found that variations in landslide distribution are highly dependent on geological formations and slope angle. Concerning the research area, according to [16], fine grained Plio-Pleistocene sediments, which consist of alternations of clayey marls, marls, silty sands and weak sandstones, appear to be much more susceptible in rotational slides. Concerning, limestone formations, they appear susceptible to rockfalls, that are influenced by the degree of weathering and fragmentation, the orientation of the discontinuities surfaces and the intense morphological relief.
|
|
|
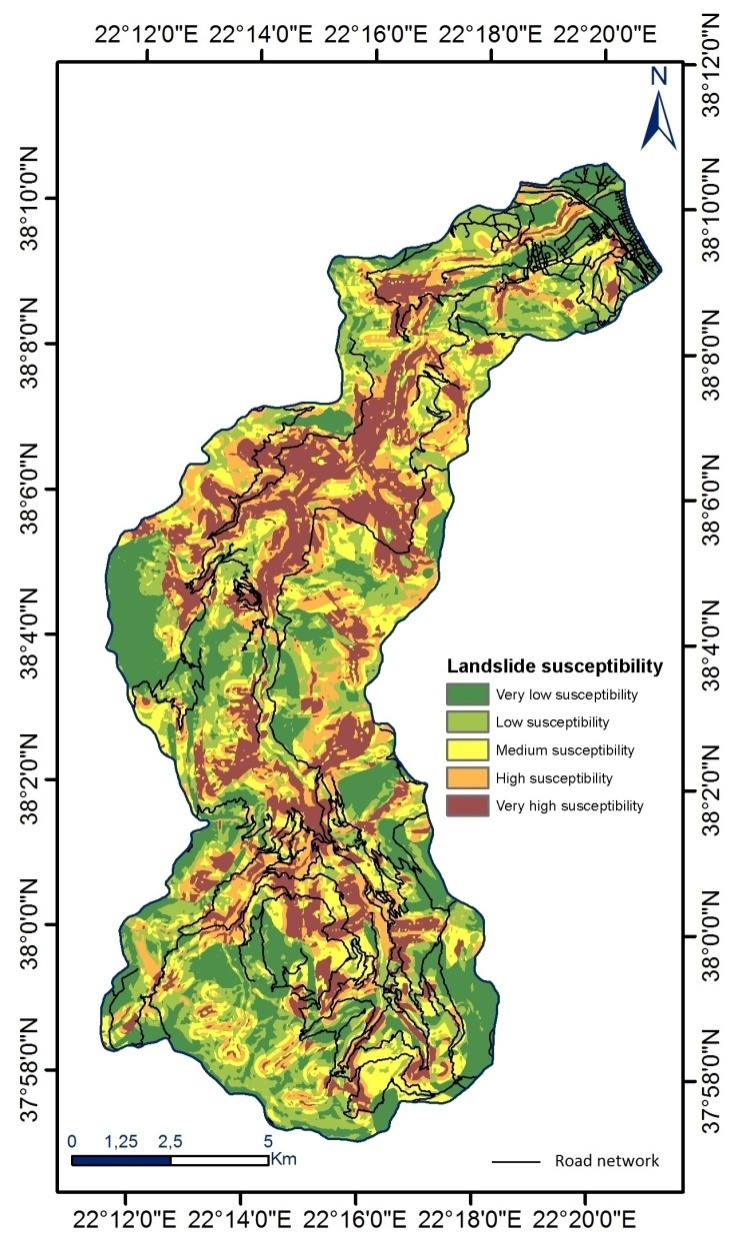 | Figure 7. Landslide susceptibility map |
 | Figure 8. Study area |
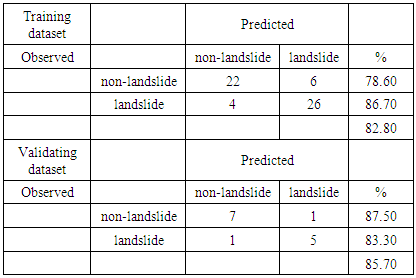
5. Conclusions
- The presented study focused on the construction of a landslide susceptibility map in the watershed of Krathis River that is located in the Achaia County, North Peloponnese, Greece, through the implementation of logistic regression method. Five landslide conditioning varaibles were analyzed and included in the study, namely engineering geological units, slope angle, slope aspect, distance from faults and distance from river network. The landslide inventory data contained thirty six landslides that were divided into two subsets, one for training (80% of the total data) and one for estimating the prediction capabilities of the developed methodology. Slope angle and engineering geological unit and distance from river network were among the most susceptible parameters. The LR model achieved an accuracy of correctly predicting landslide occurrence that reached 85.70%, indicating a good predictive performance. The findings of the analysis revealed that several sections of the road network fall within the very high susceptibility zone, a finding that should concern the local and national authorities.