American Journal of Geographic Information System

p-ISSN: 2163-1131    e-ISSN: 2163-114X

2017;  6(1A): 1-13

doi:10.5923/s.ajgis.201701.01


Providing a Landslide Susceptibility Map in Nancheng County, China, by Implementing Support Vector Machines

Haoyuan Hong1, 2, Chong Xu1, Wei Chen3

1Key Laboratory of Active Tectonics and Volcano, Institute of Geology, China Earthquake Administration, Beijing, China

2Jiangxi Provincial Meteorological Observatory, Jiangxi Meteorological Bureau, Nanchang, China

3College of Geology and Environment, Xi’an University of Science and Technology, Xi’an, China

Correspondence to: Haoyuan Hong, Key Laboratory of Active Tectonics and Volcano, Institute of Geology, China Earthquake Administration, Beijing, China.

Email:

Copyright © 2017 Scientific & Academic Publishing. All Rights Reserved.

This work is licensed under the Creative Commons Attribution International License (CC BY).
http://creativecommons.org/licenses/by/4.0/

Abstract

The main objective of the present study was to apply a Support Vector Machine for the construction of a landslide susceptibility map in the Nancheng area, China. The analysis was based on a database of 224 sites that was classified into non-landslide and landslide areas. Eight geo – environmental variables were analyzed, namely: lithology, soil, slope, aspect, elevation, topographic wetness index, distance to rivers and distance to faults. The database, 224 sites were separated into a training dataset (70%) and a validation dataset (30%). The validation of the outcomes was achieved using statistical evaluation measures, the receiving operating characteristic and the area under the prediction rate curves. In order to question the predictive performance of the Support Vector Machine, a Naïve Bayes classifier was also utilized, in its predictive accuracy was estimated. The analysis showed that the Support Vector Machine identified correctly 89.70% of the instances during the validation, followed by the Naïve Bayes model (86.78%).

Keywords: Landslide susceptibility, Support Vector Machine, Naïve Bayes, China

Cite this paper: Haoyuan Hong, Chong Xu, Wei Chen, Providing a Landslide Susceptibility Map in Nancheng County, China, by Implementing Support Vector Machines, American Journal of Geographic Information System, Vol. 6 No. 1A, 2017, pp. 1-13. doi: 10.5923/s.ajgis.201701.01.

1. Introduction

During the past three decades, landslides have been a significant subject of research as a consequence of their devastated nature. The annual direct and indirect economic losses that are reported for China and are related to landslides exceed 20 billion Yuan, making the lives of local people difficult [1]. Taking into account the fact that the demand for land has increased in China, as a result of population growth and economic development, landslide susceptibility mapping is considered as highly valuable tool which assist local and national agencies in regard to construction management and land use planning [2-6].
The methods and techniques that are used in landslide susceptibility assessments are classified into two main approaches; data - driven approach that is based on the exploration of data and knowledge - driven approach that is based on the assessment of knowledge derived by experts. In particular, knowledge – driven approach involves techniques that are based on experts specific experience with landslide susceptibility determined directly in the field or by combining different layered index maps, while data – driven approach incorporates methods that perform statistical and probabilistic analysis or follow deterministic approaches [4, 7]. The implementation of both approaches has been aided by the technology of Geographical Information System (GIS).
A wide range of different methods and techniques have been used for landslide susceptibility modelling, such as the analytical hierarchy process (AHP) [8], logistic regression [9], support vector machine [7, 10], neuro-fuzzy [11, 12], evidential belief functions [13, 14], decision tree [15, 16], random forest [17-19], artificial neural network [20, 21], weights-of-evidence [22, 23] and index of entropy [19, 24, 25, 26].
Each of the above mentioned methods have advantages and disadvantages and the decision of which to use depends on the purpose of investigation, the quality and quantity of data and relative resources. No general agreement exists regarding either the methods or the range for producing landslide susceptibility maps [27, 28].
However, according to [29] many of the above approaches suffer from conceptual limitations related to predictors’ independence assumption, while others appear strictly parametric and must satisfy several restrictive assumptions on data distribution. On the other hand, support vector machines (SVM) are presented as methods that do not concern about the presence or absence of non-regularity in the data, if data are not regularly distributed or have an unknown distribution, and ideal for problems that might not be linearly separable.
In this context, the present study applied SVM for the construction of a landslide susceptibility map in the Nancheng County, China. To evaluate its predictive performance it was compared to the predictive performance of a Naive Bayes model.

2. Methodology

The methodology followed during the present study could be separated into a four phase procedure; (a) constructing the inventory map and selecting the appropriate landslide related variables, (b) the data pre-processing phase, (c) the phase of implementing SVM and Naive Bayes (d) the validation and comparison of the models.
The computation process was carried out using Orange [30], an open source software for machine learning and data visualization, that uses interactive data analysis workflows and RStudio. ArcGIS 10.3 was utilized for compiling the data and producing the landslide susceptibility maps.
Figure 1 illustrates the flowchart of applying SVM and Naive Bayes, while a brief description of the two methods are presented in the paragraphs below.
Figure 1. FlowChart of the followed procedure

2.1. Support Vector Machines

SVM are a supervised machine learning method used for classification and regression analysis. Given a set of training data, that is known to belong to a certain category, an SVM training algorithm builds a model that assigns new data to one category or the other, making it a non-probabilistic binary linear classifier.
The aim of the SVM classification is to find an optimal separating hyper plane that can distinguish classes [31]. In cases where it is impossible to construct the separating hyper plane using the linear kernel function, the original input data may be transferred into a high-dimension feature space through some non-linear kernel functions.
The main objective of SVM is to search an n-dimensional hyperplane differentiating the two classes by their maximum gap, 1 / ||w||, which is equivalent to minimizing ||w||2 by:
minimize 1 / 2 ||w||2, subject to yi((w·xi) + b)=>1
where ||w|| is the norm of the normal of the hyperplane, b is a scalar base, and (·) denotes the scalar product operation.
For the case of non-separable data, the constraints are modified, including slack variables ξi:
yi((w·xi) + b)=>1-ξi
where w is a coefficient vector that determines the orientation of the hyper plane in the feature space, b is the offset of the hyper plane from the origin, and ξi is the positive slack variables [31].
The optimization problem now becomes:
minimize 1 / 2 ||w||2 + C Σξi, (i=1 το n)
subject to yi((w·xi) + b)=>1-ξi
The most popular kernels used in SVM classification tasks are polynomial kernels and Radial Basis Function (RBF). In this paper a RBF kernel was used to cope with the non-linear nature of the landslides. The mathematical representation of the RBF kernel is as follows:
Radial basis function: K(xi,xj)=e−γ(xi−xj)2,γ>0
where K(xi, xj) is the kernel function; γ is the gamma term

2.2. Naive Bayes

Naive Bayes is referred to as a simple probabilistic classifier which is based on Bayes' theorem having strong (naive) independence assumptions between the features. The Bayesian classification process is defined as a process that estimates the probability of a new observation belonging to a predefined category, using a probability model according to the theory of Bayes [32]. In the case where all the variables that describe the training data are independently and each of them contributes equally to the problem of classification, a simple method for Bayesian classification known as Naive Bayes has been developed [33]. Naive Bayes estimates the prior probability of each category based on a large set of training data, that are described by a number of variables, and assumes that classification could be estimated be calculating the conditional probability density function and the posteriori probability [33].

2.3. Validation and Comparison

The validation and comparison of the performance of the produced models are based on statistical evaluation measures, the receiving operating characteristic and the area under the success and prediction rate curves [34].
In addition estimation concerning the predictive power of the two models was achieved by following the procedure introduced by [35, 36]. According to the authors, an ideal landslide susceptibility map must have an increasing landslide density ratio when moving from low susceptible classes to high susceptible classes and the high susceptibility class to cover small extent areas.

3. Study Area

The Nancheng County is located in the Eastern of the JiangXi Province, between longitudes 117°25’00’E to 118°50’00’’E and latitudes 27°45’00’’N to 28°25’00’’N, covering an area of about 1,698.3 km2, with altitude ranging between 50 to 1,180 m above sea level (Figure 2).
Figure 2. The study area
Around 61.57% of the study area has a slope gradient less than 15° whereas areas with a slope gradient larger than 45° account for only 0.39%. 25.38% of the area is characterized by slope gradient between 15° and 25°, while 10.01% is characterized by slope gradient between 25° and 35°.
Figure 3. Temperature characteristics
Figure 4. Average precipitation
The climate of Nancheng County is classified as humid subtropical (Köppen Cfa), with long, humid, very hot summers and cool and drier winters with occasional cold snaps. According to the Jiangxi Province Meteorological Bureau (http://www.weather.org.cn), the mean annual rainfall for the period 1953-2015 ranged between 900.3 mm and 2866.4 mm. The average annual temperature is 17.8°C. The rainy season is from April to July accounting for the 55.2% of the yearly rainfall. In May and June, the average rainfall varies between 270 mm and 305 mm per month.

4. Data Preparation

The landslide inventory database which included 112 landslide locations was provided by the Jiangxi Department of Land and Resources (http://www.jxgtt.gov.cn) and the Jiangxi Meteorological Bureau (http://www.weather.org.cn). The database involved 70 rotational slides and 42 translational slides. For the training process, for both methods, an equal number of non-landslide areas were identified and included into the landslide inventory database.
Training and validating datasets were randomly produced from the total number of landslide and non-landslide areas. The training dataset contained a number of data that equalled to approximately 70% of the total number of landslide and non-landslide, while the rest 30% served as validating data.
Eight landslide variables were analyzed, namely: lithology, soil, slope, aspect, elevation, topographic wetness index, distance to rivers and distance to tectonic features.
Concerning the geological settings, based on data that was obtained by the China Geology Survey (http://www.cgs.gov.cn) more than 22 geological units are recognized, In the present study, the lithology map was reconstructed by classifying the geological formations into nine groups, based on clay composition, degree of weathering and physical and strength parameters (Table 1, Figure 5). The main lithological unit that covers approximately 37% of the area is granite porphyry of Cretaceous age, tuff, ignimbrite and sandstone gravel (class E) followed by leptynite, schist and marbles (class F) that covered 24% of the area and gray brown granulite, mica schist and quartz schist (class G) that covered 17% of the area [19].
Table 1. Lithological units
     
Figure 5. Lithology
Figure 6. Soil
Figure 7. Elevation
Figure 8. Aspect
Figure 9. Slope
Figure 10. Distance from river
Figure 11. TWI
Figure 12. Distance from faults

5. Results

In the present research, a SVM RBF kernel classifier was used in order to construct a landslide susceptibility map in the Nancheng County, China. By applying a 10-fold cross-validation technique the best values for parameters C and gamma (γ) were estimated. For the C parameter the search space was 0.1, 0.2, 0.3, 0.4, 0.5 and 1.0 and for the gamma 0.1, 0.2, 0.3, 0.4 and 0.5 (Table 2). The best performance is achieved having C and γ parameters, 0.2 and 0.1 respectively.
Table 2. Detail performance results
     
The predictive performance of SVM and Naive Bayes are presented in Table 3. As it can be seen the SVM model gave the best results. In the case of predicting non-landslide areas, SVM correctly classified 91.17% of the cases in the validation dataset, while Naive Bayes 88.23%. The same pattern of classification appears in the case of predicting landslide areas. SVM correctly identifies 88.23% of instability cases within the validation dataset, while Naive Bayes slightly less, 85.29%.
Table 3. Classification accuracy
     
Figure 13 illustrates the ROC curves that were estimated based on the validation dataset. The AUC value for the SVM model was estimated to be 0.897, while the AUC value for the Naive Bayes model was estimated to be 0.868.
Figure 13. ROC curves
Concerning the produced landslide susceptibility map, the high and very high susceptibility class was estimated to cover 27.00% and 13.35%, respectively, while the relative landslide density for the high and very high landslide susceptibility class was estimated to be 28.57% and 51.79%, respectively (Figure 14).
Figure 14. Landslide susceptibility zones – Relative landslide density
From the visual analysis of the landslide susceptibility map, high and very high susceptible zones are located at the west and east mountainous areas of the research area with the spatial pattern of the landslide susceptibility following the distribution of lithology and elevation (Figure 15).
Figure 15. Landslide susceptibility map

6. Discussion

The results of the comparison performed in the present study is in agreement with other similar studies concerning landslide, such as [37] and [7] who stated that SVM models with RBF function had the highest prediction capabilities among other data mining classification methods.
The performance of the SVM-RBF model is influenced by the selection of C and gamma parameter values. C controls the cost of misclassification on the training data, while gamma is parameter of the Gaussian radial basis function. In our study the gamma parameter is relative low (0.1), resulting in a SVM-RBF model with a low bias and high variance. The low bias assumes that the model can successfully identify the relevant relation between the landslide related variables features and target outcome. On the other hand, the high variance implies that our model is quite sensitive sensitivity to small fluctuations in the training dataset. There is a change of overfitting. The low C, estimated in our study (0.2) implies that the cost of misclassificaiton will be low, "soft margin", creating a smoother decision surface. The above have been confirmed by the high predictive power of the SVM-RBF model (89.70%).

7. Conclusions

The present study provides a predictive model that utilizes a Support Vector Machine model, for producing a landslide susceptibility map in the Nancheng County, China. Eight conditional variables, were selected and used in the analysis namely; lithology, soil, elevation, slope, aspect, topographic wetness index, distance to river network, distance to tectonic features.
According to the outcomes of the research, both models had satisfactory performance. However, the SVM model had a slightly higher performance in terms of AUC predictive values (0.8970) against the one estimated by the Naive Bayes model (0.8680). From the visual inspection of the produced landslide susceptibility maps the most susceptible areas are located at the west and east mountainous areas, while the central area is characterized by moderate to low susceptibility values.

References

[1]  Xie, QM,, Bian, X,, Xia, YY., 2005. Systematic analysis of risk evaluation of landslide hazard (in Chinese). Rock Soil Mech 26(1):71–74.
[2]  Xu, C., Dai, F., Xu, X., Yuan, HL., 2012. GIS-based support vector machine modeling of earthquake-triggered landslide susceptibility in the Jianjiang river watershed, china. Geomorphology. 145–146:70–80.
[3]  Feizizadeh, B., Blaschke, T., Roodposhti, MS., 2013. Integrating GIS based fuzzy set theory in multicriteria evaluation methods for landslide susceptibility mapping. Int. J. Geoinf., 9 (3), 49–57.
[4]  Chen, W., Chai, H., Zhao, Z., Wang, Q., Hong, H., 2016. Landslide susceptibility mapping based on GIS and support vector machine models for the Qianyang County, China. Environ Earth Sci. 75:1–13.
[5]  Zhu, A-X., Wang, R., Qiao J., Qin, C-Z. Chen, Y., Liu, J., Du, F., Lin, Y., Zhu, T., 2014. An expert knowledge-based approach to landslide susceptibility mapping using GIS and fuzzy logic. Geomorphology 214:128–138.
[6]  Peng, L., Niu, R., Huang, B., Wu, X., Zhao, Y., Ye, R., 2014. Landslide susceptibility mapping based on rough set theory and support vector machines: a case of the three gorges area, China. Geomorphology. 204:287–301.
[7]  Hong, H., Pradhan, B., Jebur, MN., Tien Bui, D., Xu, C., Akgun, A., 2016. Spatial prediction of landslide hazard at the Luxi area (China) using support vector machines. Environ Earth Sci. 75:1–14.
[8]  Pourghasemi, HR., Pradhan, B., Gokceoglu, C., 2012b. Application of fuzzy logic and analytical hierarchy process (AHP) to landslide susceptibility mapping at Haraz watershed, Iran. Nat Hazards 63(2):965–996.
[9]  Wang, LJ., Sawada, K., Moriguchi, S., 2013. Landslide susceptibility analysis with logistic regression model based on FCM sampling strategy. Computers & Geosciences, 57, 81–92.
[10]  Pourghasemi, HR., Jirandeh, AG., Pradhan, B., Xu, C, Gokceoglu, C. 2013. Landslide susceptibility mapping using support vector machine and GIS at the Golestan province, Iran. J Earth Syst Sci. 122:349–369.
[11]  Vahidnia, MH., Alesheikh, AA., Alimohammadi, A., Hosseinali, F., 2010. A GIS-based neuro-fuzzy procedure for integrating knowledgeand data in landslide susceptibility mapping. Computers & Geosciences, 36(29), 1101–1114.
[12]  Sdao F., Lioi, DS., Pascale, S., Caniani, D., Mancini, IM., 2013. Landslide susceptibility assessment by using a neuro-fuzzy model: a case study in the Rupestrian heritage rich area of Matera. Nat. Hazards Earth Syst. Sci., 13, 395–407.
[13]  Pourghasemi, HR., Kerle, N., 2016. Random forests and evidential belief function-based landslide susceptibility assessment in Western Mazandaran Province, Iran. Environ Earth Sci (2016) 75:185
[14]  Mohammady, M., Pourghasemi, HR., Pradhan, B., 2012. Landslide susceptibility mapping at Golestan Province, Iran: a comparison between frequency ratio, Dempster-Shafer, and weights-of-evidence models. J Asian Earth Sci 61:221–236
[15]  Saito, H., Nakayama, D., Matsuyama, H., 2009. Comparison of landslide susceptibility based on a decision-tree model and actual landslide occurrence: the Akaishi mountains, Japan. Geomorphology, 109(3–4), 108–121.
[16]  Yeon, YK., Han, JG., Ryu, KH., 2010. Landslide susceptibility mapping in Injae, Korea, using a decision tree. Engineering Geology, 16(3–4), 274–283.
[17]  Catani F, Lagomarsino D, Segoni S, Tofani V (2013) Landslide susceptibility estimation by random forests technique: sensitivity and scaling issues. Nat Hazards Earth Syst Sci 13:2815–2831.
[18]  Youssef, AM., Pourghasemi, HR., Pourtaghi, ZS., Al-Katheeri, MM., 2015. Landslide susceptibility mapping using random forest, boosted regression tree, classification and regression tree, and general linear models and comparison of their performance at Wadi Tayyah basin, Asir Region, Saudi Arabia. Landslides. DOI: 10.1007/s10346-015-0614-1.
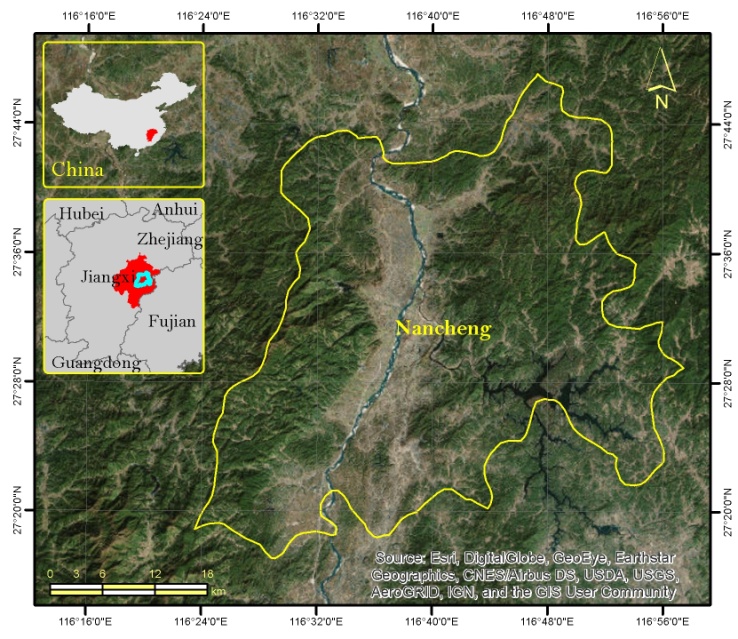
[19]  Tsangaratos, P., Ilia, I., Hong, H., Chen, W., Xu, C., 2016. Applying Information Theory and GIS-based quantitative methods to produce landslide susceptibility maps in Nancheng County, China. Landslides, DOI: 10.1007/s10346-016-0769-4.
[20]  Zare, M., Pourghasemi, H., Vafakhah, M., Pradhan, B., 2013. Landslide susceptibility mapping at Vaz Watershed (Iran) using an artificial neural network model: a comparison between multilayer perceptron (MLP) and radial basic function (RBF) algorithms. Arabian Journal of Geosciences, 6(8), 2873-2888.
[21]  Conforti, M., Aucelli, PP., Robustelli, G., Scarciglia, F. 2011. Geomorphology and GIS analysis for mapping gully erosion susceptibility in the Turbolo stream catchment (Northern Calabria, Italy). Nat Hazards 56(3):881–898.
[22]  Ozdemir, A., Altural, T., 2013. A comparative study of frequency ratio, weights of evidence and logistic regression methods for landslide susceptibility mapping: Sultan Mountains, SW Turkey. J Asian Earth Sci 64:180–197.
[23]  Ilia, I., Tsangaratos, P., 2016. Applying weight of evidence method and sensitivity analysis to produce a landslide susceptibility map. Landslides 13(2):379-397.
[24]  Devkota, KC., Regmi, AD., Pourghasemi, HR., Yoshida, K., Pradhan, B., Ryu, CI., Dhital, MR., Althuwaynee, OF., 2012. Landslide susceptibility mapping using certainty factor, index of entropy and logistic regression models in GIS and their comparison at Mugling–Narayanghat road section in Nepal Himalaya. Natural Hazards (65):135-165.
[25]  Jaafari, A., Najafi, A., Pourghasemi, HR., Rezaeian, J., Sattarian, A., 2014. GIS-based frequency ratio and index of entropy models for landslide susceptibility assessment in the Caspian forest, northern Iran. Int J Environ Sci Technol 11:909–926.
[26]  Youssef, AM., Al-Kathery, M., Pradhan, B., 2015. Landslide susceptibility mapping at Al-Hasher area, Jizan (Saudi Arabia) using GIS-based frequency ratio and index of entropy models. Geosci J 19:113–134.
[27]  Guzzetti, F., Carrara, A., Cardinali, M., Reichenbach, P., 1999. Landslide hazard evaluation: a review of current techniques and their application in a multi-scale study, Central Italy. Geomorphology, 31, 181–216.
[28]  Feizizadeh, B., Roodposhti, MS., Jankowski, P., Blaschke, T., 2014. A GIS-based extended fuzzy multi-criteria evaluation for landslide susceptibility mapping. Computers & Geosciences, 73, 208–221.
[29]  Ballabio, C., Sterlacchini, S., 2012. Support Vector Machines for Landslide Susceptibility Mapping: The Staffora River Basin Case Study, Italy. Mathematical Geosciences, 44(1), 47-70.
[30]  Demsar, J., Curk, T., Erjavec, A., Gorup, C., Hocevar, T., Milutinovic, M., Mozina, M., Polajnar, M., Toplak, M., Staric, A., Stajdohar, M., Umek, L., Zagar, L., Zbontar, J., Zitnik, M., Zupan, B., 2013. Orange: Data Mining Toolbox in Python. Journal of Machine Learning Research 14(Aug):2349−2353.
[31]  Cortes, C., Vapnik, V., 1995. Support-Vector Networks. Machine Learning, 20(3):273–297.
[32]  Cheeseman, P., Stutz, J., 1996. Bayesian classification (AutoClass): Theory and results. In Advances in knowledge discovery and data mining, 153–180. Menlo Park, CA: AAAI Press.
[33]  Soria, D., Garibaldi, JM., Ambrogi, F., Biganzoli, EM., Ellis, IO., 2011. A “non-parametric” version of the naive Bayes classifier. Knowledge-Based Systems, 24(6), 775–784.
[34]  Pham, BT., Pradhan, B., Tien Bui, D., Prakash, I., Dholakia, MB., 2016. A comparative study of different machine learning methods for landslide susceptibility assessment: a case study of Uttarakhand area (India). Environ Modell Softw. 84:240–250.
[35]  Can, T., Nefeslioglu, HA., Gokceoglu, C., Sonmez, H., Duman, TY., 2005. Susceptibility assessments of shallow earthlows triggered by heavy rainfall at three catchments by logistic regression analysis. Geomorphology 72(1–4): 250–271.
[36]  Pradhan, B., Lee, S., 2010. Delineation of landslide hazard areas on Penang Island, Malaysia, by using frequency ratio, logistic regression, and artificial neural network models. Environmental Earth Sciences, 60, 1037–1054.
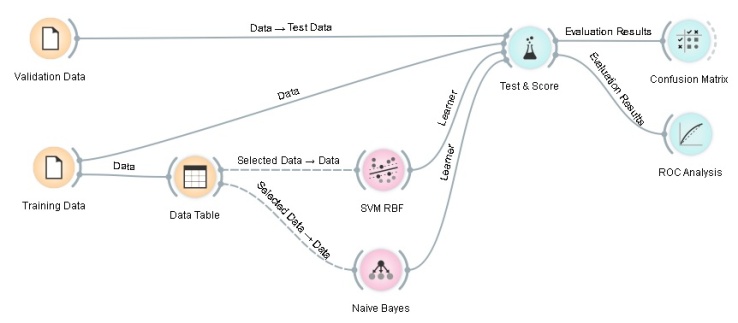
[37]  Tien Bui, D., Pradhan, B., Lofman, O., Revhaug, I., 2012. Landslide susceptibility assessment in Vietnam using support vector machines, decision tree, and Naive Bayes models. Math Probl Eng. 2012:1–27.