Nitish Arya , Rahul Kumar Soni , Ashoke De
Department of Aerospace Engineering, Indian Institute of Technology, Kanpur, India
Correspondence to: Ashoke De , Department of Aerospace Engineering, Indian Institute of Technology, Kanpur, India.
| Email: |  |
Copyright © 2015 Scientific & Academic Publishing. All Rights Reserved.
Abstract
The formation of large scale structures for the supersonic flow over a rectangular cavity is studied using Large Eddy Simulation (LES) and Proper Orthogonal Decomposition (POD), while the sub-grid scales (SGS) are modelled using dynamic Smagorinsky model. The Pressure distribution along the cavity walls obtained through the simulation is in good agreement with the empirical results presented in [1]. The Isosurfaces of Q show the evolution of structures inside as well as in the wake of the cavity. The contours of vorticity magnitude clearly show the flapping of the shear layer which is responsible for the generation of a feedback mechanism in the cavity. The density gradient contours show the propagation of transverse as well as longitudinal waves from the cavity. The large scale vortical structures in the mid plane along with the bending of the flow inside the cavity are captured by the POD basis functions.
Keywords:
LES, POD, Cavity, Shear layer, OpenFOAM, Coherent structures
Cite this paper: Nitish Arya , Rahul Kumar Soni , Ashoke De , Investigation of Flow Characteristics in Supersonic Cavity Using LES, American Journal of Fluid Dynamics, Vol. 5 No. 3A, 2015, pp. 24-32. doi: 10.5923/s.ajfd.201501.04.
1. Introduction
The intrinsic difficulty of efficient fuel mixing and flame holding, over manageable length, is attributed to the small residence time (O~ms) of the flow inside the scramjet combustor. Several parameters play important role in the design and development of suitable fuel mixing and flame holding, including static pressure, entrainment rate and drag. Cavity flame holders are designed to increase the residence time of the flow inside the combustor thereby ensuring a proper mixing of the fuel and the air and a stabilized, sustained flame.Cavity flow can be categorized as open cavity or closed cavity [2]. In an open cavity, the shear layer formed at the step corner spans the entire cavity length and reattaches at the rear face of the cavity. Large re-circulation region is established inside cavity due to the shear layer separation, which leads to nearly uniform static pressure distribution along the cavity floor, with small increment at the aft wall. Open cavities generally experience lower drag and also less entrainment from the main flow. Closed cavity flowfield is characterized by separation of free-stream flow from the leading edge, which in absence of sufficient energy is unable to span the entire cavity length leading to the flow re-attachment at some point along the cavity floor. Again, the flow separates further downstream of this point and reattaches along the trailing edge. Closed cavities suffer from larger drag coefficients compared to open cavities. Due to lower drag, open cavities are more desirable in a supersonic combustor. Cavity flow also exhibits another interesting flow feature, involving the mode by which acoustic waves propagate within the cavity. Krishnamurthy [3] found in his study, performed on cavities with L/D ratio varying from 2- to 10 for Mach numbers ranging from 0.4 to 1.5 that acoustic energy emanates from the point of impingement. Zhang and Edwards [4] put forward that for smaller values of L/D, cavity in a supersonic flow is dominated by the transverse mode, where acoustic waves propagate normal to the crossflow. However, no acoustic tones develop in closed cavities. With the increase in L/D, mode of oscillation changes to longitudinal, such that waves move along the cavity length. The transition from transverse to longitudinal modes leads to increased drag coefficient.A computational investigation for the supersonic flow over a 3-Dimensional cavity was done by Rizzetta [5]. Rizzetta’s results were in accordance with the simple physical model envisioned by Rossiter [6]. The frequency spectra from this computational analysis agreed well with the experimental data though overpredicting the amplitudes of these frequencies. The present work attempts to compute the turbulent supersonic flow over an open cavity for the characterization of flow structures when the propagation of the acoustic waves through a feedback loop has been initiated inside the cavity. Thorough understanding of the flow field over an open cavity with acoustic tones would enlighten the understanding of mixing behavior and complex flow; results obtained would offer deeper insight into the flame stabilization mechanism. LES of open cavity is performed in OpenFOAM framework, an open source computational fluid dynamics class library based on C++ [7]. The density based solver is chosen and modified as per our needs to simulate the flow physics at Mach 3 for cavity with L/D = 3. The test case investigated here represents one of the studies of wide experimental data of Gruber et al. [1]. The results from the simulation are used to perform POD in the mid plane to visualize the coherent structures in the flowfield.
2. Numerical Details
The Favre-filtered governing equations for the conservation of mass, momentum, and energy are given as:Continuity equation: 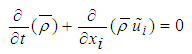 | (1) |
Momentum equation: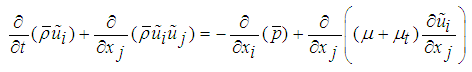 | (2) |
Energy equation: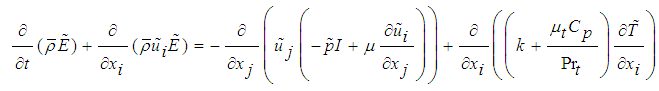 | (3) |
where ρ is the density, ui is the velocity vector, p is the pressure, E = e + u2i /2 is the total energy, where e = h - p/ρ is the internal energy and h is enthalpy. The fluid properties µ, and k are respectively the viscosity, and the thermal conductivity, while µt and Prt are the turbulent eddy viscosity, and the turbulent Prandtl number respectively Numerical results are obtained by employing dynamic SGS model inside the density based solver (rhoCentralFoam) in OpenFOAM framework [8]. The dynamic SGS model utilized for present computation is based on dynamic calculation of two model constants proposed by Moin et al. [9].The dynamic Smagorinsky model is implemented in OpenFoam in which the Smagorinsky constant is calculated using averaging at the cell faces as opposed to the existent dynamic model which used the global averaging for calculation. The global averaging for supersonic case which is associated with shock waves and expansion fans is highly unfeasible since the calculated Smagorinsky constant creates numerical instability. The dynamic model is clipped in such a way so that the back-scattering is allowed. It was clipped as  . The boundary layer has not been resolved but modeled using a wall model to reduce the computational cost of the simulation. The modelling of the boundary layer is achieved through a wall model which uses Spalding’s law of the wall to create a smooth profile for
  from the wall until the first grid point. The Spalding’s law of the wall is given by-
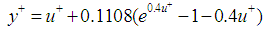 | (4) |
The frictional velocity and shear stress at the wall are given by the relation | (5) |
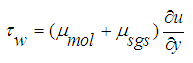 | (6) |
 and frictional velocity are related as
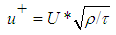 | (7) |
The  and
and  from the Spalding’s law of the wall follow the relation
 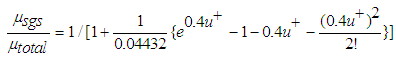 | (8) |
 is solved iteratively from the equations 5, 6, 7 and 8 by which the value of
  is calculated. Thus a smooth profile for
  is created by the wall function. POD analysis is performed along the mid plane data obtained from LES. In the present analysis method of snapshot is utilized to perform POD details of which can be found in [10-13].
3. Computational Details
The computational domain for the flow over a rectangular cavity is chosen according to the details provided in Gruber et al. [1]. The length of the cavity is 26.7 mm and the depth of the cavity is 8.9 mm with a width of 17.8 mm which is the width of the computational domain in the spanwise direction. Figure 1 presents the computational domain with multi-block structure to accommodate varying grid size. A multi-block hexahedral mesh with grid stretching in both wall normal as well as in streamwise direction is used to increase the number of grid points near the important points to capture the maximum flow features. A uniform grid is used in the spanwise direction. The mesh contains 4.83M grid points. The first grid point in the wall normal direction is alignedsuchthat it allows the incorporation of wall models in the calculations (the first grid point lies in the log law region of the boundary layer). A y+ value of 70 is taken for the present simulation.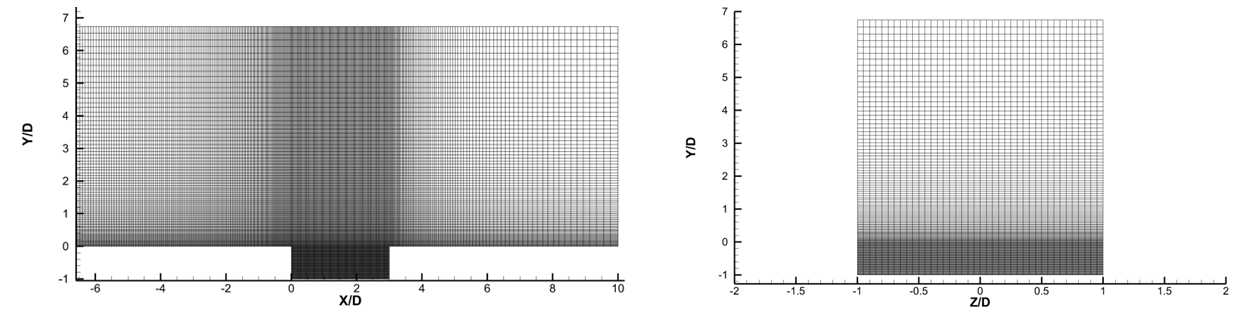 | Figure 1. Grid Distribution in xy and yz Planes |
At the inlet boundary, uniform flow properties such as free stream velocity (u∞ = 623 m/s), static pressure (P∞ = 18.784 KPa) and static temperature (T∞ = 107 K) are specified providing Mach 3 flow. No-slip boundary conditionis enforced along bottom wall while supersonic free-stream condition is imposed along the top surface. Periodicity is imposed along the side walls (span wise direction) and at the outlet, flow variables are extrapolated and non-reflecting boundary condition (NRBC) is imposed to allow outgoing waves to exit flow domain without reflection. Numerical results are obtained by employing dynamic SGS model inside the density based solver (rhoCentralFoam) in Open FOAM framework. The dynamics SGS model utilized for present computation is based on dynamic calculation of two model constants [7]. Second order backward Euler scheme is used for temporal discretization while the convection and diffusion terms are discretized using second order low dissipation filtered-linear scheme [7] and central difference scheme, respectively. The simulation is carried out for 70 non-dimensional time with time stepping of 10-8 that allowed for CFL number below 0.5.
4. Results and Discussion
The power spectral density (PSD) obtained through a Discrete Fourier Transform is shown in the Figure 2. Rossiter’s [5] modified formula predicts that the value of the first mode corresponds to the frequency of 4834 Hz. The dominant frequency is clearly seen to be 4883 Hz which is close to the Rossiter’s first mode. Sound pressure level is also plotted against the frequency at three different locations one at the front wall second at the mid cavity base and third at the aft wall of the cavity. It can be observed that at higher frequencies the spectrum becomes broadband with less distinct peaks. The highest amplitude of modes as well as high intensity broadband noise is occurring at the aft wall. The high amplitude peaks occur due to impingement of turbulent shear layer and intermittent impingement of shock at the edge of the aft wall. The occurrence of high amplitude broadband noise is due to interaction of large structures in the shear layer with the shock at the aft wall. Since the large scale structures increase in size from the front wall to the aft wall this broadband noise also increases from the front wall to the aft wall. The center of the cavity floor has minimum SPL. The surface pressure distribution along the cavity wall in the mid plane is shown in the Figure 3(a).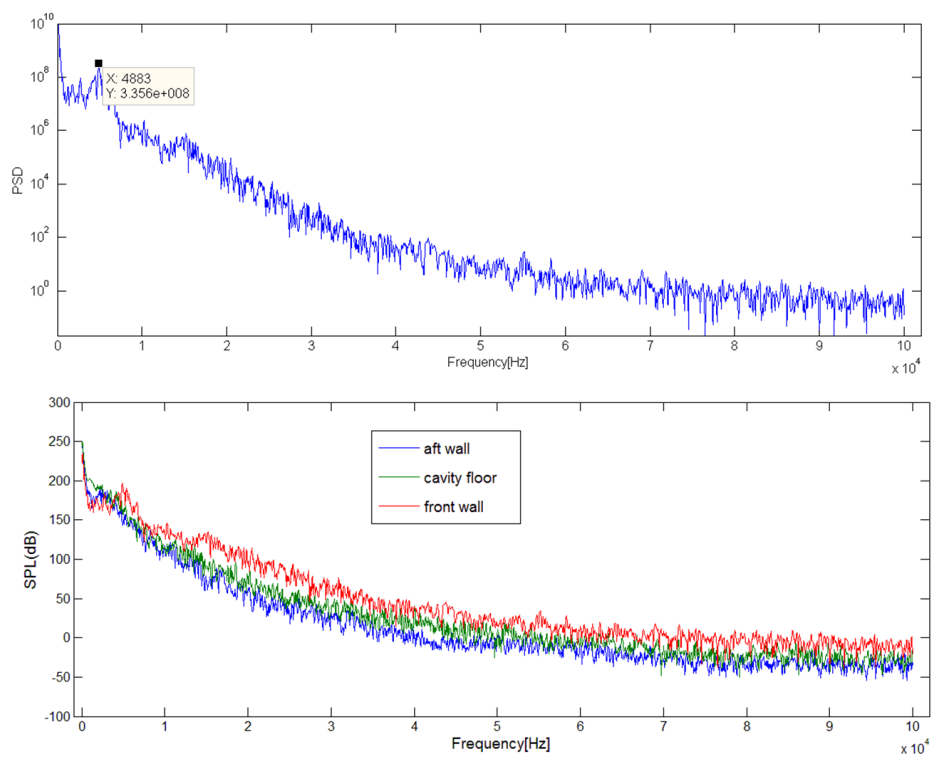 | Figure 2. PSD and SPL along Front Walls and Cavity Floor |
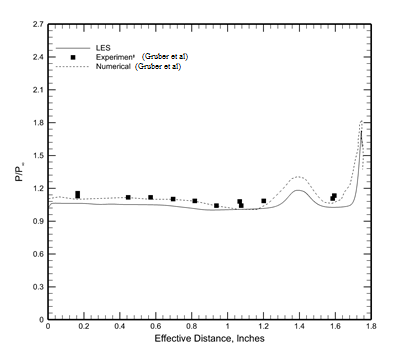 | Figure 3(a). Surface Pressure Distribution |
The pressure profile is compared with the experimental and numerical findings of Gruber et al. [1]. The pressure profile is in good agreement with the experimental measurements. The pressure contours along with the streamlines are shown in the Figure 3 (b). The contours show two recirculation zones inside the cavity, the larger one being nearer to the aft wall. The flow separates and expands near the front wall and compression of flow takes place near the aft wall of the cavity. These two features are also evident from the figure 3 (b). 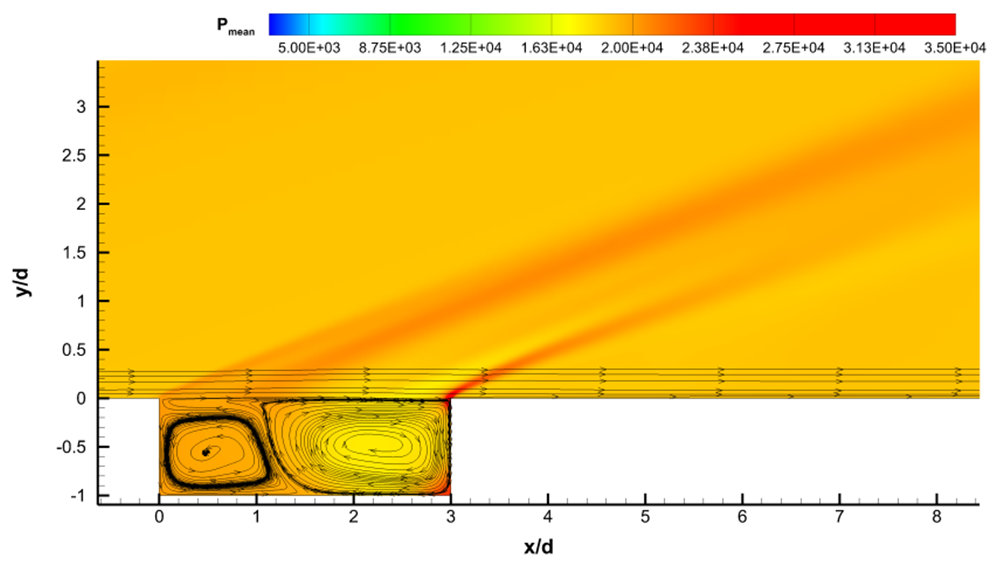 | Figure 3(b). Pressure Contours Along With Streamlines |
The first POD mode (Figure 4) shows vortical structure near the front wall of the cavity. The second mode shows two vortical structures above the cavity and a small structure at the center of cavity. The point above the cavity where these structures are found is free from shear and it is away from any wall. The only time these structures are formed is when the flow first hits the cavity and is ejected violently above it. The third, fourth and fifth modes show the flapping of the shear layer and bending of the flow inside the cavity with small vortical structures inside and outside of cavity. The flapping of the shear layer is understood more clearly in Figure 6. The sixth mode shows a vortical structure in the center of the cavity near the shear layer. The bending of the shear layer is also displayed in the mode.  | Figure 4(a). First POD Mode |
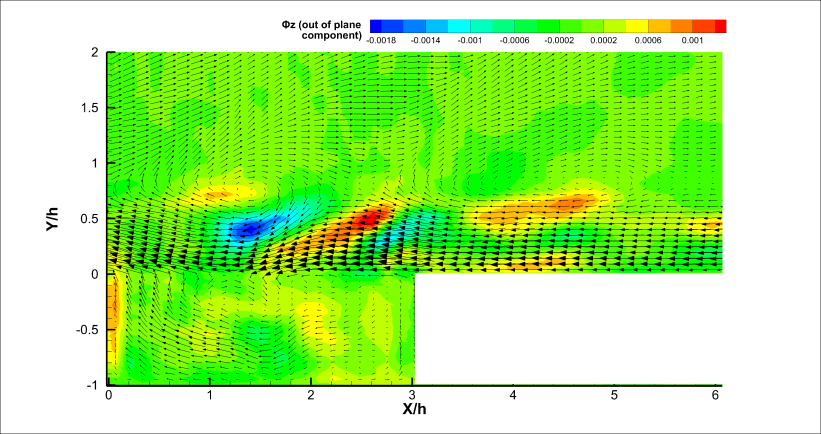 | Figure 4(b). Second POD Mode |
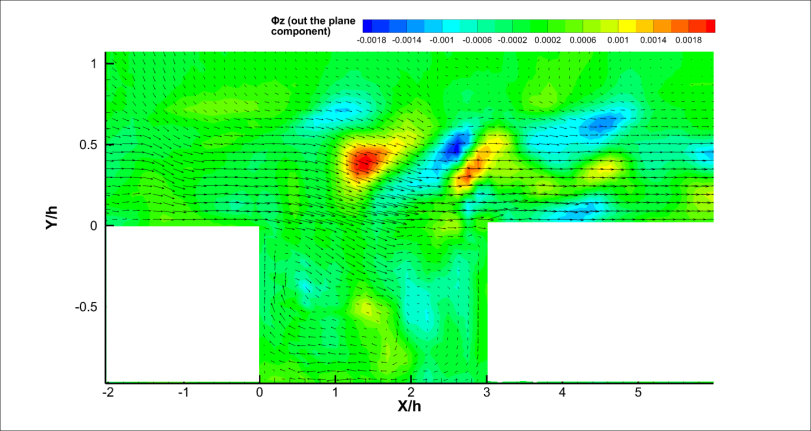 | Figure 4(c). Third POD Mode |
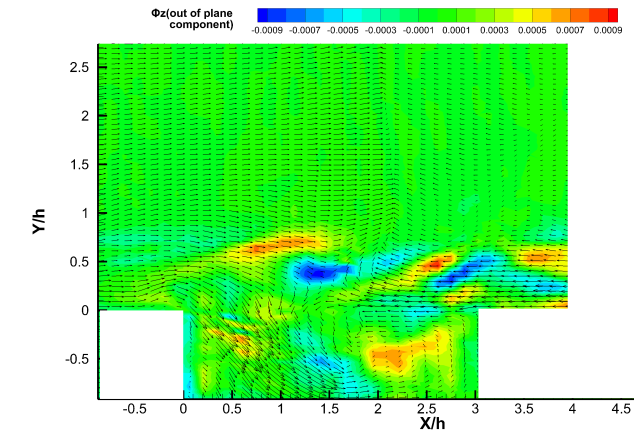 | Figure 4(d). Fourth POD Mode |
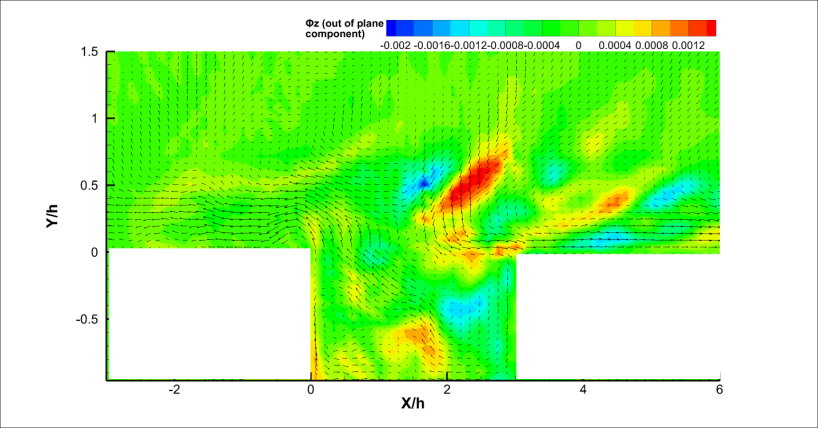 | Figure 4(e). Fifth POD Mode |
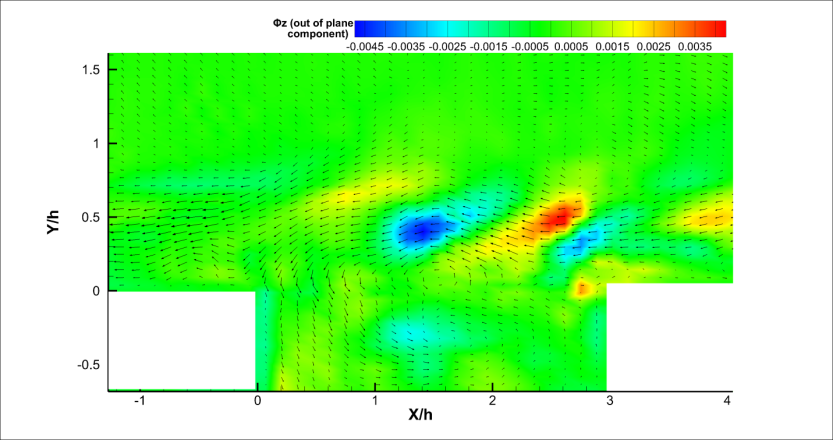 | Figure 4(f). Sixth POD Mode |
The most striking feature of the flow over a rectangular open cavity is the generation of self-sustained oscillations within the cavity. When the pressure in the cavity is lower than the freestream pressure, the shear layer is deflected downwards causing mass and momentum to enter the cavity. This injected mass is then slowed by various dissipative processes within the cavity, thereby increasing the pressure above the freestream value. This in turn caused the shear layer to deflect out of the cavity and to then eject mass into the freestream [14]. The vorticity contours presented in the Figure 6 show the deflection of the shear layer due to the alternate pressure difference between the cavity and the freestream. When the shear layer moves downwards exposing the part of the aft wall, a compression wave is formed due to the impingement of the freestream on the edge of the aft wall. This is responsible for the generation of the acoustic wave at the aft wall. The feedback acoustic wave travelling upstream along with the Mach waves are presented in the Figure 5(a). The acoustic wave travels upstream and upon encountering the front wall generates compression waves at the front wall part of which excites the shear layer and other part is reflected as a downstream travelling wave (Figure 5(b)). This mechanism creates self-sustained oscillations within the cavity. 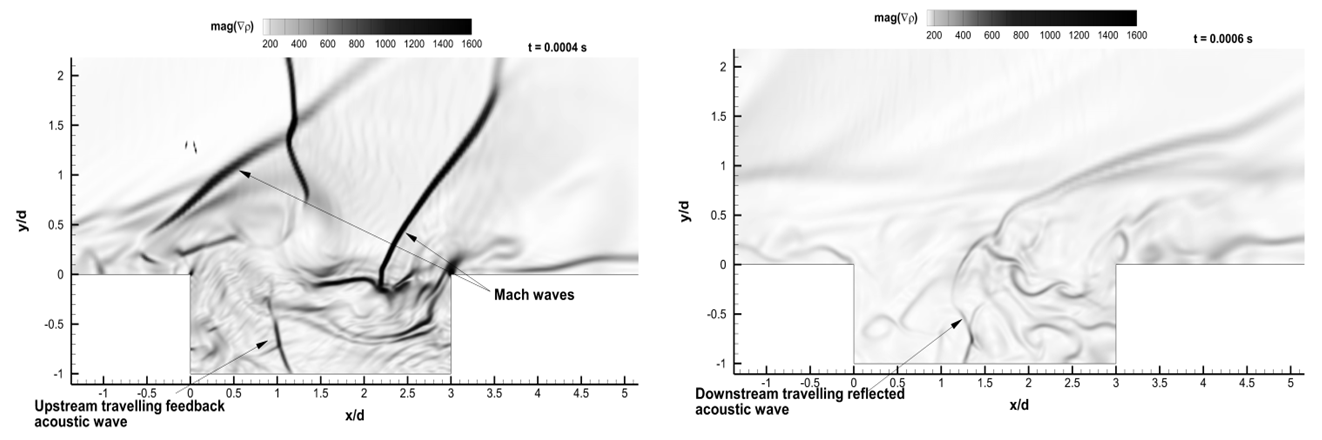 | Figure 5. Contours of Density Gradient Magnitude |
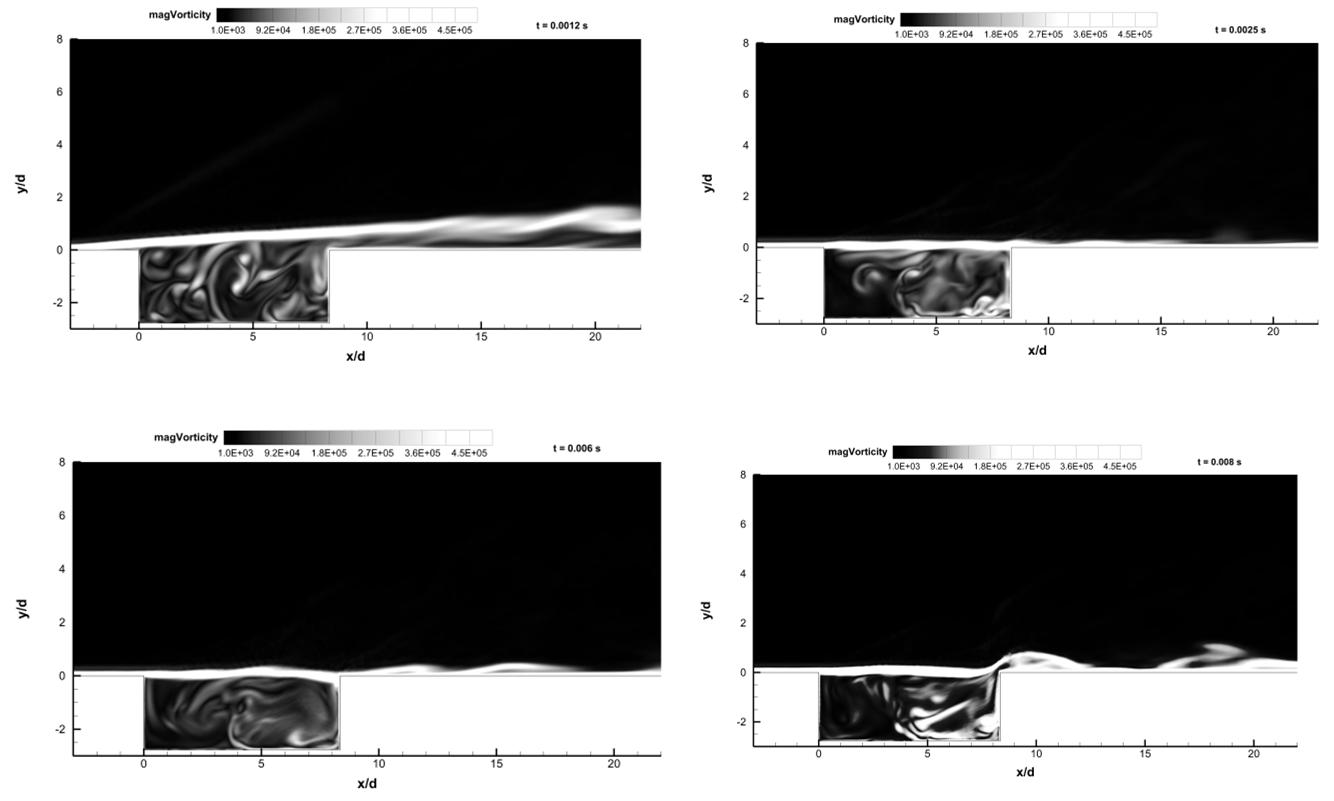 | Figure 6. Contours of Vorticity Magnitude |
Since the coherent structures are always three dimensional in nature, a spanwise analysis is also required for the identification of coherent structures. The POD method satisfactorily captures the structures when visualized in a two dimensional xy plane. But spanwise decomposition does not reveal much about the structures. Iso-surfaces of second invariant of velocity tensor (Q-criterion) are shown to visualize the structures in three dimensional plane. Positive values of Q-criterion colored with instantaneous streamwise velocity are presented in the Figure 7 in order to show the evolution of the structures over the cavity. The streamwise rib vortices along with the roll vortices are seen inside the cavity. The spanwise roll vortices in the shear layer are formed and get piled up due to the Kelvin Helmholtz instability. They evolve downstream to form the hairpin vortices.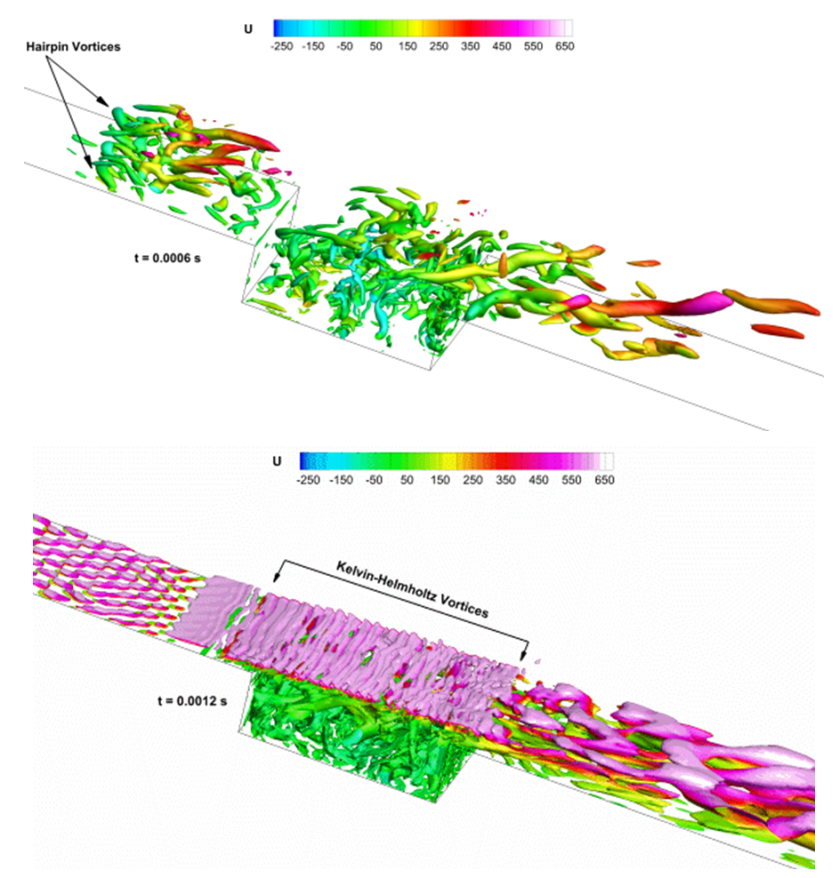 | Figure 7. Iso-Surfaces of Q Colored with Instantaneous Streamwise Velocity |
5. Conclusions
Turbulent supersonic flow over a rectangular open cavity is studied using LES in conjunction with POD analysis to identify the flow structures in the domain. A dynamic Smagorinsky model is invoked for the modelling of the subgrid scales. The surface pressure values along the cavity walls obtained from the simulation are in good agreement with the experimental findings. The dynamic model with the local averaging has resolved the problem of accentuation of the numerical errors with time which is the intrinsic difficulty in simulating the supersonic flow over an open cavity with self-sustained oscillations. The data obtained from the mid plane of the cavity is used to perform the POD analysis to identify the dominant large scale structures. Different POD modes reveal different flow features which are also evident from the contours of pressure and vorticity magnitude. Three dimensional structures have been visualized using the Iso-surfaces of Q. The Mach waves and the acoustic waves are identified using the contours of density gradient magnitude while the contours of vorticity magnitude show the flapping of the shear layer generating acoustic waves within the cavity.
ACKNOWLEDGEMENTS
The authors would like to acknowledge High Performance Computing (HPC) Facility at IIT Kanpur (www.iitk.ac.in/cc).
References
| [1] | Gruber, M. R., and Hsu, K. Y., 2001 “Fundamental Studies of Cavity-Based Flameholder Concepts for Supersonic Combustors.” AIAA Journal, Vol. 17, No. 1, pp. 146–153. |
| [2] | Plentovich E.B., Stallings R.L., Tracy M.B., 1993. "Experimental Cavity Pressure Measurements at subsonic and transonic speeds." NASA Technical Paper 3358. |
| [3] | Krishnamurthy, K., 1955. “Acoustic radiation from Tow-dimensional Rectangular cutouts in Aerodynamic Surface.” Technical Report, Technical Note, 3487. National Advisory Committee for Aeronautics. |
| [4] | Zhang, X., Edward, J. A., 1988, “Computational Analysis of Unsteady Supersonic Cavity Flows Driven by Thick Shear Layers.” Aeronautical Journal, November, pp.365-374. |
| [5] | Rizzetta, D. P., Visbal, M. R., 2003. “Large-eddy simulation of supersonic cavity flow-fields including flow control.” AIAA Journal, 41(8), 1452–1462. |
| [6] | Rossiter, J. E., 1964. “Wind-Tunnel Experiments on the Flow over Rectangular Cavities at Subsonic and Transonic Speeds.” Aeronautical Research Council Reports and Memoranda No. 3438, London. |
| [7] | Christopher, J, G., Henry, G, W., Luca, G., & Reese, J, M., 2010. “Implementation of semi-discrete, non-staggered central schemes in a collocated, polyhedral, finite volume framework, for high-speed viscous flows.” Int. J. Numer. Meth. Fluids, 63, 1–21. |
| [8] | Kurganov, A., Tadmor, E., 2001. "New high-resolution central schemes for nonlinear conservation laws and convection–diffusion equations."J. Comput. Phys 160(1): 241–82. |
| [9] | Moin, P., Squires, K.D., Cabot, W.H., and Lee, S., 1991. “A dynamic subgrid-scale model for compressible turbulence and scalar transport.”Phys. Fluids A, 3, 2746–2757. |
| [10] | Lumley, J. L., 1967. “The structure of inhomogeneous turbulent flows in Atmospheric Turbulence and Radio Wave Propagation.” (A. M. Yaglom and V. I. Tararsky, eds.), (Nauka, Moscow), 166–178. |
| [11] | Sirvoich, L., & Kirby, M., 1987. “Low-dimensional procedure for the characterization of human face.”J Opt Soc Am., 4, 519–524. |
| [12] | Sirovich, L., 1987. “Turbulence and the dynamics of coherent structures. i-coherent structures. ii-symmetries and transformations. iii-dynamics and scaling.” Quarterly of applied mathematics. 45, 561–571. |
| [13] | Arya, N., Soni, R. K., and De, A., 2015 “Identification of coherent structures in a supersonic flow past backward facing step ”AIP Conference Proceedings, 1648, 030037. |
| [14] | Srinivisan, S., Baysal, O., 1991. “Navier-Stokes calculations of transonic flow past Cavities”. Journal of Fluid Engineering, 113, 369–376. |
 Abstract
 Reference
 Full-Text PDF
 Full-text HTML