-
Paper Information
- Next Paper
- Previous Paper
- Paper Submission
-
Journal Information
- About This Journal
- Editorial Board
- Current Issue
- Archive
- Author Guidelines
- Contact Us
American Journal of Environmental Engineering
p-ISSN: 2166-4633 e-ISSN: 2166-465X
2016; 6(4A): 129-134
doi:10.5923/s.ajee.201601.19

Evaluating a MCS Index in Southern Brazil for Two Brief Damaging MCSs
 Abstract
 Reference
 Full-Text PDF
 Full-text HTML
Gustavo Rasera, Vagner Anabor, Franciano Scremin Puhales, Everson Dal Piva
Grupo de Modelagem Atmosférica, Departamento de Física, Universidade Federal de Santa Maria, Santa Maria RS, Brazil
Correspondence to: Vagner Anabor, Grupo de Modelagem Atmosférica, Departamento de Física, Universidade Federal de Santa Maria, Santa Maria RS, Brazil.
| Email: |  |
Copyright © 2016 Scientific & Academic Publishing. All Rights Reserved.
This work is licensed under the Creative Commons Attribution International License (CC BY).
http://creativecommons.org/licenses/by/4.0/

Severe weather events associated with thunderstorms usually are extremely detrimental, damaging infrastructure and causing disorders in urban centers. One of the main causes systems of these events are the Mesoscale Convective Systems (MCS), that given its considerable territorial extension (above 100,000 km²) can cause widespread damage in a wide area. The aim of this study was to evaluate an alternative MCS index, constructed with the MCS South America climatology, and compare with the existing MCS index constructed with the American MCS climatology. Therefore, two MCSs that has generated severe weather in the southern Brazil (Rio Grande do Sul state - RS) and Uruguay were tested with the two indexes. It can be concluded that despite the proposed MCS index did not perfectly overlap the real observed MCSs, this showed a better performance compared with the existing MCS. It well represented the shape and location of the most intense cores of the MCSs and delimited a smaller area of probability of a MCS occurrence, close with respect to the real system observed.
Keywords: MCS Index, Mesoscale Convective Systems, Severe Weather, Rio Grande do Sul, Uruguay
Cite this paper: Gustavo Rasera, Vagner Anabor, Franciano Scremin Puhales, Everson Dal Piva, Evaluating a MCS Index in Southern Brazil for Two Brief Damaging MCSs, American Journal of Environmental Engineering, Vol. 6 No. 4A, 2016, pp. 129-134. doi: 10.5923/s.ajee.201601.19.
Article Outline
1. Introduction
- Mesoscale convective systems are classified as a group of convective clouds that become organized in a single system, with an extensive structure at upper levels, also with cirriform cloud tops and a large area with contiguous precipitation of about 100 km at least in one direction [1].These systems have begun to be studied deeply for the first time by Maddox [2], that analyzed a particular circular shape of these systems occurred in the USA. In South America, the study has initiated by Velasco and Fritsch [3] and has been extensively studied since then.Other characteristic of these systems is that they can assume several shapes ranging from more linear to more circular. This is calculated from the ratio between their two orthogonal axes. The more circular MCSs are classified as Mesoscale Convective Complexes when also satisfy a size criteria for different temperature thresholds and minimum duration of 6 hours [3]. The more elongated MCSs when also satisfy the MCS criteria are classified as Persistent Elongated Convective Systems (PECS) [4].Several methodologies have been used for the temperature threshold to detect MCSs through infrared satellite imagery, but that with -55°C temperature threshold for an minimum area of 100,000 km² presented a good result to detect deep convection in cloud tops observed at about 12 km height [5].The contribution of the precipitation caused by these systems is very important in many areas of the globe, as the easter portion of subtropical South America [6], that has one of the highest incidences of MCSs all over the world [7-9]. Moreover, MCSs are largely associated with generation of severe weather [10-12].Given the importance of such systems, many authors have proposed the use of thermodynamic indexes and construct a composed index of multiple variables to aid the prediction of convective developing and potential for severe weather [13-15] and one special for MCS that occurred in USA proposed by Jirak and Cotton (henceforward referred as Jirak index) [16].Because of this close relationship with severe weather and their great occurrence in subtropical South America, the aim of this study was to test an alternative forecast product for MCS detection, based on the climatology of these systems in this region. For this test were chosen two MCSs cases occurred on October, 2015 in southern Brazil (Rio Grande do Sul state - RS) and Uruguay that caused severe weather.
2. Data and Methodology
- To prepare this study were utilized satellite imagery data from GOES-13, channel 4 thermal infrared, with a spatial resolution of 4km x 4km in its sub-satellite point. These infrared images were fundamental to detect the configuration and the different stages of the MCSs by using the -55°C temperature threshold over an area of at least 100,000 km² and to compare the position of the system with the MCSs indexes tested here. These satellite imagery were obtained from CPTEC/INPE.Also was utilized meteorological station data from INMET and Uruguayan press to obtain values of accumulated rainfall, wind gusts and severe weather reports.Moreover, were utilized analysis and forecast (only for 3 hours later) data from Global Forecast System (GFS) [17] with spatial resolution of 0.25° x 0.25° to calculate the new proposed MCS index (explained in details in a forthcoming paper) for the different stages for the two MCSs.Also was calculated the MCS Index obtained from the MCSs climatology in the USA by Jirak and Cotton [16] to compare with the alternative MCS index proposed here.The two MCS indexes are composed by some representative variables observed in the earlier environment of the MCS configuration. It considers the average and the standard deviation for these variables, making the indexes dimensionless. The greater the value of it, the greater the possibility to configure a MCS in subsequent hours. These two indexes were calibrated specifically to differentiate environments that produce non-organized convective systems to those that configured a future MCS. In the proposed MCS Index the main changes were the adding of the vertical velocity variable, a lowering in the level of the temperature advection term and a deeper layer of vertical wind shear used.
3. Results and Discussions
- The first MCS (15th October, 2015) reached more than 125,000 km² and passed across RS, causing severe weather reports over 27 cities in RS, like hail, heavy rainfall (until 93 mm in 10 hours) and intense winds (above 25 m.s-1). This system lasted only four hours since it reached their minimum size criteria until diminish and merged with other MCS. This case was chosen due its complexity of the forecast, once it had a brief life cycle and an interaction with another MCS onto the rear of it. The infrared satellite image in the initiation stage of the MCS can be observed in Figure 1c. The MCS center is located over northeastern portion of RS (30°S, 50°W).The performance of the two indexes can be visualized comparing the Figure 1a (Jirak index) and Figure 1b (new proposed index) with the satellite image for 2 hours and 30 minutes later. It can be seen that the two indexes indicated high probability of MCS occurrence over the northeastern RS, but the former index had a more scattered pattern than the latter. Moreover, the Jirak index pointed a very intense false alarm over the central Paraguay (24°S, 58°W) while the new proposed index indicated only low probability of development of a MCS in the later hours in this region. Over the northeastern Argentina, where a convective region can be observed in Figure 1c, the two indexes did not match very well, however the proposed index was more intense in the vicinities than the other.
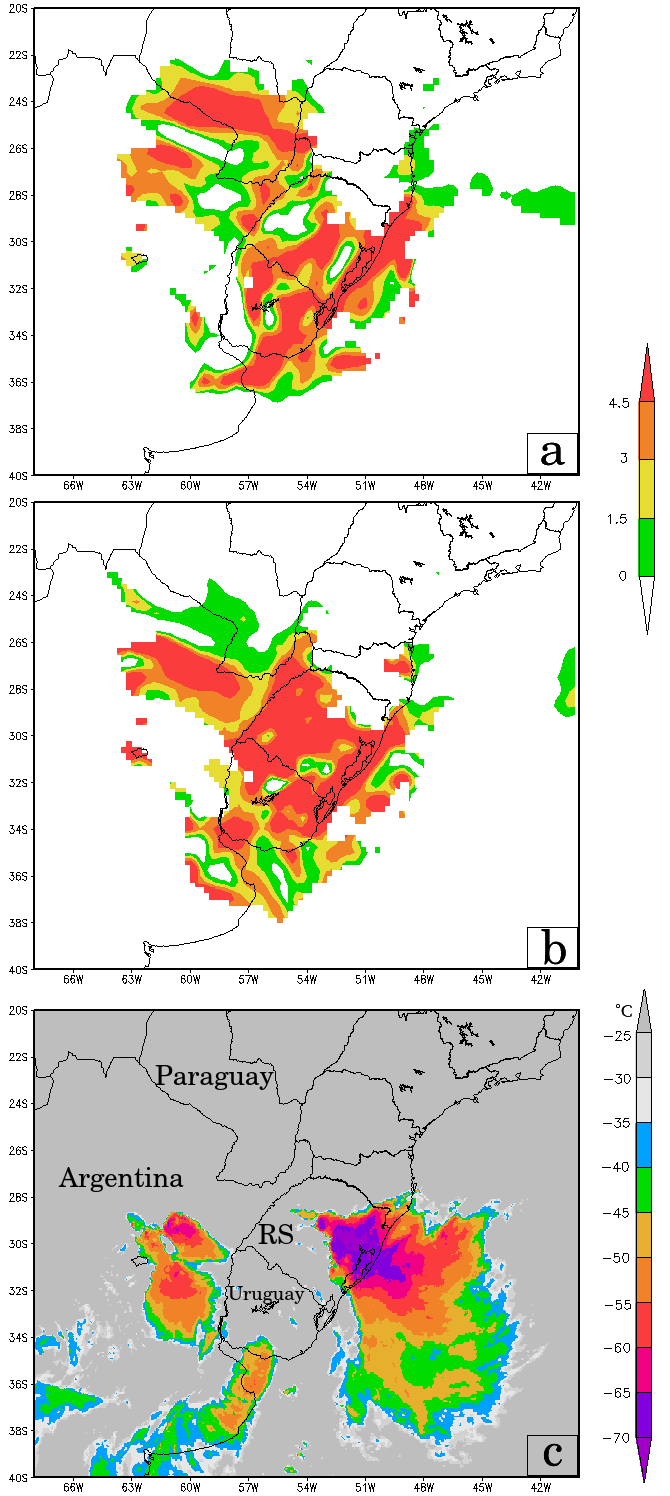 | Figure 1. (a) MCS Index (Jirak et al., 2007) 2:30 hours earlier than the initiation stage; (b) alternative MCS Index 2:30 hours earlier than the initiation stage; (c) MCS occurred at 14th October 2015 at the initiation stage |
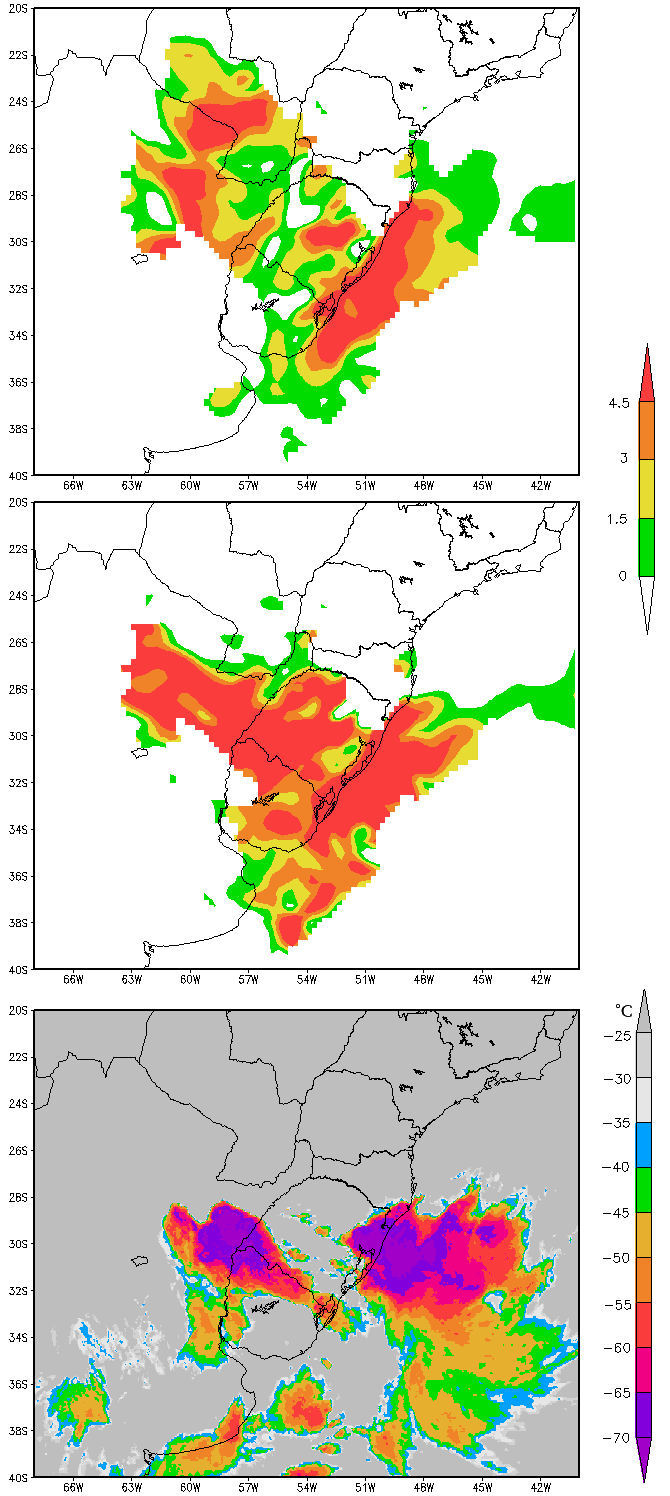 | Figure 2. (a) MCS Index (Jirak et al., 2007) 0:30 hours earlier than the initiation stage; (b) alternative MCS Index 0:30 hours earlier than the initiation stage; (c) MCS occurred at 14th October 2015 at the maturation stage (maximum size) |
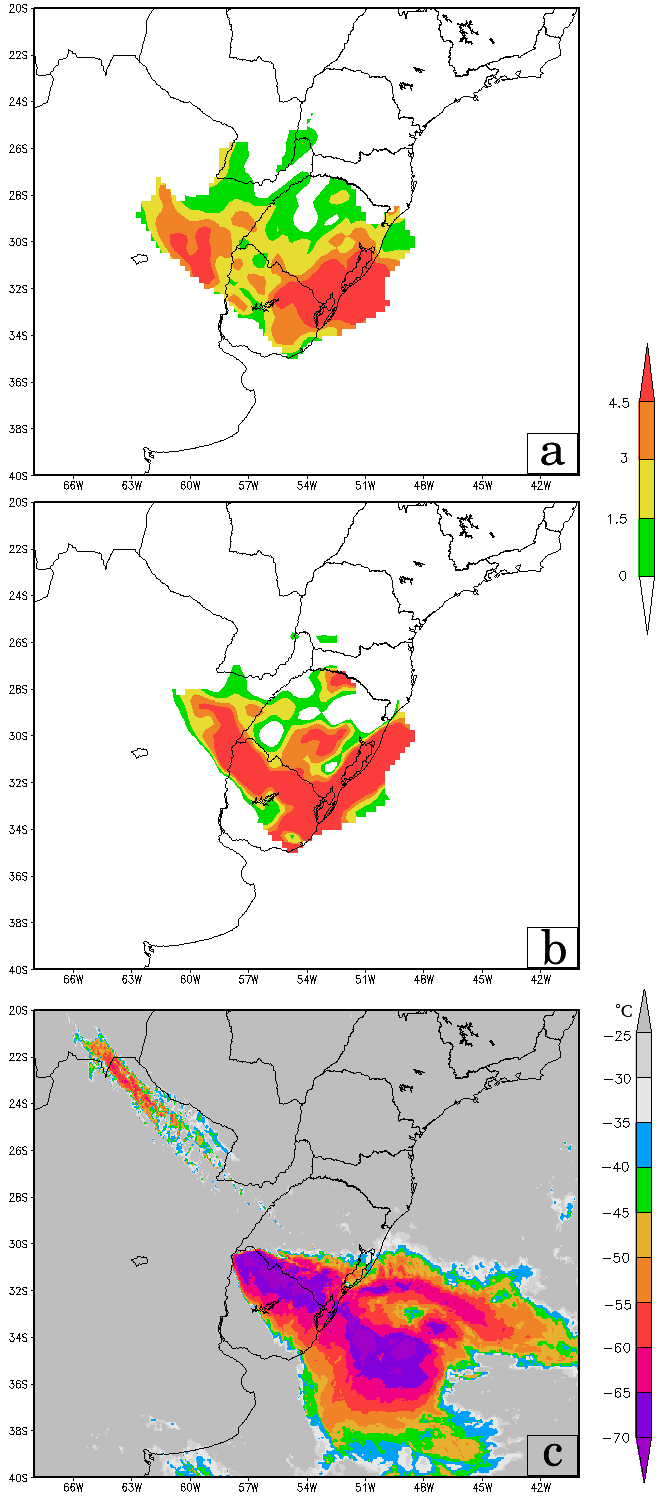
 | Figure 3. (a) MCS Index (Jirak et al., 2007) 0:30 hours earlier than the initiation stage; (b) alternative MCS Index 0:30 hours earlier than the initiation stage; (c) MCS occurred at 14th October 2015 at the dissipation stage |
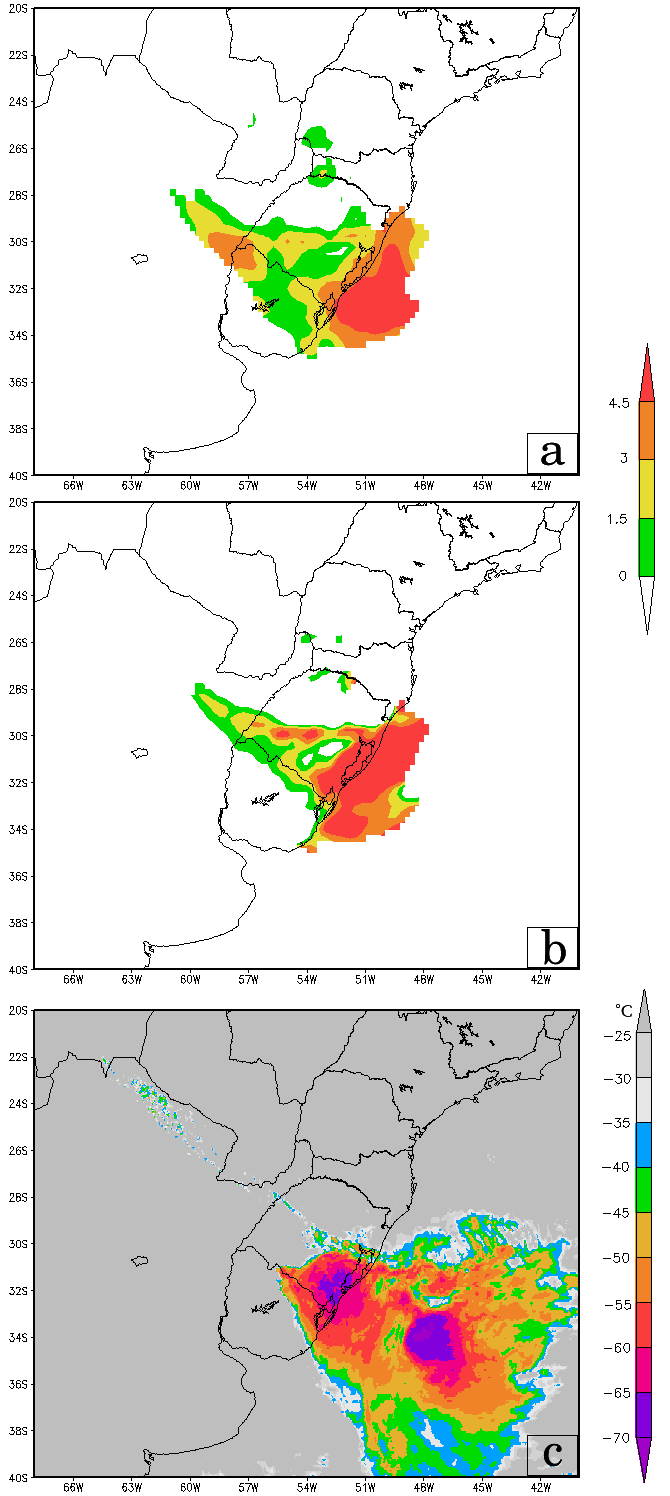
 | Figure 4. (a) MCS Index (Jirak et al., 2007) 1:00 hours earlier than the initiation stage; (b) alternative MCS Index 1:00 hours earlier than the initiation stage; (c) MCS occurred at 20th October 2015 at the initiation stage |
 | Figure 5. (a) MCS Index (Jirak et al., 2007) 2:30 hours earlier than the initiation stage; (b) alternative MCS Index 2:30 hours earlier than the initiation stage; (c) MCS occurred at 20th October 2015 at the maturation stage |
 | Figure 6. (a) MCS Index (Jirak et al., 2007) 2:30 hours earlier than the initiation stage; (b) alternative MCS Index 2:30 hours earlier than the initiation stage; (c) MCS occurred at 20th October 2015 at the dissipation stage |
4. Conclusions
- This study discusses a possible operational use of an alternative MCS index developed with the MCS climatology of this region, showing a better performance compared with the existing MCS index, developed with the MCS cases over USA. This shows that for South America MCSs the temperature advection is more important in lower levels than the Americans MCSs, as well as a deeper shear wind layer and the inclusion of the vertical velocity parameter. The maximum values region of predictability resembled well with the shape of the convective cored of the MCSs observed hours later. The pointed region demarcated by the proposed MCS index was also smaller than the other index, facilitating the monitoring of possible MCS in subsequent hours.This region of the globe have a high frequency of MCSs, and this new tool can improve the prediction of these systems, helping the centers of forecasting and decision makers to mitigate damage generated by SCMs.
ACKNOWLEDGEMENTS
- The authors wish to acknowledge CAPES for the studentship, CPTEC/INPE by grant the satellite imagery and the Meteorology Graduate Program at Universidade Federal de Santa Maria (PPGMet/UFSM) for giving the necessary infrastructure for the development of the study.