-
Paper Information
- Next Paper
- Previous Paper
- Paper Submission
-
Journal Information
- About This Journal
- Editorial Board
- Current Issue
- Archive
- Author Guidelines
- Contact Us
American Journal of Environmental Engineering
p-ISSN: 2166-4633 e-ISSN: 2166-465X
2016; 6(4A): 74-77
doi:10.5923/s.ajee.201601.11

Using KDE to Obtain a Probabilistic QPF from an EPS
Lissette Guzmán Rodríguez, Vagner Anabor, Franciano Scremin Puhales, Everson Dal Piva
Grupo de Modelagem Atmosférica, Departamento de Física-Universidade Federal de Santa Maria, Santa Maria, RS, Brasil
Correspondence to: Vagner Anabor, Grupo de Modelagem Atmosférica, Departamento de Física-Universidade Federal de Santa Maria, Santa Maria, RS, Brasil.
| Email: |  |
Copyright © 2016 Scientific & Academic Publishing. All Rights Reserved.
This work is licensed under the Creative Commons Attribution International License (CC BY).
http://creativecommons.org/licenses/by/4.0/

In this paper was used kernel density estimation (KDE), a nonparametric method to estimate the probability density function of a random variable, to obtain a probabilistic quantitative precipitation forecast (QPF) from an ensemble prediction of the WRF model, for a case study. The nine members of the ensemble prediction system (EPSm) were obtained by varying only the convective parameterization of the model. The case study corresponded to a heavy precipitation event in Southern Brazil. Evaluating the results, estimated probabilities obtained for a 24 hours period, and various thresholds of precipitation, were compared with the observations of ANA (Agência Nacional de Águas, Brasil) stations, finding better coherence between the observations and the predicted probabilities for the lower amounts of precipitation. Some skill scores were calculated for the KDE product (for different ranks of probability), all the EPSm and for the the ensemble mean precipitation product (MPP). Even though KDE forecasts with >75% of probability had better FAR and B than the EPSm and MPP forecasts, according to the values of PC and PS, KDE forecast for this category was not superior to the others. However, KDE forecats with probability of >25% and >50% had the bests values of PC, FAR, B and PSS for almost every threshold, except for the haevy rainfall (>50mm/24h), that was in general the worst foracasted by the KDE and also by the EPSm.
Keywords: EPS, KDE, Probabilistic QPF
Cite this paper: Lissette Guzmán Rodríguez, Vagner Anabor, Franciano Scremin Puhales, Everson Dal Piva, Using KDE to Obtain a Probabilistic QPF from an EPS, American Journal of Environmental Engineering, Vol. 6 No. 4A, 2016, pp. 74-77. doi: 10.5923/s.ajee.201601.11.
Article Outline
1. Introduction
- Quantitative Precipitation Forecast (QPF) is one of the most significant challenges of weather forecast, due to the large impact of this variable in the development of human activities. Although many aspects of Numerical Weather Prediction (NWP) have made great progress in recent decades, the QPF still sensitive to the uncertainties in the forecasts (mainly produced by initialization errors and inaccuracies of approaches and parameterizations used in the models). Those uncertainties can be reduced or quantified by using EPS, in which, instead of running the model once (to make a deterministic forecast), the model runs several times from different initial conditions and/or physical parameterizations (multi-physics EPS), or different models are used within the EPS (multi-model EPS).The range of different solutions (or ensemble members, EPSm) provides an objective measure of the forecast uncertainty and allows us to evaluate how confident we should be in a deterministic forecast [1]. According to [2], a EPS is designed to obtain the probability density function (PDF) of the prediction, so that the outputs of the EPS can be better used in obtaining probabilistic forecasts, to assess the possibility of occurrence of certain events.The classical statistical approach to achieve this goal, relies heavily on parametric models or assumptions on the distribution of the data, which completely fix the distribution of this except for the value of one or more parameters to be estimated. Although, there are many practical situations where a simple exploratory data analysis shows that the assumption of normality is inadequate, as in the case of precipitation.To overcome these deficiencies, non-parametric estimators have been developed, as is the case of kernel estimators, whose original idea goes back to the work of [3] and [4]. Kernel density estimation (KDE), also known as kernel smoothing, is a simple way to find structures in data without the restrictions imposed by a parametric model. In recent years several applications of this technique has been registered in meteorology [5], [2], [6] showing KDE advantages over other classical methods, such as the use of histograms or adjustments to PDFs.Southern Brazil does not have a well-defined rainy season and events of heavy rainfall occur well distributed over the year [9], mainly associated with cold fronts [11] and mesoscale convective systems [10]. In front of this reality it is important to have a forecast that allow us to assess the possibility of occurrence of these events. In order to achieve that goal, the objective of this paper was to explore the performance of KDE in obtaining probabilistic precipitation forecasts from an EPS, for a case of study.
2. The Ensemble Prediction System
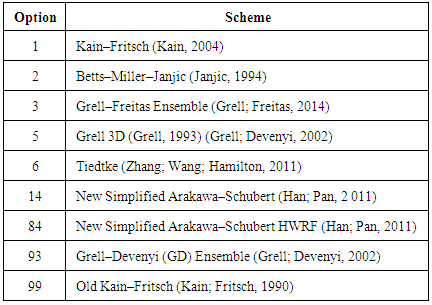
- In this study was used a multi-physics EPS integrated by 9 member, only diferenciated by their convective parametrization schemes. The integrations were made with the Weather Research and Forecasting (WRF, V3.6). Two nested domains of 24 and 12 km of resolution, 27 vertical levels and lambert projection, were created over part of South America (Figure 1). Initial and boundary conditions of 1º resolution were from NCEP FNL.
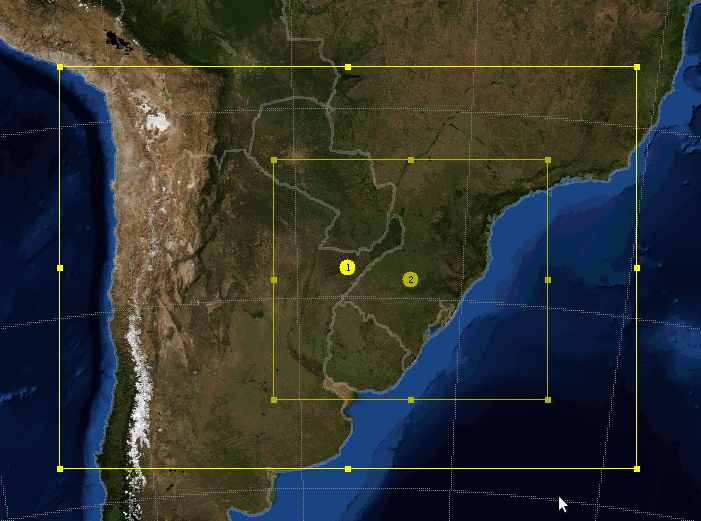 | Figure 1. Two nested domains used for simulation: domain 1 (16-38 S, 37-76 W) and domain 2 (22-35 S, 44-61 W) |
|
3. Kernel Density Estimate
- Acording to [7] for a bivariate random sample X1, X2,…,.Xn drawn from a density f, the kernel density estimate is defined by:
 | (1) |
 . Here was used KDE in two dimensions with a normal kernel K(x)=(2π)-1exp(-(1/2)xTx), a sphere pre-transformation of the data and minimizing SAMSE error for the selection of optimal H, recommended by [8].
4. Methodology
- Kernel density estimation (KDE) was used to obtain the probability density function for different thresholds of precipitation, from the simulations made with an EPS, in order to generate probabilistic QPF (it was only considered the domain 1).The precipitation amounts obtained from the 9 WRF simulations or EPSm, were considered as a unique data set. It means that to every one of the 136x118 grid points corresponded 9 forecasted values. KDE was estimated for a 24 hours period (from 21 to 45h of simulation), considering the criteria of exceeding of thresholds of precipitation (in 24 hours) of 1mm, 10mm, 25mm, and 50mm. The evaluation of the results obtained with KDE was made against the observation of 608 ANA stations. There were only considered the grid points coincident with ANA stations. Four ranks of probabilities (>1%, >25%, >50%, >75%) were independently analized. Some skill scores of the forecast, such as proportion correct (PC), false alarm ratio (FAR), bias (B) and Pierce Skill Score (PSS), were calculated through the used of contingency tables [6]. The performance of every EPSm, as well as the ensemble mean precipitation product (MPP) were also evaluated following the same methodology, and compared with the KDE product.
5. Results and Discussion
- The probabilities of precipitation obtained with KDE for ranks of 1, 10, 25 and 50mm/24h, are shown in Figure 2. Probability contours of 25%, 50% and 75% appears in yellow, orange and red. The blue points represent the ANA stations where the threshold of precipitation was observed, and the grey ones where it was not observed. In general, for all the thresholds of precipitation analized there was a morphological correspondance between the areas with probabilities >25% and the stations where that amount of precipitation was observed, which shows the fair performance of both the simulations and the KDE results. This correspondence is better for lower thresholds. For higher values of precipitation, some of the stations with observations, stay out of the zones with the higher probabilities. It could be explained by the defiencience of NWP in quantification and localization of heavy rainfall.
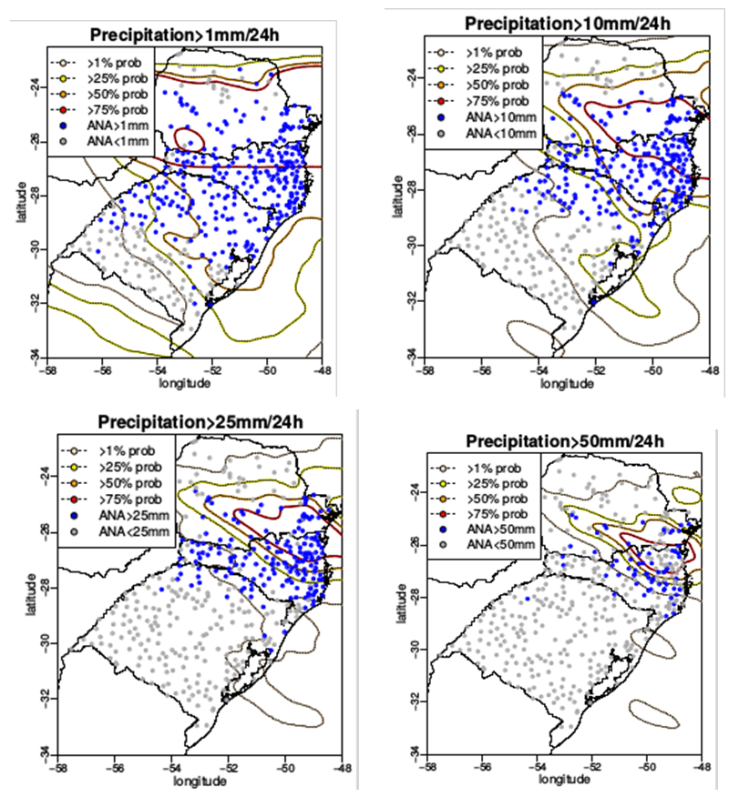 | Figure 2. Probablity of 24hours-precipitation obtained with KDE from 22-09-2013-09Z to 23-09-2013-09Z |
5.1. Comparing KDE with EPSm and MPP
- The KDE forecasts with of >25% and >50% of probability had better PC than all the EPSm and the MPP of all the thresholds, except for 50mm with >50% of probabilities. With a high probablility (>75%), the PC of 50mm of precipitation is the only showing improvement over the lower probabilities. Between the EPSm, m14 (New Simplified Arakawa–Schubert by Han and Pan, 2011) had the best values. The extreme values of precipitation (1mm and 50 mm) obtain the best values of PC (Figure 3).
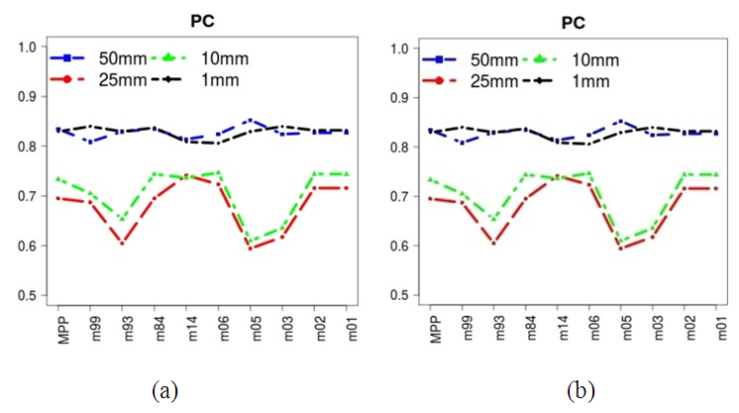 | Figure 3. Proportion correct of KDE probabilities (a) and MPP/EPSm (b) |
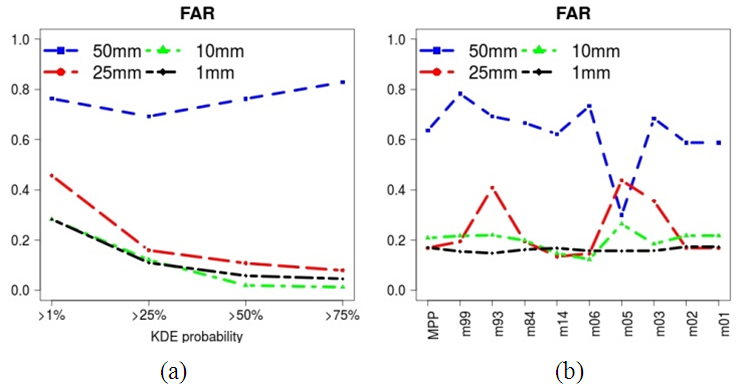 | Figure 4. False alarm ratio of KDE probabilities (a) and MPP/EPSm (b) |
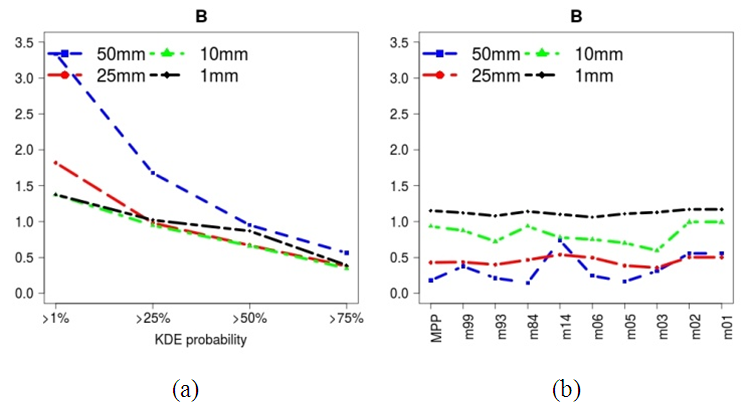 | Figure 5. Bias of KDE probabilities (a) and MPP/EPSm (b) |
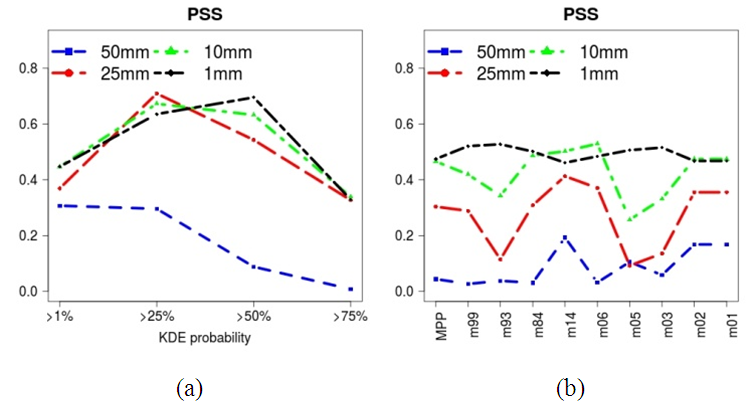 | Figure 6. Pierce Skill Score of KDE probabilities (a) and MPP/EPSm (b) |
6. Conclusions
- A probabilistic QPF was obtained through the use of KDE aplicated to numerical simulation from an EPS inregrated by 9 members with different convective parametrization schemes. In the study of a case of heavy rainfall in southern Brazil, thresholds of precipitation of 1, 10, 25 and 50 mm in 24 hours, were analized. Comparing the KDE product, the ensemble members and the MPP with ANA observations, several advantages of the KDE were observed. KDE forecast with >25% and >50% of probabilities had better proportion correct than all the EPS members and than the MPP. Although when precipitation of >50mm/24h obtained the worst PC, with >25% of probability, KDE forecast is better than the EPSm forecast. KDE with >50% of probability, forecasted all the threshold almost unbiased, showing improvements over the MPP and the EPSm forecasts.
ACKNOWLEDGEMENTS
- CAPES; PPGMet-UFSM
 Abstract
 Reference
 Full-Text PDF
 Full-text HTML