American Journal of Environmental Engineering

p-ISSN: 2166-4633    e-ISSN: 2166-465X

2016;  6(4A): 66-73

doi:10.5923/s.ajee.201601.10


Evolution and Synoptic Environment of the 4 July 2014 Supercells in Southern Brazil

Maurício I. Oliveira, Eliton L. Figueiredo, Vanessa Ferreira, Murilo M. Lopes, Ernani L. Nascimento

Grupo de Modelagem Atmosferica, Universidade Federal de Santa Maria, Santa Maria, Brazil

Correspondence to: Ernani L. Nascimento, Grupo de Modelagem Atmosferica, Universidade Federal de Santa Maria, Santa Maria, Brazil.

Email:

Copyright © 2016 Scientific & Academic Publishing. All Rights Reserved.

This work is licensed under the Creative Commons Attribution International License (CC BY).
http://creativecommons.org/licenses/by/4.0/

Abstract

An analysis of severe convective storms that occurred in the evening of 4 July 2014 in extreme southern Brazil is presented. Doppler radar data showed that a few storms displayed supercell characteristics, such as motion to the left of the mean wind, weak echo region in the reflectivity field, and cyclonic rotation. The severe storms evolved in conditionally unstable air mass with above-normal moisture content considering wintertime conditions. The general synoptic environment consisted of a 500-hPa migratory trough crossing the Andes and associated upper-level jet stream, promoting intense deep-layer vertical wind shear over southern Brazil. At the surface, a deepening inverted trough was observed over the La Plata Basin. This feature became the focus for convective initiation and played a role in strengthening the low-level northwesterly flow, characterizing a low level jet stream that extended over southern Brazil. In such environment storms rapidly became severe given the combination of moderate conditional instability and strong directional wind shear at low levels.

Keywords: Severe convective storms, Supercells, Damaging winds, Natural hazards, Southern Brazil

Cite this paper: Maurício I. Oliveira, Eliton L. Figueiredo, Vanessa Ferreira, Murilo M. Lopes, Ernani L. Nascimento, Evolution and Synoptic Environment of the 4 July 2014 Supercells in Southern Brazil, American Journal of Environmental Engineering, Vol. 6 No. 4A, 2016, pp. 66-73. doi: 10.5923/s.ajee.201601.10.

1. Introduction

A severe convective storm is defined as one that produces large hail, and/or damaging straight-line winds, and/or tornadoes [1]. A special class of severe convective storm, the supercell, is characterized by displaying a persistent, deep, rotating updraft (i.e., a mesocyclone; [2]) and is capable of producing a myriad of severe weather hazards ([3], [4]).
Several studies have shown that the subtropics of South America, east of the Andes mountain range, host some of the most intense convective storms worldwide (e.g. [5], [6], [7], [8]), including supercell storms [9].
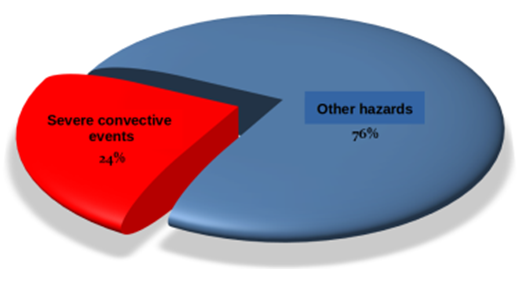
To illustrate the social and economic impact of severe local storms in southern Brazil, Figure 1 shows statistics of hazard reports compiled by the Secretaries of Civil Defense of Rio Grande do Sul (hereafter referred to as RS) and Santa Catarina states in southern Brazil for the period between 2003 and 2011. Considering only report of hazards associated with the occurrence of large hail and damaging winds, nearly one-quarter of the events was related to severe storms, which is a substantial figure. Despite that, only a few studies address the detailed evolution of severe storms and their atmospheric environment in Brazil (e.g., [10] [9]).
Figure 1. Percentage number of hazard reports associated with the occurrence of severe local storms (red) compared to reports related to other causes (blue). Data source: Civil Defense systems from Rio Grande do Sul and Santa Catarina states in southern Brazil. (http://www2.defesacivil.rs ; www.defesacivil.sc.gov.br/; updated in January 2016)
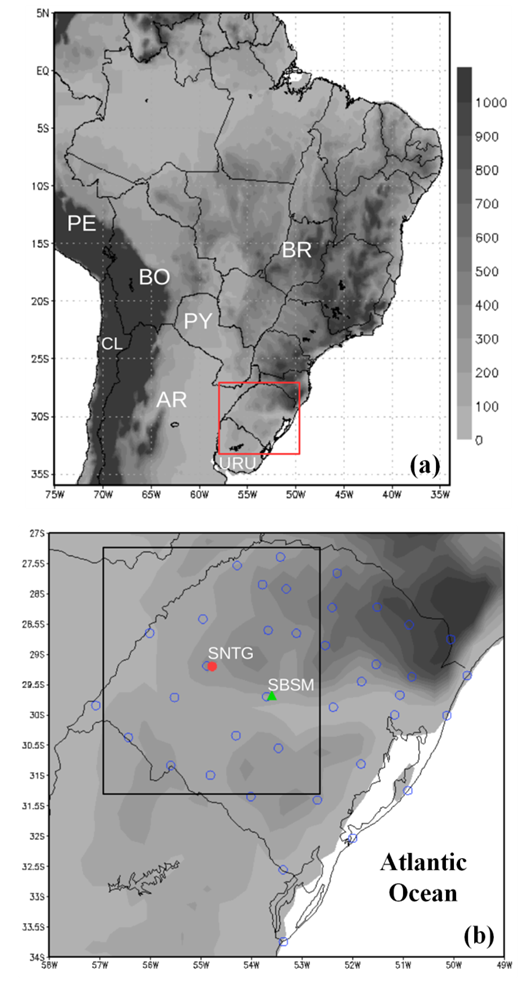
This study aimed at documenting the behavior of severe convective storms, a few of which displaying supercellular characteristics, that occurred from the late afternoon to the night of 4 July 2014 in western and southwestern RS state, in southern Brazil (Figure 2). Information from Doppler radar was used to that end. The large- and meso-scale meteorological conditions that conditioned the development of the severe convection were also investigated.

2. Data and Methodology

Different data sources were utilized in the analysis of the convective cells and of the atmospheric environment in which they developed. Hourly data from automated weather stations (AWS) from the Brazil´s National Meteorological Institute (INMET; acronym in portuguese) were employed to characterize the evolution of surface atmospheric conditions in RS state around the time of the strongest convective cells. On a larger scale, SYNOP observations over the La Plata Basin were also analyzed. The vertical atmospheric profile observed at 00:00Z 5 July 2014 (9 PM 4 July 2014 in local standard time (LST)) was investigated using upper air data from the operational sounding from Santa Maria Air Force Base (SBSM), located in central RS (Figure 2b). The profile was not contaminated by the ongoing convection in RS and, thus, the sounding sampled the general characteristics of the air mass in which the storms evolved, satisfying criteria established by [5] for a proximity sounding.
Figure 2. (a) Map of Brazil (BR) in the South American continent illustrating the geographical position of Rio Grande do Sul (RS) state with a red box. (b) Close up view of RS indicating the location of Santiago´s S-band Doppler radar (SNTG; red closed circle) and of the sounding site at Santa Maria Air Force Base (SBSM; green triangle); the blue open circles depict INMET´s operational network of surface AWS in RS. The black box in (b) shows, approximately, the surveillance region of SNTG radar in short pulse mode. Gray shading indicates surface elevation in meters in both panels
To describe the evolution of the convective cells, an analysis was conducted of the base reflectivity and (de-aliased) radial velocity fields from the operational S-band (10-cm wavelength) single-polarization Doppler radar located in Santiago (SNTG) in mid-western RS (29°13′30′′S; 54°55′48′′W; elevation: 434 m; Figure 2b). SNTG radar is operated by the Department of Airspace Control (DECEA; acronym in portuguese) of the Brazilian Air Force, has a beam-width of approximately 2°, and, in short pulse mode, operates with a range and pulse repetition frequency of 250 km and 600 Hz, respectively [11]. In volume scan mode, SNTG radar performs a complete set of plan position indicators (PPIs) at 15 elevations at 10 min intervals. PPIs of base reflectivity and radial velocities were inspected for distinct elevations but only the 0.5° PPIs are shown in the figures. Post-processing of the raw radar data was performed using PyART [12]. Water vapor, thermal infrared and visible imagery from the Geostationary Environmental Operational Satellite-13 (GOES-13) were also utilized in the analysis the large scale atmospheric circulation.
Finally, the large-scale atmospheric environment conducive to the severe weather event was assessed by six-hourly analysis fields from the National Centers for Environmental Prediction (NCEP) Climate Forecast System Version 2 (CFSv2) [13] valid at 00:00Z. CFSv2 data have 0.5° horizontal grid spacing and 37 vertical levels from the surface to 1 hPa. These data are freely distributed at:
http://nomads.ncdc.noaa.gov/modeldata/cfsv2_analysis_pgbh/.

3. Results

3.1. Radar Data Analysis of Storm Evolution

Convective initiation was observed as early as 15:00Z 4 July 2014 over extreme northeastern Argentina with storms displaying prevailing motion to the southeast, as inferred by the (few) GOES-13 thermal-infrared and visible images available for that day (not shown). By 18:00Z storms had already crossed the Brazil-Argentina border into far western RS. (Deep convection also developed over eastern sections of RS during the afternoon hours, but the convective cells associated with most significant severe weather reports were the ones in western and southwestern RS).
From mid to late afternoon, scattered convective storms embedded in a northwesterly synoptic flow passed tens of km southwest of SNTG radar. Figure 3 shows a time sequence PPIs for 0.5° elevation scans for base reflectivity from SNTG radar from 19:20Z to 22:50Z at 30-min intervals, as the storms passed to the southwest, south and southeast of the radar site. During this period, three cells became particularly strong and displayed motion to the left of the mean wind. These convective cells are tracked and labeled in Figure 3.
Figure 3. Time sequence of PPIs for base reflectivity (dBZ) at 0.5° antenna elevation from SNTG radar for the 250 km (short pulse) volume scan mode, at 30 min intervals starting at 19:20Z (panel (a)). The reflectivity scale (in dBZ) is indicated by the vertical color bar in panel (a) and is valid for all panels. The location of SNTG radar is depicted by a red circle, and three severe convective storms are tracked and numbered. See text for details. (Data source: DECEA and DSA-INPE)
The first echoes of storm 1 appeared in SNTG´s 250 km scan around 17:00Z (not shown). This cell displayed motion to the southeast until approximately 20:00Z, when it started to deviate to the left of the mean flow, merging with other weaker cells and experiencing a growth in the 40 dBZ area. A rapid intensification in reflectivity was observed with this cell, reaching values higher than 65 dBZ and indicating the presence of a (potentially) severe storm (Figures 3a-b-c). From 20:50Z to 22:50Z (Figures 3d-e-f-g-h) this cell underwent stages of weakening and strengthening, but always keeping a coherent 50 dBZ reflectivity core and a general tendency to move to the east of the synoptic flow.
A closer look in storm 1 at 20:20Z shows a weak echo region (WER) in the reflectivity in the rear-left flank of the storm (Figure 4a). Concomitantly, the Doppler velocity field indicates, on the WER, a couplet of inbound and outbound velocities (Figure 4b). The superposition of a WER and such (Southern Hemisphere) cyclonic couplet strongly suggests the presence of an intense rotating updraft in storm 1 [14].
Figure 4. Close-up view of the PPI for the 0.5° elevation scan from SNTG radar at 20:20Z for storm 1: (a) base reflectivity (dBZ); (b) radial velocity (; green and purple: inbound; red: outbound). The black arrow in (b) highlights the velocity couplet. (Data source: DECEA and DSA-INPE)
Because the dipole in the radial velocity persisted with this cell in subsequent scans until 22:40Z (not shown), this feature was, most likely, a mesocyclone, even though it was not verified whether such velocity couplet satisfied a typical mesocyclone-detection algorithm [15]. These findings, combined with the observation that the motion of storm 1 deviated to the left of the mean wind, indicated that this storm displayed supercellular characteristics.
Storm 2 initiated to the west of storm 1 later in the evening (Figure 3f). Between the 21:50Z and 22:10Z scans storm 2 underwent a splitting and attained a deviation to the left of the mean wind (i.e., the label “2” was assigned to the left mover after the splitting). This storm also experienced a sharp intensification in the reflectivity field, as confirmed by the 22:20Z scan shown in Figure 3g. In this same scan there was an indication of a velocity couplet (not shown), but not as evident and persistent as the one accompanying storm 1. By 22:50Z storm 2 had already merged with other cells and experienced quick dissipation. Thus, despite showing some supercellular behavior, this convective cell did not become long-lived.
A third storm (cell number 3 in Figure 3) displayed fast development to the northeast of storm 2 (Figures 3g-h) and produced damaging winds in the town of Rosário do Sul by the time of the 22:50Z scan shown in Figure 3h. Base reflectivity on the 0.5° scan (Figure h) indicated a core around 60 dBz. There is a hint of a short-lived velocity couplet with this cell at 22:50Z but, again, not as evident as the one documented for storm 1. From all three cells, storm 1 was the one that displayed the clearest supercell behavior.
It is shown below that the atmospheric environment observed over RS was supportive of rotating storms.

3.2. Synoptic and Mesoscale Environments

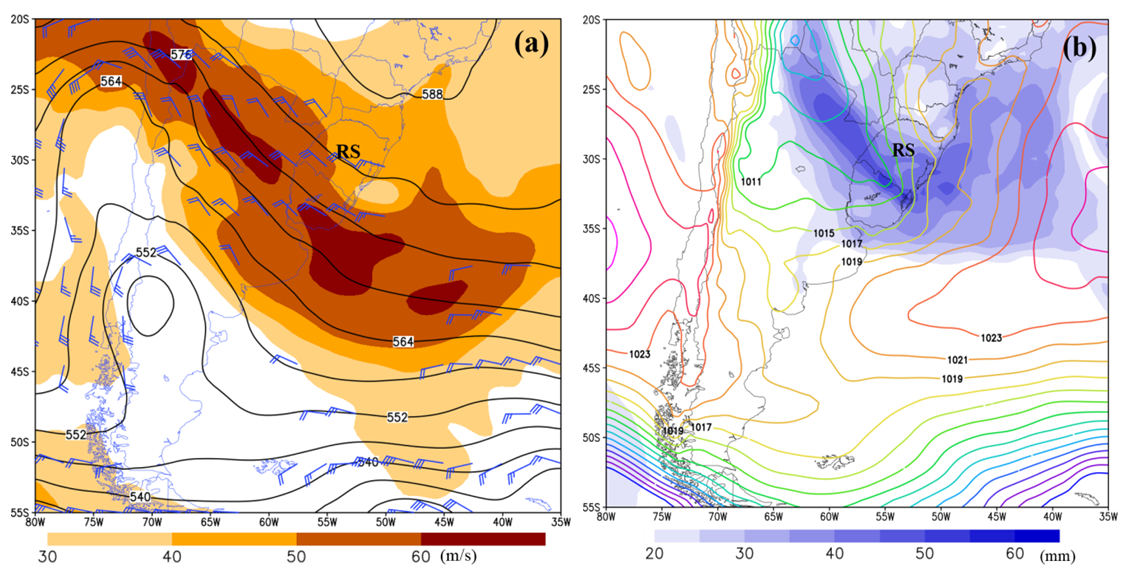
GOES-13 water vapor image loops from 12:00Z 4 July to 00:00Z 5 July (not shown) and CSFv2 analysis at 00:00Z 5 July (Figure 5a) showed a migratory upper-level trough over the Andes Cordillera and its associated NW-SE oriented jet stream extending from northern Chile to the southwestern Atlantic Ocean. The state of RS was far downstream of the upper-level trough and, in the CSFv2 analysis, RS was to the east and to the north of 200 hPa jet streaks (Figure 5a). The corresponding 00:00Z SBSM sounding depicted in Figure 6 confirmed the strong westerly [northwesterly] flow in the upper [middle] troposphere over central RS, such that the CFSv2 data was, at least locally, in good agreement with the upper level observations.
Figure 5. Atmospheric fields from NCEP-CFSv2 analysis valid at 00:00Z 05 July 2014 over southern South America. (a) 500-hPa geopotential heights (black contours; in dam), 500-hPa winds (only where magnitude is equal to or above 20 ; blue barbs), and magnitude of the 200-hPa winds (shading; in ); (b) sea-level pressure (coloured isobars; in hPa), and precipitable water (blue shading; in mm). Location of Rio Grande do Sul state (RS) is indicated in all panelsAt the surface (Figure 5b), a Northwest Argentinean Low [16] pressure system extended meridionally along the Andes foothills, being, to a large extent, a response to the migratory upper-level trough [16]. Additionally, from northeastern Argentina to the Brazil-Uruguay border, an inverted trough with NW-SE orientation was in place. This feature was confirmed by SYNOP observations over the La Plata basin at the same time (not shown). The extension of the inverted trough towards southern Brazil indicates the role played by quasi-geostrophic forcing by the upper-level cyclonic system in lowering surface pressure and (low-tropospheric) geopotential heights further downstream from the Andes. This is a rather common synoptic evolution observed during severe weather conditions in southern Brazil [17].
The inverted trough provides strong and persistent surface convergence, and moisture usually pools along such feature, as indicated by the precipitable water field in the CFSv2 map shown in Figure 5b. Along the inverted trough convective initiation can be focused. In fact, the severe storms observed on 4 July 2014 did initiate in a NW-SE zone across western and southwestern RS indicating an important role played by the inverted trough in initiating the convective storms.
One other consequence of the deepening of the inverted trough over far northeastern Argentina and southern Brazil is the enhancement of the northwesterly lower-tropospheric flow responsible for warm and moist advection over the extreme south of Brazil.
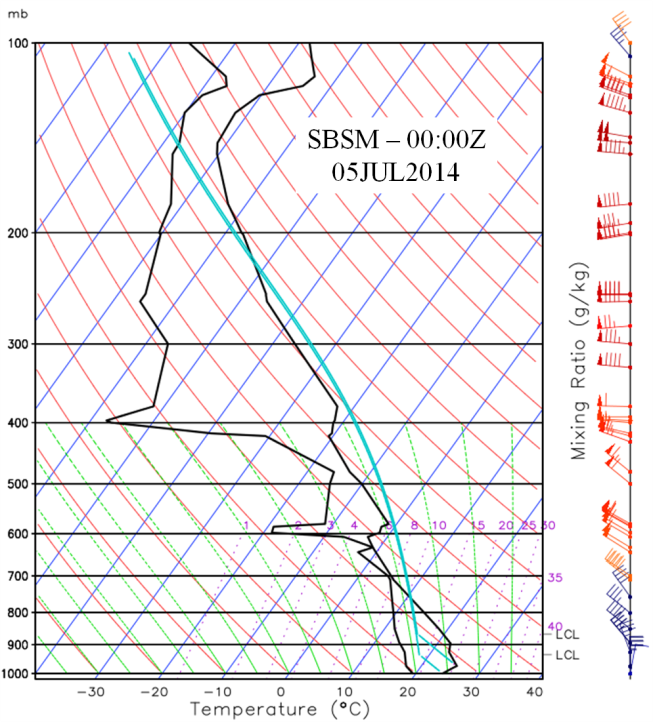
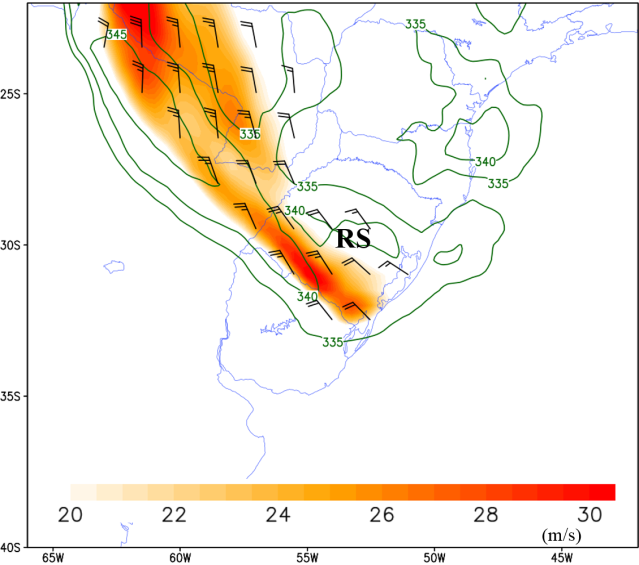
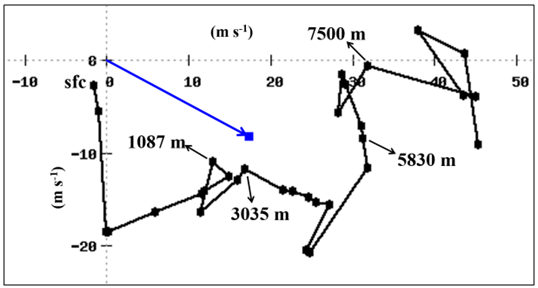
Figure 7 shows the 850 hPa flow and equivalent potential temperature (ϴe) at 00:00Z 5 July. A NW-SE-oriented low level jet stream (LLJS; [18]) was characterized over southern and western RS, transporting warm, moisture-rich air mass from the lower latitudes of South America to RS, which was confirmed by the 00:00Z SBSM sounding (Figure 6) and its corresponding hodograph (Figure 8). The LLJS is a common feature preceding and during the development of severe convective storms in this part of the world ([19], [20], [21], [9]).
Figure 6. Skew-T diagram of the 00:00Z 05 July 2014 sounding conducted at SBSM site. Black lines indicate T and Td profiles (in °C). The adiabatic ascent for two air parcels (surface and mean-layer) are depicted by the light blue lines. Wind profile provided in knots
Figure 7. Atmospheric fields at 850-hPa from NCEP-CFSv2 analysis valid at 00:00Z 05 July 2014 over the La Plata Basin: equivalent potential temperature (green contours; in K), winds (only where magnitude is equal to or above 15 ; black barbs), and wind magnitude (shading; in )
Figure 8. Environmental hodograph from surface to the upper troposphere obtained from the 00:00Z 05 July 2014 SBSM sounding. The blue arrow indicates the estimated storm motion for a left-moving cell. Winds in
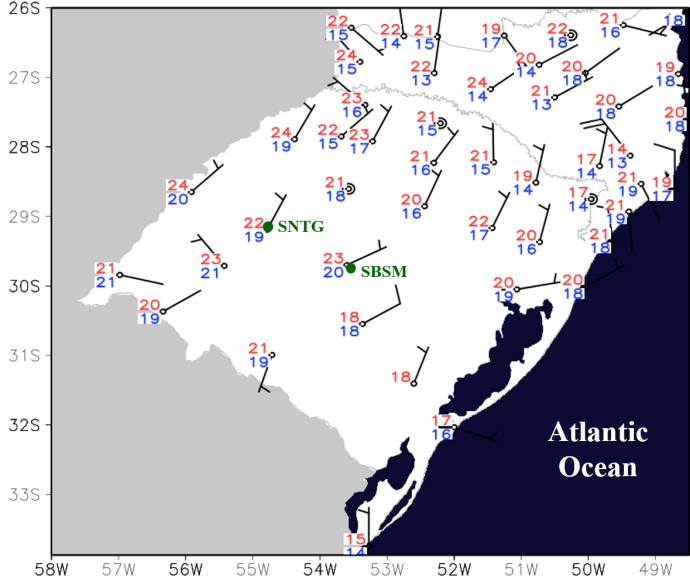
Surface observations from INMET´s operational network valid at 22:00Z 4 July (Figure 9) showed weak-to-moderate northeasterly winds over most of RS, which was a response to the surface pressure falls over far western RS and over the Brazil-Uruguay border. The air mass over western RS, where the severe storms developed, was warm and particularly moist for wintertime conditions, with dew point temperatures as high as 20ºC. The dew point depression was low over a large area, indicating conditions of low heights for the lifting condensation level (LCL) for the surface air parcels.
The SBSM sounding revealed a conditionally unstable environment with strong lapse rate in the 900-700 hPa layer. The surface-based Convective Available Potential Energy (CAPE) reached 938 J kg-1 while the CAPE for the most unstable air parcel was 1053 J kg-1. There was a shallow stable layer in the first 500 m AGL due to the cessation of turbulent mixing associated with the decoupling of the daytime mixing layer after sunset, generating some convective inhibition. To some extent, this configuration may have had an implication in enhancing the LLJS.
Figure 9. Surface observations in southern Brazil at 22:00Z (7PM LST) 04 July 2014. Temperatures (red) and dew point temperatures (blue) at 2 m (in °C), and 10 m winds (barbs; in ). Location of SNTG radar and SBSM sounding site are superimposed in green. Source: INMET
The strong wind field throughout the depth of the troposphere provided large amounts of vertical wind shear in the 0-6 km layer (deep layer (bulk) shear, DLS; Figure 4). DLS magnitude of approximately 32 m s-1 was observed in the SBSM sounding, above typical values for DLS present in supercell storm environments [22] [23]. Given the presence of a LLJS (Figures 7 and 8), high bulk shear values were also found at low levels, reaching 17 m s-1 for the 0-1km layer.
As a result from the combination of a northwesterly LLJS with surface northeasterly winds in central and SW RS (Figure 9) significantly negative values of 0-3 km vertically-integrated storm-relative helicity (SRH3; [24]) were attained. The observed 00:00Z SBSM hodograph displayed a SRH3 of –370 m² s-2 (with the storm motion estimated using [25] which provided good agreement with the observed storm motion). In terms of absolute magnitude, such value is considered high according to existing climatologies for supercell environments in the United States of America (e.g., [22]).
When all combined, the aforementioned aspects provide a general overview of the mechanisms that played an instrumental role in the triggering of severe convection in RS state in the evening and night of 4 July 2014, including at least one supercell storm.

4. Conclusions

Severe convective storms in extreme southern Brazil and their atmospheric environment were examined in this study. Storm evolution was investigated using Doppler radar data. This (austral) wintertime severe weather episode occurred during the evening and night hours of 4 July 2014 in SW-central portions of Rio Grande do Sul state.
The storms initiated over northeastern Argentina earlier in the afternoon in a conditionally unstable atmosphere along a NW-SE-oriented inverted trough that extended to southwestern RS. As storms moved southeastwards into southern Brazil some of them experienced rapid intensification and motion to the left of the mean tropospheric flow. Wind damage was reported at night with one such cell in the rural sections of the town of Rosário do Sul in midwestern RS. One of the left-moving storms displayed a WER along with a long-lived cyclonic couplet in the radial velocity field characterizing a supercell storm.
As for the synoptic environment, the mid-to-upper level westerly flow was strong over the extreme south of Brazil in response to a 500 hPa migratory trough. This configuration generated intense deep-layer vertical wind shear in the region. In the lower troposphere, the deepening of the inverted trough induced a strong northwesterly LLJS that advected warm and moist air into southwestern RS, destabilizing the atmosphere. Combined with northeasterly surface winds observed over RS, the LLJS also produced significant directional vertical wind shear and storm-relative helicity at low-levels, as confirmed by the SBSM sounding. The combination of moisture availability with a conditionally unstable air mass, strong surface convergence, intense deep layer wind shear, the presence of a LLJS, and directional low-level wind shear explained the formation of severe storms including at least one long-lived supercell.
One relevant aspect of the 4 July 2014 event is that it took place in a moisture-rich environment during winter. This episode exemplifies a wintertime condition in southern Brazil in which a baroclinic environment, with strong vertical wind shear, gives rise to severe local storms during the occasional lower-tropospheric incursion of warm moist air. Forecasters in that region should be aware of these instances when predicting convective storms.
It is also important to stress the role played by the surface (inverted) trough extending from northeastern Argentina to southern Brazil in creating the environment conducive to severe convection in the eastern portions of the La Plata Basin. The deepening of the trough promotes not only low-level convergence and moisture pooling, but also an isallobaric response in the wind field that generates or intensifies the northerly lower-tropospheric flow, most often characterizing a LLJS. Sometimes, as was the case in the 4 July 2014 event, the surface winds to the east of the trough responds to such deepening with a northeasterly component, which increases the directional vertical wind shear at low levels. The aforementioned synoptic configuration develops without the presence of an extratropical cyclone necessarily.

ACKNOWLEDGEMENTS

We would like to thank the Environmental Satellite Division from Brazil´s National Space Research Institute (DSA-INPE), and in particular meteorologist Thiago Biscaro, for making available the raw radar data used in this study.

References

[1]  Bluestein, H. B., 2007, Advances in applications of the physics of fluids to severe weather systems, Reports on Progress in Physics, 70(8), 1259.
[2]  Davies-Jones, R., 1984, Streamwise vorticity: the origin of updraft rotation in supercell storms. Journal of Atmospheric Sciences, 41(20), 2991-3006.
[3]  Moller, A. R., 2001, Severe local storms forecasting. In Severe Convective Storms (pp. 433-480). American Meteorological Society.
[4]  Duda, J. D., and Gallus Jr, W. A., 2010, Spring and summer midwestern severe weather reports in supercells compared to other morphologies. Weather and Forecasting, 25(1), 190-206.
[5]  Brooks, H. E., Lee, J. W., Craven, J. P. T., 2003, The spatial distribution of severe thunderstorm and tornado environments from global reanalysis data. Atmospheric Research, 67, 73-94.
[6]  Brooks, H. E., 2006, A global view of severe thunderstorms: Estimating the current distribution and possible future changes. Severe Local Storms Special Symposium, Atlanta, GA, Amer. Meteor. Soc., J4.2.
[7]  Zipser, E. J., Liu, C., Cecil, D. J., Nesbitt, S. W., Yorty, D. P., 2006, Where are the most intense thunderstorms on Earth?. Bulletin of the American Meteorological Society, 87(8), 1057-1071.
[8]  Cecil, D. J., and Blankenship, C. B., 2012, Toward a global climatology of severe hailstorms as estimated by satellite passive microwave imagers. Journal of Climate, 25(2), 687-703.
[9]  Nascimento, E. de L., Held, G., Gomes, A. M., 2014, A Multiple-Vortex Tornado in Southeastern Brazil. Monthly Weather Review, 142(9), 3017-3037.
[10]  Silva Dias, M. A. F., and Grammelsbacher, E. A., 1991, The possible tornado occurrence in São Paulo on 26 April 1991: a case study (In portuguese). Revista Brasileira de Meteorologia, 6(2), 513-522.
[11]  Queiroz, A. P., 2008, Monitoring and nowcasting of severe storms using radar data. (In Portuguese). M. Sc. Dissertation, Instituto Nacional de Pesquisas Espaciais, SP, Brasil.
[12]  Collis, S., 2015, Using the Scientific Python ecosystem to advance open radar science. 2015 AGU Fall Meeting.
[13]  Saha, S., and Coauthors, 2014, The NCEP climate forecast system version 2. Journal of Climate, 27(6), 2185-2208.
[14]  Burgess, D. W., Donaldson, R. J., and Desrochers, P. R. (1993). Tornado detection and warning by radar. The tornado: Its structure, dynamics, prediction, and hazards, 203-221.
[15]  Stumpf, G. J., A. Witt, E. W. Mitchell, P. L. Spencer, J. T. Johnson, M. D. Eilts, K. W. Thomas, and D. W. Burgess, 1998, The National Severe Storms Laboratory mesocyclone detection algorithm for the WSR-88D. Weather and forecasting, 13(2), 304-326.
[16]  Seluchi, M. E., Saulo, A. C., Nicolini, M., & Satyamurty, P., 2003, The northwestern Argentinean low: A study of two typical events. Monthly Weather Review, 131(10), 2361-2378.
[17]  Nascimento, E. de L., and Foss, M., 2010, A 12-yr climatology of severe weather parameters and associated synoptic patterns for subtropical South America. 25th Conf. on Severe Local Storms.
[18]  Stensrud, D. J., 1996, Importance of low-level jets to climate: A review. Journal of Climate, 9(8), 1698-1711.
[19]  Matsudo, C. M., and Salio, P. V., 2011, Severe weather reports and proximity to deep convection over Northern Argentina. Atmospheric Research, 100(4), 523-537.
[20]  Rasmussen, K. L., and Houze Jr, R. A., 2011, Orogenic convection in subtropical South America as seen by the TRMM satellite. Monthly Weather Review, 139(8), 2399-2420.
[21]  Rasmussen, K. L., and Houze Jr, R. A., 2016, Convective initiation near the Andes in subtropical South America. IMonthly Weather Review, 2351-2374.
[22]  Rasmussen, E. N., and Blanchard, D. O. , 1998, A baseline climatology of sounding-derived supercell and tornado forecast parameters. Weather and Forecasting, 13(4), 1148-1164.
[23]  Thompson, R. L., Edwards, R., Hart, J. A., Elmore, K. L., & Markowski, P., 2003, Close proximity soundings within supercell environments obtained from the Rapid Update Cycle. Weather and forecasting, 18(6), 1243-1261.
[24]  Davies-Jones, R., Burgess, D., Foster, M., 1990, Test of helicity as a tornado forecast parameter. 16th Conf. on Severe Local Storms, Kananaskis Park, AB, Canada, Amer. Meteor. Soc (pp. 588-592).
[25]  Davies, J. M., and Johns, R. H. (1993). Some wind and instability parameters associated with strong and violent tornadoes. Part I: Wind shear and helicity. The Tornado: Its Structure, Dynamics, Prediction, and Hazards. Geophys. Monogr., 79, 573-582.