-
Paper Information
- Previous Paper
- Paper Submission
-
Journal Information
- About This Journal
- Editorial Board
- Current Issue
- Archive
- Author Guidelines
- Contact Us
American Journal of Environmental Engineering
p-ISSN: 2166-4633 e-ISSN: 2166-465X
2015; 5(1A): 119-124
doi:10.5923/s.ajee.201501.15
Wind and Eddy Diffusivity Parameterizations for an Operative Air Pollution Model
 Abstract
 Reference
 Full-Text PDF
 Full-text HTML
1Institute of Atmospheric Sciences and Climate (ISAC), CNR, Bologna, Italy
2Institute of Atmospheric Sciences and Climate (ISAC), CNR, Lecce Italy
Correspondence to: T. Tirabassi , Institute of Atmospheric Sciences and Climate (ISAC), CNR, Bologna, Italy.
| Email: |  |
Copyright © 2015 Scientific & Academic Publishing. All Rights Reserved.
Two parameterizations for wind and eddy diffusivity profiles in the planetary boundary layer (PBL) based on a similarity theory are applied in the operational dispersion model VHDM (Virtual Height Dispersion Model). One is the well known Pleim and Chang parameterization, while the other one is more physically consistent and was applied to an analytical model (as VHDM is) for the first time. The formulations are compared using the data from the Copenhagen experiment and statistical evaluation applying widely used indices showing that the PBL parameterizations are well suited for application in air pollution modelling over the whole unstable atmospheric stability regime.
Keywords: Turbulence parameterization, Planetary boundary layer, Eddy diffusivities, Air pollution modelling
Cite this paper: T. Tirabassi , C. Mangia , Wind and Eddy Diffusivity Parameterizations for an Operative Air Pollution Model, American Journal of Environmental Engineering, Vol. 5 No. 1A, 2015, pp. 119-124. doi: 10.5923/s.ajee.201501.15.
Article Outline
1. Introduction
- Eulerian approach for modelling the statistical properties of contaminants concentrations in a turbulent flow as the Planetary Boundary Layer (PBL) is widely used in the field of air pollution studies. In these models the main scheme for closing the advection-diffusion equation is to relate concentration turbulent fluxes to the gradient of the mean concentration by eddy diffusivities (K-theory). The simplicity of the K-theory of turbulent diffusion has led to the widespread use of this theory as mathematical basis for simulating air pollution. But K-closure has its own limits: it works well when the dimension of the dispersed material is much larger than the size of turbulent eddies involved in the diffusion process, i.e. for ground-level releases and for large travel times. Despite these well known limits, the K-closure is largely used in several atmospheric conditions because it describes the diffusive transport in an Eulerian framework where almost all measurements are Eulerian in character, it produces results that agree with experimental data as well as any more complex model, and it is not computationally expensive as higher order closures are. The reliability of the K-approach strongly depends on the way the wind and eddy diffusivity are determined on the basis of the turbulence structure of the PBL and on the model ability to reproduce experimental diffusion data [1].The aim of this paper is to evaluate, applying Copenhagen data set, the performances of the dispersion model VHDM (Virtual Height Dispersion Model), which is an operative model for evaluating ground-level concentration from elevated sources [2, 3], with two PBL parameterization, in order to know limits and possibilities of both parameterizations in view of their applications in air pollutions studies.That is, a well known PBL parameterization proposed by Pleim and Chang [4], already applied in many air pollution studies.The second one is the PBL parameterisation developed by Yordanov [5-7] which calculates the wind and eddy diffusivity profiles in the PBL under different stability conditions, based more on similarity theory and results to be more physically consistent of Pleim and Chang parameterization and, moreover, it has never been applied in analytical air pollution models (as VHDM is).In this paper eddy diffusivity and wind profiles in PBL are obtained from the surface turbulent fluxes defined by the Monin-Obukhov length scale (L) and the friction velocity (u*), which are taken from the experimental data applying the parameterization developed in [8, 9].
2. Yordan Parameterization
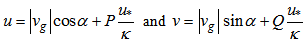
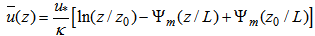
- The simple two-layer model described in [5] is used to produce the vertical profiles of the wind and the vertical turbulent exchange coefficient. The PBL model YORDAN was compared with a number of experimental data sets and demonstrates good coincidence as shown by [7, 10]. The PBL model consists of a Surface Layer (SL) with height h* and an Ekman layer above it. In the SL,
 , the wind profile is determined as:
 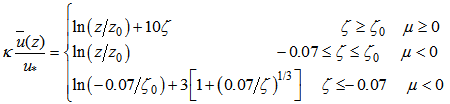 | (1) |
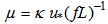 is the internal stratification parameter,
  is the von Karman constant,
  is the non-dimensional height,
  is the non-dimensional roughness, and f is the Coriolis parameter
  .For the non-dimensional SL height
  the following relations are used:
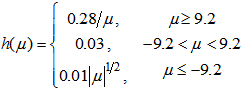 | (2) |
 we have:
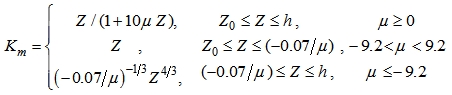 | (3a) |
 | (3b) |
 is the non-dimensional SL height,
  is the height scale,
  is the non-dimensional height and
  is the non-dimensional roughness. We can notice that
  and from it we obtain for the dimensional SL height the relation:
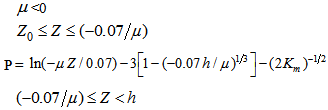
 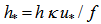 . In the Ekman layer (Z>h*), the turbulent exchange coefficient is assumed not to change with height and to be equal to
  :
: | (4a) |
 | (4b) |
 | (5) |
 are the geostrophic wind velocities components, and the non-dimensional velocity defects P and Q are given by the following expressions:in SL:
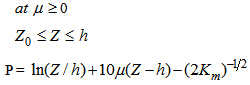 | (6a) |
 | (6b) |
 | (6c) |
 | (6d) |
 | (7) |
 , and the x-axis is directed along the surface wind. Replacing the expressions from Eq. (6) and (7) in Eq. (5) we can find the velocity profiles given by the expresion for the mean wind:
 | (8) |
3. Parameterization of Pleim and Chang
- Following [4] during stable and neutral conditions at
 :
: | (9) |
 | (10) |
 the friction velocity was replaced by the convective velocity scale
  defined as
 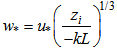 and the following relation is used:
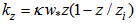 | (11) |
 | (12) |
 is a stability function given by:
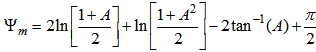 | (13) |
 . For a stable PBL (L>0) we use the relations:
 | (14) |
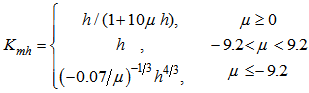
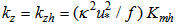
 is given by the expression:
 | (15) |
4. VHDM Air Pollution Model
- The virtual height dispersion model (VHDM) is an operative short range model for evaluating ground level concentration from industrial sites. It approximates the cross-wind integrated ground level concentration Cy(x,0) by means of a Fickian- type formula in which the real source is replaced by a virtual source placed at the geometric average of the two virtual source heights
 and
and  function of the wind speed and eddy diffusivity profile:
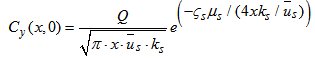 | (16) |
 and
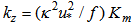
and  are the wind speed and the eddy diffusivity at the source height respectively,
  and
and  are two virtual source heights expressed by simple functions of the vertical profiles of wind and turbulent diffusivity defined as:
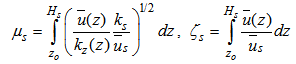 | (17) |
 and wind velocity
  , provided the integrals in Equation (17) exist. In [11] it is shown that the ground level concentrations admit lower and upper bounds that represent solutions at the ground level of two diffusion equations of Fickian-type with the two virtual sources
  and
and  respectively. Moreover, for a general profile of the wind and eddy diffusivity we expect
  . This fact explains the physical meaning of the two bounds and the relative importance of the
  and
and  profiles in determining the solution of the advection diffusion equations at ground level. On the basis of the above considerations, we used the interpolation between the two bounds (lower and upper bound), and selected the above Gaussian formula, since the predicted maximum position
  :
: | (18) |
5. Comparison with Experimental Data
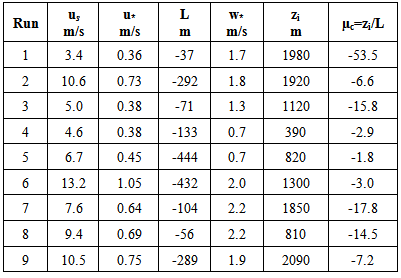
- We evaluated the performance of the PBL parameterization, applying the VHDM air pollution model to the Copenhagen data set [13, 14]. The Copenhagen data set is composed of tracer SF6 data from dispersion experiments carried out in northern Copenhagen. The tracer was released without buoyancy from a tower at a height of 115 m and was collected at ground-level positions in up to three crosswind arcs of tracer sampling units. The sampling units were positioned 2-6 km far from the point of release. We used the values of the crosswind-integrated concentrations (Cy) normalised with the tracer release rate from [15]. The releases typically started up before the sampling and stopped at the end of the sampling period, which is a total sampling time of 1 hour and for the experiments considered it was around 12 o’clock. The site was mainly residential with a roughness length of 0.6 m.The meteorological measurements performed during the experiments included standard measurements along a tower at the point of release. The meteorological conditions during the dispersion experiments, ranged from moderately unstable to convective. Table 1 summarises the meteorological data during the Copenhagen experiment used as input data for the PBL models simulations. us is the wind speed at the source height, w* is the convective velocity scale and
 is the internal stratification parameter for convective condition.
|
 and
and  are calculated from Eq. (10) for Model I and Model II with the corresponding wind and eddy diffusivity profiles.
 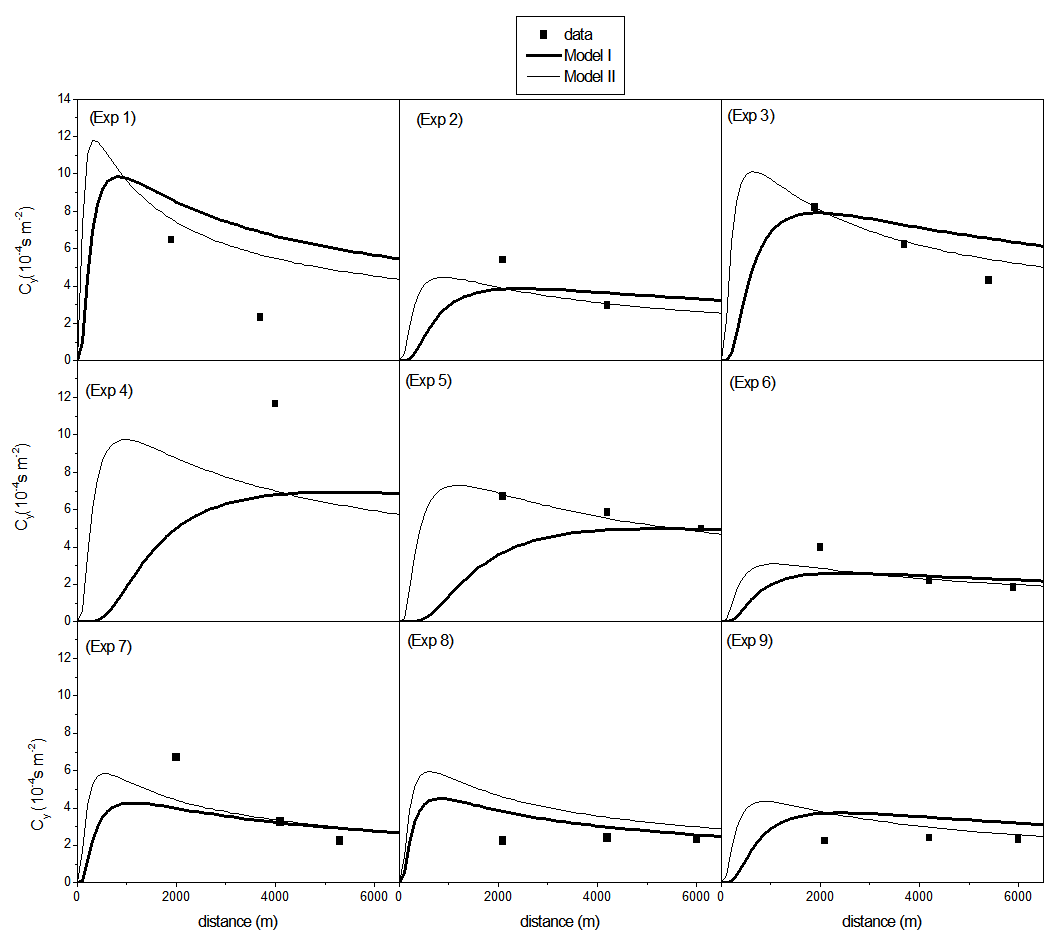 | Figure 1. Comparison of ground level observed data with the cross-wind integrated concentration predicted by the models in function of the distance from the source for the PBL parametrizations presented (Model I: YORDAN, Model II: Pleim and Chang) |
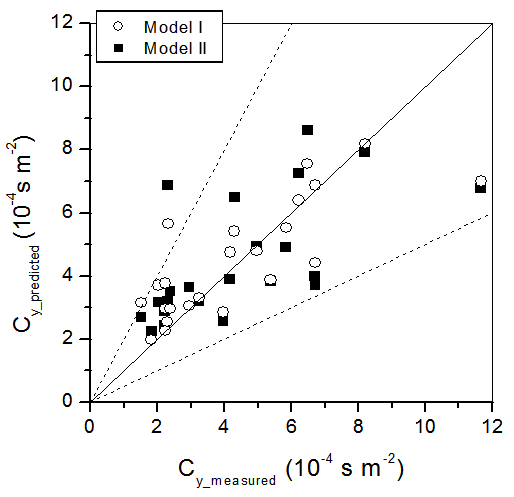 | Figure 2. Scatter plot of observed crosswind-integrated versus predicted ones normalized with the emission source rate. Points between dashed lines are in a factor of two. (Model I: YORDAN, Model II: Pleim and Chang) |
|
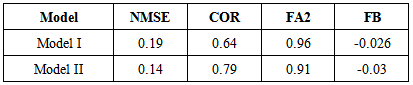
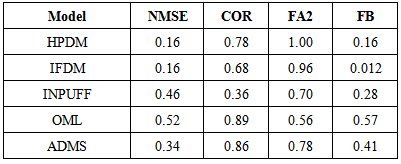
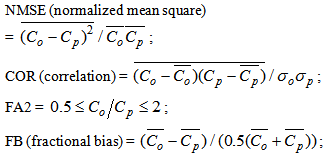 where the subscripts o and p refer respectively to observed and predicted quantities, and the overbar indicates an average.Analysing the statistical indices in Table 2 it is possible to notice that the models simulate satisfactory the observed concentrations, with NMSE, FB and FS values relatively near to zero and COR and FA2 relatively near to 1.Moreover, in order to compare the performance of the proposed model with that of other models, we report in Table 3 the results obtained with the same data set by other models: HPDM [17], IFDM [18], INPUFF [19], OML [20], ADMS [21]. The latter results were obtained as part of a model validation exercise during The Workshop on Operational Short-range Atmospheric Dispersion Models for Environmental Impact Assessment in Europe [22]. Analysing the data presented in Table 3 it can be seen that the results obtained with the two proposed PBL model are comparable to those found from the other state of art models.
|
6. Conclusions
- Atmospheric-dispersion modelling usually takes account of atmospheric turbulence in a simple way based on surface measurements, and where the dispersion from a source is estimated by assuming simple formulae for concentration distribution, in which the dispersion parameters depend simply on downwind distance and the meteorological state of boundary layer. Experimental work and modelling efforts have attempted to parameterize the surface fluxes of momentum, heat and moisture in terms of routinely measured meteorological parameters. These modelling techniques contain algorithms for calculating the main factors that determine air pollution diffusion in terms the Monin-Obukhov length scale. In this paper two turbulent parameterization have been included in an operative model, and evaluated against the Copenhagen data seta.A comparison of the concentrations measured and calculated was made and the analysis of results and the application of statistical indices show that VHDM model which included the eddy diffusivity parameterisation proposed, produces a good fit for the experimental ground level concentration data.The PBL parameterizations permit that the model can be applied routinely because as input simple ground-level meteorological data can be acquired by an automatic network.These remarks lead to the preliminary conclusion that the proposed approach could be used in an operative model of pollutant dispersion into the atmosphere, as a tool for the evaluation and management of air quality.