-
Paper Information
- Next Paper
- Previous Paper
- Paper Submission
-
Journal Information
- About This Journal
- Editorial Board
- Current Issue
- Archive
- Author Guidelines
- Contact Us
American Journal of Environmental Engineering
p-ISSN: 2166-4633 e-ISSN: 2166-465X
2015; 5(1A): 96-105
doi:10.5923/s.ajee.201501.13
Analysis of Extreme Precipitation Events Using a Novel Data Mining Approach
 Abstract
 Reference
 Full-Text PDF
 Full-text HTML
Heloisa Musetti Ruivo 1, Haroldo F. de Campos Velho 1, Gilvan Sampaio 2, Fernando M. Ramos 1
1Laboratory for Computing and Applied Mathematics, National Institute for Space Research, São José dos Campo, São Paulo, Brazil
2Earth System Science Center, National Institute for Space Research, Cachoeira Paulista, São Paulo, Brazil
Correspondence to: Haroldo F. de Campos Velho , Laboratory for Computing and Applied Mathematics, National Institute for Space Research, São José dos Campo, São Paulo, Brazil.
| Email: |  |
Copyright © 2015 Scientific & Academic Publishing. All Rights Reserved.
An innovative data mining approach is presented and applied to investigate the climatic causes of extreme climatic events. Our approach comprises two main steps of knowledge extraction, applied successively in order to reduce the complexity of the original data set. The goal is to identify a much smaller subset of climatic variables that might still be able to describe or even predict the extreme events. The first step applies a class comparison technique. The second step consists of a decision tree learning algorithm used as a predictive model to map the set of statistically most significant climate variables identified in the previous step to classes of precipitation intensity. The methodology is employed to the study the climatic causes of two extreme events occurred in Brazil the last decade: the Santa Catarina 2008 extreme rainfall tragedy and the Amazon droughts of 2005 and 2010. In both cases, our results are in good agreement with analyses published in the literature.
Keywords: Extreme event, Drought, Intense rainfall, KDD (Knowledge Discovery in Databases), Data mining, Classification, Decision tree
Cite this paper: Heloisa Musetti Ruivo , Haroldo F. de Campos Velho , Gilvan Sampaio , Fernando M. Ramos , Analysis of Extreme Precipitation Events Using a Novel Data Mining Approach, American Journal of Environmental Engineering, Vol. 5 No. 1A, 2015, pp. 96-105. doi: 10.5923/s.ajee.201501.13.
Article Outline
1. Introduction
- In November 2008, after a three-month period of unusually wet weather, torrential rains, flash floods and landslides killed 128 people and displaced approximately 80,000 people in the Itajaí valley on the northwest coast of the State of Santa Catarina in Brazil. Within a 48-hour span during December 22 and 23, 300 mm of rain, two times the monthly average, was measured on the city of Blumenau [1]. By its intensity and scale, this extreme event found no precedent in the historical records, affecting almost one quarter of the state’s population, causing extensive infrastructure damage and economic loss. In 2005 and 2010, large domains of the Amazon region experienced an unusually intense dry season that severely impacted human activities along the Amazon River and some of its main tributaries. River levels fell to historic minima and navigation had to be suspended, affecting tens of thousands of people with a food shortage and prompting Brazil and other countries in the region to declare a state of public calamity [2].Today, there is increasing scientific evidence that extreme climate and weather phenomena, such as the ones mentioned above, could become more frequent under a warmer planet [3]. This picture has been gradually emerging, since the first IPCC Assessment report in 1990, from a series of studies based on an increasing amount of data, which comprehensively covers the relevant atmospheric, land, ice and ocean variables, computed or measured at different time intervals and spatial resolutions. These data sets come from remote instruments in satellites and in situ sensor networks, or are the outputs of computer simulations and reanalyses [4]. Among the challenges generated by this deluge of data is the development of better technologies to store, distribute, analyze, and visualize their information content [5, 6]. Currently, climatologists have at their disposal a well-known panoply of statistical tools, from simple and easy-to-use methods of analysis like compositing, regression and correlation, used to identify weak, non-periodic signals in a noisy climatic record, to powerful techniques such as Empirical Orthogonal Function (EOF) analysis and related techniques, that permit to describe in an optimal way complicated relationships among extremely large number of degrees of freedom using a few modes or patterns [7]. However, given the complexities of the climate system and societal concerns regarding the impacts of climate change, there is still a demand for the development and use of efficient knowledge discovery techniques.Data mining − a step in the more general process of knowledge discovery in databases (KDD) − attempts to uncover hidden patterns in large data sets. Its main goal is to extract information from a data set and transform it into an understandable structure for further use, in order to facilitate a better interpretation of existing data [8]. These patterns can be seen as a kind of summary of the input data and may be used in further analysis. Data mining may, for instance, identify multiple clusters or subsets in the data, which can then be used to obtain more accurate prediction results by a decision support system.For more several decades, climatologists have been using data mining techniques in a variety of studies. For a review see [9] and references therein. However, within the particular context of extreme rainfall-associated events, data mining technologies were applied in a relatively small number of studies [10, 11]. Here we present an innovative data mining approach to investigate the climatic causes of extreme events such as the Santa Catarina 2008 tragedy, and the Amazon droughts of 2005 and 2010. Our approach comprises two main steps of knowledge extraction, applied successively in order to reduce the complexity of the original dataset, and identify a much smaller subset of climatic variables that may explain the event being studied. In the first step, we follow along the lines of [12], and apply a class comparison technique commonly used as a tool to analyze large data sets of genome-wide studies. This step results in a series of
 spatial fields that identify which climatic variables behave differently across pre-defined classes of precipitation intensity. More generally, it permits to identify coherent spatial patterns that might indicate the existence of plausible links between different climate subsystems.The second step consists of a decision tree (DT) learning algorithm used as a predictive model to map the set of statistically most significant climate variables identified in the previous step to classes of precipitation intensity. A decision tree is a flowchart-like structure in which internal nodes represent tests on attributes, each branch represents the outcome of a test, and each leaf node represents a class label. A path from the root to a given leaf represents a set of classification rules [13]. In the present context, the final result identifies a small subset of climatological variables that may explain or even forecast the extreme event in study.The remainder of this paper is organized as follows. Section 2 presents the methodology and data sets used in this investigation. Section 3 presents our results, while in Section 4 we draw some conclusions and discuss further developments.
2. Methodology
- The data mining approach here employed comprises two main steps of knowledge extraction: class-comparison, and decision trees. These methods are applied successively to reduce the complexity of the original dataset and identify a much smaller subset of climatic variables that may explain the event being studied.
2.1. Class-Comparison
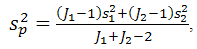
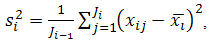
- Class comparison methods are used for comparing two or more pre-defined classes in a data set. Here, we apply the class-comparison to time series of climatic grid box values or indices, but not to entire fields. The objective is to determine which variables in our data setbehave differently across pre-defined classes of precipitation intensity (“high”, “neutral”, and “low”, for example). The “no-difference” case corresponds to a null hypothesis. The classes are defined in such a way so as to capture in the correct class the main episodes of drought or extreme precipitation that occurred during the period being evaluated. There are several methods for checking whether differences in variable values are statistically significant [14]. The F-test is a generalization of the well-known t-test, which measures the distance between two samples in units of standard deviation. Large absolute values of the F-statistic suggest that the observed differences among classes are not due to chance, and that the null hypothesis can therefore be rejected.Supposing there are J1 data points of class 1 and J2 data points of class 2, the t-test score is computed as:
 | (1) |
 | (2) |
 | (3) |
 = mean of samples class 1,
 = mean of samples class 2.For more than two classes, a F-statistic shall be computed. In this case, the alternative to the null hypothesis is that at least one of the classes has a distribution that is different from the others. The t-test and F-test scores may be converted into probabilities, known as
  . A
. A  is the probability that one would observe under the null hypothesis a t-statistic (or F-statistic) as large as or larger than the one computed from the data. Both the t-test and F-test assume that the means are normally distributed, which may not hold, particularly when the number of data points is small. In this case, one could use the non-parametric counterparts of these tests, such as the Wilcoxcon test, the Kruskal-Wallis, or a permutation method.The probability of observing an F-statistic as large as or larger than the one computed from the data is called a “p-value”. It is a measure of statistical significance in the sense that one expects to observe, under the null hypothesis, p-values less than 0.01 only 1% of the time. Permutations methods, which do not rely on data normality assumptions, are commonly used for computing p-values [14, 15]. For this, after calculating t-test scores for each variable, the class labels of the J1 and J2 are randomly permuted, so that a random J2 of the samples are temporarily labeled as class 1, and the remaining J2 samples are labeled as class 2. Using these temporarily labels, a new t-test score is calculated, say t*. The labels are then reshuffle many times again, with a t* being computed at each permutation. The p-value from the permutation t-test is given by:
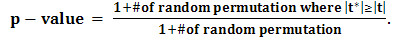 | (4) |
2.2. Decision Tree
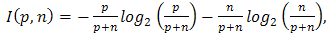
- The decision tree (DT) algorithm used here is the J4.8, from the WEKA package [16]. The J4.8 is a Java implementation of the C4.5 algorithm, which belongs to a succession of DT learners developed by Hunt and others in the late 1950s and early 1960s [17]. DTs are tree-like recursive structures made of leafs, labeled with a class value, and test nodes with two or more outcomes, each linked to a sub-tree. The input to a DT algorithm consists of a collection of training cases, each having a tuple of values for a fixed set of attributes (independent variables) and a class attribute (dependent variable). The goal is to generate a map that relates an attribute value to a given class. The classification task is performed following down from the root the path dictated by the successive test nodes, placed along the tree, until a leaf containing the predicted class.Usually, DT learners use the divide-and-conquer strategy to construct a suitable tree from a training set. For this, the problem is successively divided into smaller sub-problems until each subgroup addresses only one class, or until one of the classes shows a clear majority not justifying further divisions. Most algorithms attempt to build the smallest trees without loss of predictive power. To this end, the J4.8 algorithm relies on a partition heuristic that maximizes the “information gain ratio”, the amount of information generated by testing a specific attribute. This approach permits to identify the attributes with the greatest discrimination power among classes, and select those that will generate a tree that is both simple and efficient.The information gain is measured in terms Shannon’s entropy reduction. Given a set A with two classes P and N, the information content (in bits) of a message that identifies the class of a case in A is then
 | (5) |
 is the total number of objects belonging to class
  , and n is total number of the objects into the classes N. If A is partitioned into subsets A1, A2, … , Av by a given test T, the information gained is given by
 | (6) |
 | (7) |
3. Results
- The climatic causes of the Santa Catarina 2008 tragedy and the Amazon droughts of 2005 and 2010 are investigated. The entire data sets used in the analysis can be freely downloaded from the Web. Surface- and pressure-level atmospheric fields have a spatial resolution of 2.5ox 2.5o and were extracted from NCEP/NCAR Reanalyzes [19]. Sea Surface Temperatures (SSTs) on a 2o x 2o grid were obtained from the NOAA Optimum Interpolation SST Analysis, version 2 [20].The objective of this study is to determine which variables in the dataset behave differently across pre-defined classes of precipitation intensity. The “no-difference” case corresponds to the null hypothesis for the applications considered here.
3.1. Extreme Rainfall over Santa Catarina
- The data set used in this study comprises 3,693 time series (Table 1). Gridded data cover a region delimited by latitudes 20oS and 50oS, and longitudes 30oW and 60oW. Since the episode of extreme rainfall in Santa Catarina was an event of short duration, pentad-averaged anomalies were used in the analysis.
|

3.1.1. Class-Comparison
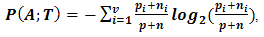
- The goal is to identify variables that might correlate with observed differences among classes of precipitation in the region of Blumenau (red dot in Figs. 2 to 4), one of the most affect areas by the 2008 disaster. To this end, we analyzed 12 years (January 1999 up to December 2010) of pentad averages, comprising 3,693 environmental variables. Precipitation data in the region of Blumenau (Fig. 1) is an average of five measurement stations of Brazilian National Water Agency (Agência Nacional de Águas, ANA) [24].
 | Figure 1. Average rainfall in Santa Catarina - Brazil |
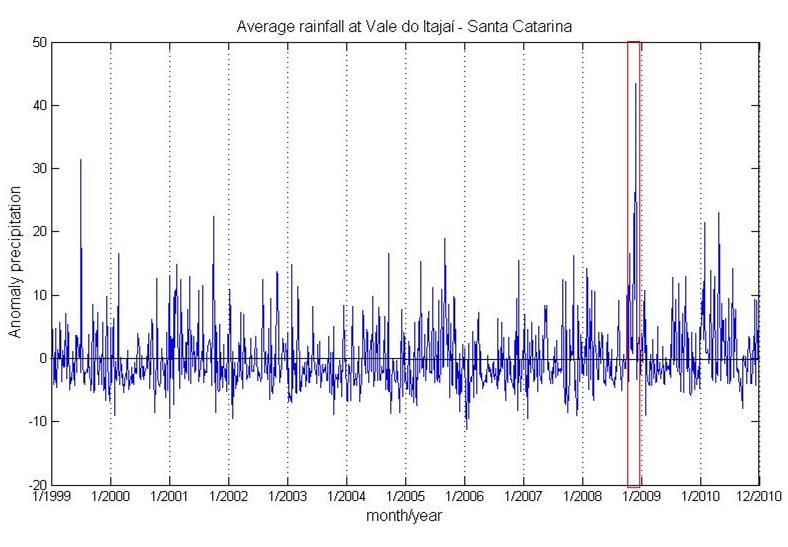
 | Figure 2. Representation in p-values of the climatic variable influence omega (200, 300, 400 and 500 hPa) in Santa Satarina flood |
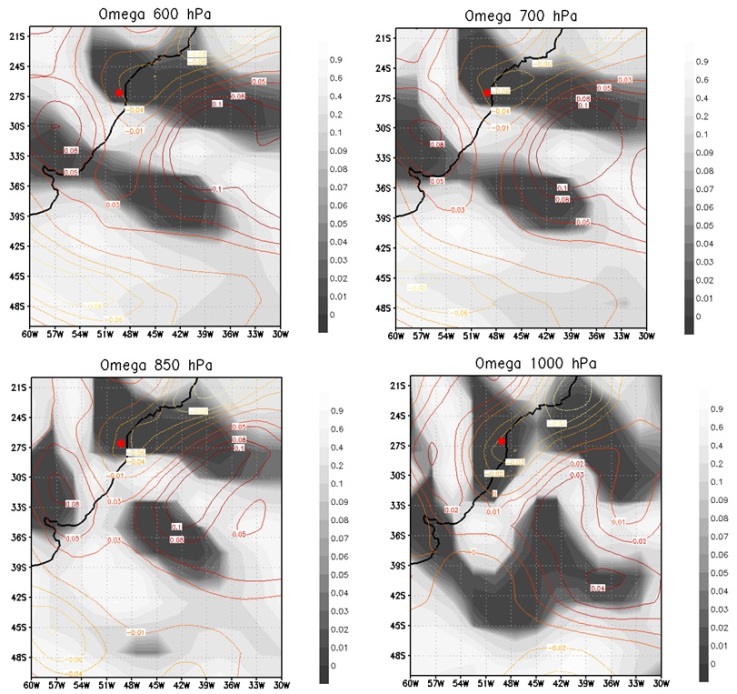 | Figure 3. Representation in p-values of the climatic variable influence omega (600, 700, 850 and 1000 hPa) in Santa Satarina flood |
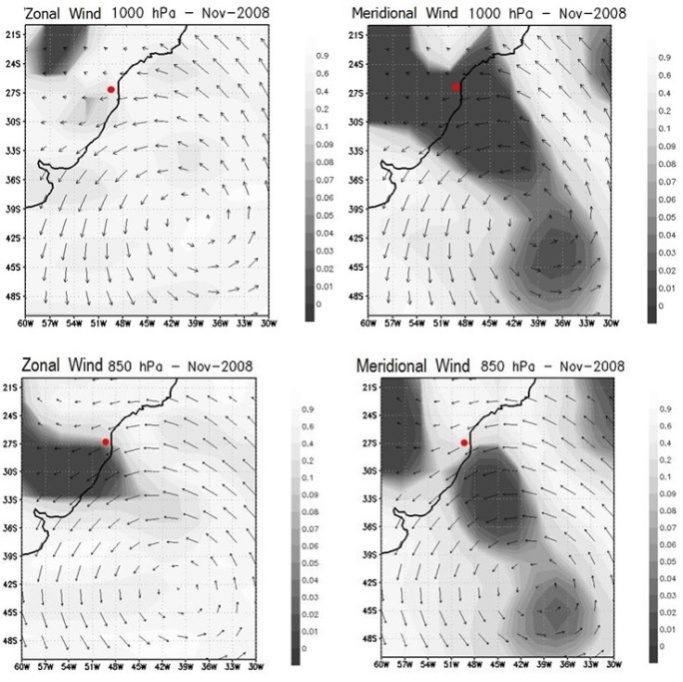 | Figure 4. Representation in p-values of the climatic variables influences zonal and meridional wind (1000 and 850 hPa) in Santa Catarina flood |
- Regions with darker shades indicate the grid parameters with lower p-values. A p-value < 0.01, for example, indicates probability lower than 1% of being a false positive. Figures 2 and 3 show a dense dark area of low p-values for omega at different levels, which extends from the South Atlantic Ocean up the coast of Santa Catarina, and includes in its extreme west the area of Blumenau. During the extreme rainfall episode, we also observe (see the isolines) that omega values are negative over the continent (upward vertical motion) and positive over the ocean (downward vertical movement). It is well known that upward vertical motion over the continent can result in precipitation. This precipitation is fed by moisture transported from the ocean to the continent by easterly winds that predominated in the area in late November (see Fig. 4). According to [1], the location of a blocking anticyclone on the Atlantic Ocean (with winds that rotate in anti-clockwise on the Southern Hemisphere) determined the occurrence of easterly winds on large part of the South Region coast, resulting in a large scale moisture transport from the ocean to the continent, particularly over the Itajaí valley.
3.1.2. Decision Tree
- The decision tree with the J4.8 algorithmwas createdwith confidence factor used for pruning (0.25), and number of instances per leaf (8). Several tests were performed: with fixed number of attributes (meteorological variable for different coordinates are considered different attibute) with smallest p-values. The best result was obtained withthe 5 different climatological variables, considering 10 different coordinates for each variable, with smallest p-values (total 50 attibutes). To this goal, the precipitation time series were divided over the area of Blumenau (red dot) in two classes: “light” (values below the median), and “strong” (values above the median), corresponding to episodes of low and high precipitation, respectively. The training set comprised data from 2000 up to 2006. The years of 1999, 2007, 2008, 2009, and 2010 were used to evaluate the tree performance. Figure 1shows two rainfall intense episodes: July 1999, and November 2008. The event at July 1999 was less intense than November 2008.The resulting tree, displayed in Fig. 5, has 7 leafs (4 “strong” and 3 “light”) and 6 decision nodes. The variable with the highest information gain is omega at 500 hPa, and at coordinates 50oW and 25oS. As expected, these coordinates are as near to the disaster zone as the limited spatial resolution of the gridded data permits. Note that all but one decision nodes are also associated with omega, at different pressure levels but always in the vicinity of the affected area. These results highlight the key role played in the episode of extreme rainfall in Santa Catarina 2008 by the vertical transport of the moisture, brought from the ocean by sustained easterly winds. As a predictor, the tree was able to forecast 100% of the cases of extreme rainfall during the evaluation years (1999, 2007-2010), including the episode occurred in July 2008.
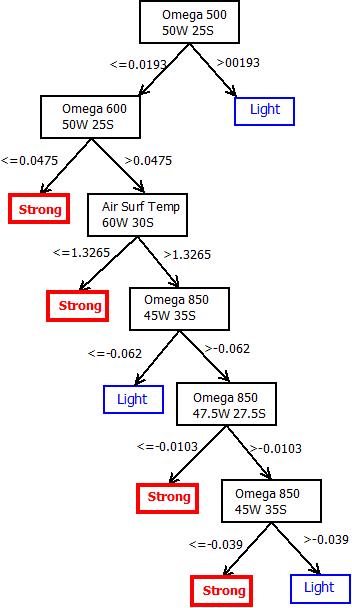 | Figure 5. Decision tree generated: training set from 2000 up to 2006; test set:1999, 2007-2010 |
3.2. Amazon Droughts
- This analysis has used climatological data covering the period from January 1999 up to December 2010. Monthly anomalies were computed relative to the mean values over the period. The entire data set used in this illustrative study comprises 44,269 time series. The dataset also includes time series of the El Niño Southern Oscillation (ENSO) indices [21], the North Atlantic Oscillation (NAO) index (http://ossfoundation.us/projects/environment/global-warming/north-atlantic-oscillation-nao). Gridded data cover a region delimited by latitudes 40oN and 40oS and longitudes 140oW and 0oW.
3.2.1. Class-Comparison
- Class-classification was based on a time series of monthly accumulated precipitation anomalies [22], averaged over the area delimited by latitudes 4oS and 8oS and longitudes 68oW and 72oW. This time series was used as proxy of drought in our analysis. This region, located in the south-western Amazon (indicated by a red square in Figures 6 to 9), was strongly affected by the droughts of 2005 and 2010 [23]. In this time series, the range of anomalies was split into 3 sub-classes: “dry”, “neutral” and “wet”. To this end, the interval is divided between the highest and the lowest precipitation anomaly into three parts, assigning the upper and lower 37% bins to the “wet” and “dry” classes, respectively, and the remaining 26% to the “neutral” class. The results represents class comparison between ''dry'' and ''neutral'' classes.
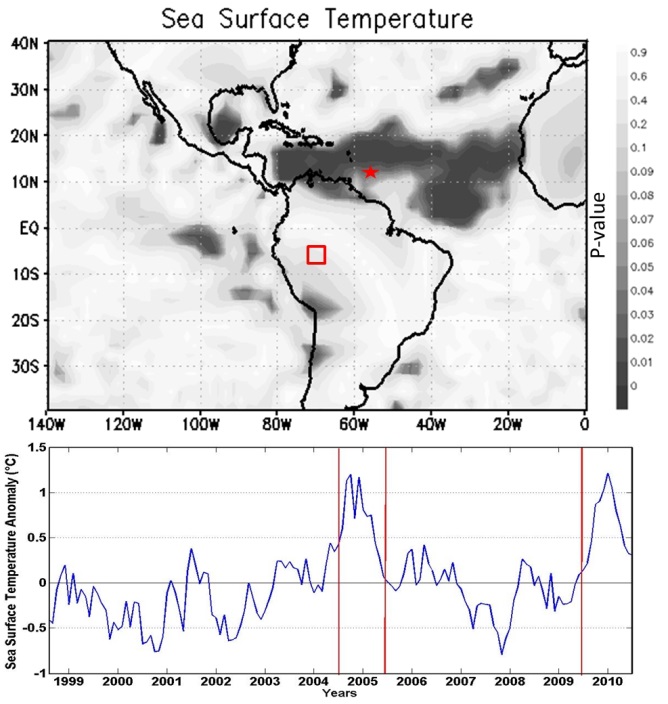 | Figure 6. p-value field for sea-surface temperature anomaly. Below: SST anomaly temporal evolution at 12.5oN-55.5oW (red star), from 1999 to 2010 |
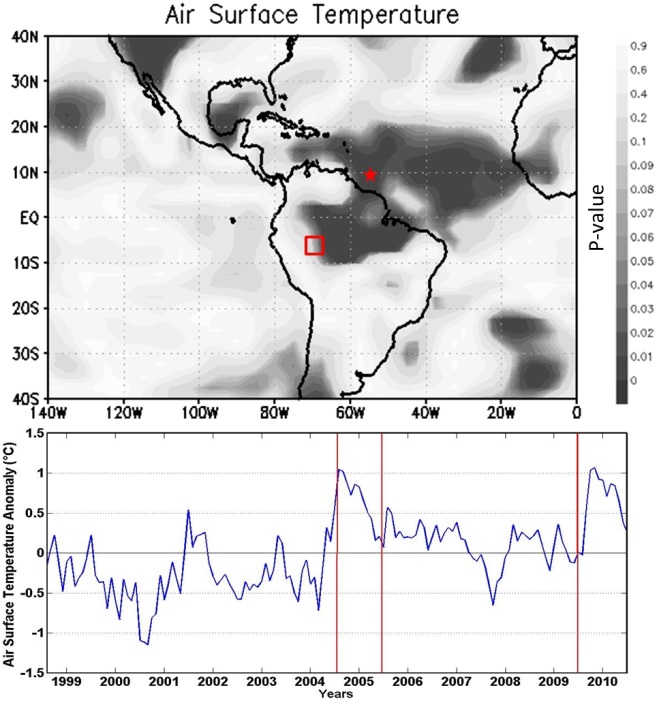 | Figure 7. p-value field for air-surface temperature anomaly. Below: air-surface anomaly temporal evolution at 10oN-55oW (red star), from 1999 to 2010 |
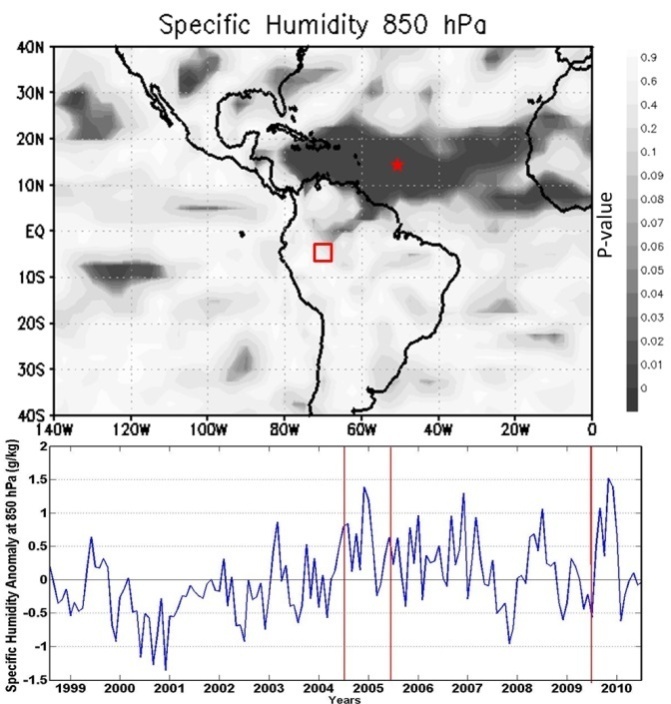 | Figure 8. p-value field for specific humidity anomaly at 850 hPa. Below: specific humidity anomaly evolution at 15oN-50oW (red star), from1999 to 2010 |
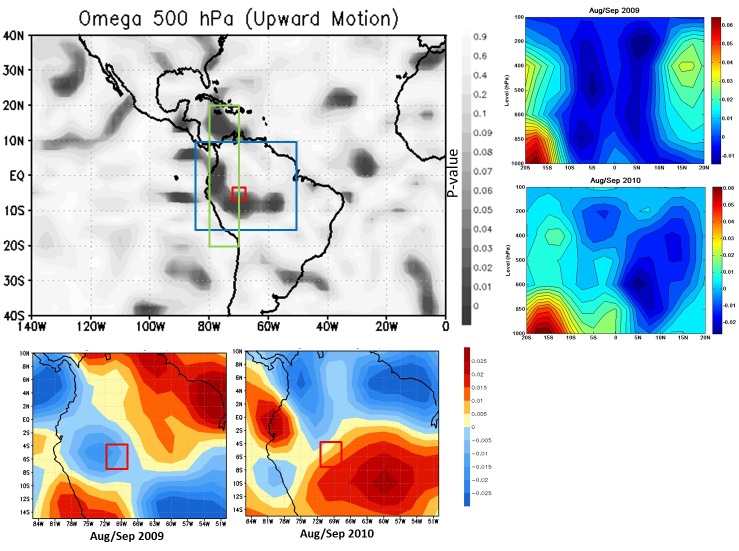 | Figure 9. p-value field for omega (upward motion) anomaly at 500 hPa. Below: pressure difference between grid points 15oN-50 oW (red star) and 5 oS-60 oW (blue full circle), from 1999 to 2010 |
3.2.2. Decision Tree
- The decision tree was generated using 120 variables with lower p-values identified by the class-comparison methodology describe in the previous section. To this end, the proxy precipitation anomaly time series was divided into two classes according to the median: “dry” (values below the median), and “wet” (values above the median). The training set comprised data from 1999 to 2004. The period from 2005 to 2010 was used for evaluating the predictive performance of the tree. The resulting tree has 7 leafs (4 “dry” and 3 “wet”) and 6 decision notes. Surprisingly, the variable with the highest information gain is the zonal wind at 200 hPa, at coordinates 72.5oW and 25oN.This variable, together with a large area of zonal wind anomalies in North Atlantic, has indeed a very low p-value, as shown in Fig. 11 (red star). This result supports recent claims [25-28] that the recent episodes of intense drought in the Amazon are linked to the northwest displacement of the ITCZ. In 2010, for example, the ITCZ was displaced approximately five degrees northward from its climatic position [27]. Overall, the tree had hit rate of 83%, misclassifying only two months during the extreme drought periods of 2005 and 2010.
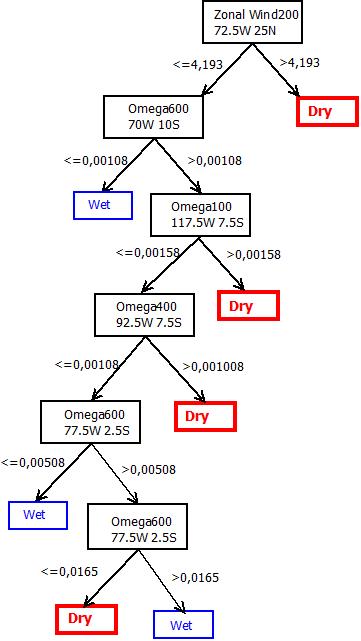 | Figure 10. Decision tree generated: training set from 1999 up to 2004; test from 2005 up to 2010 |
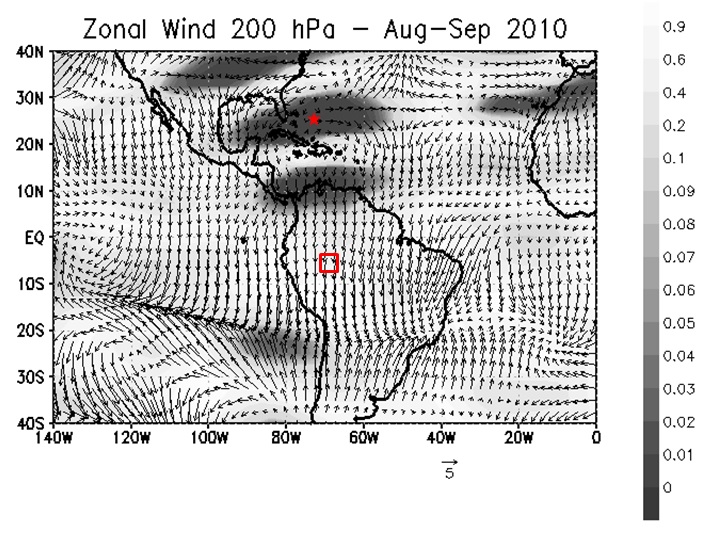 | Figure 11. p-value field for zonal wind at 200 hPa; August September 2010 average wind anomaly superimposed |
4. Conclusions
- In this study, two techniques for data mining were used to investigate the climatic causes of two kinds of extreme events occurred in Brazil during the last decade: the Santa Catarina 2008 extreme rainfall tragedy and the Amazon droughts of 2005 and 2010. In both cases, our results are in good agreement with analyses published in the literature. The class-comparison methodology was able to greatly reduce the size of the original data set, from the order of thousands of variables to a few tenths. The decision trees generated from the results of the class-comparison step were able to correctly classify/predict a high percentage of cases of extreme rainfall in Santa Catarina (100%) and of drought in the Amazon (83%). Overall, the data mining procedure here introduced has shown to be a promising approach in the investigation of climatic extreme events and the extraction of knowledge from large and complex data sets.
ACKNOWLEDGEMENTs
- This work was supported by grants from Brazil's CAPES, Ministry of Education; and CNPq, Ministry of Science and Technology. Analyses were performed using BRB-Array Tools developed by Dr. Richard Simon and BRB-Array Tools Development Team.