-
Paper Information
- Next Paper
- Previous Paper
- Paper Submission
-
Journal Information
- About This Journal
- Editorial Board
- Current Issue
- Archive
- Author Guidelines
- Contact Us
American Journal of Environmental Engineering
p-ISSN: 2166-4633 e-ISSN: 2166-465X
2015; 5(1A): 85-95
doi:10.5923/s.ajee.201501.12
Trends and Decadal Variability in Air Temperature over Southern Brazil
 Abstract
 Reference
 Full-Text PDF
 Full-text HTML
Flávia V. Rosso 1, Nathalie T. Boiaski 1, Simone E. T. Ferraz 1, Candida F. Dewes 2, Jonatan D. Tatsch 1
1Departamento de Física, Universidade Federal de Santa Maria, Santa Maria, RS, Brasil
2Department of Environmental Sciences, University of Virginia, Charlottesville, VA, USA
Correspondence to: Simone E. T. Ferraz , Departamento de Física, Universidade Federal de Santa Maria, Santa Maria, RS, Brasil.
| Email: |  |
Copyright © 2015 Scientific & Academic Publishing. All Rights Reserved.
This study presents an investigation on the decadal variability of maximum (Tmax) and minimum (Tmin) air temperature in southern Brazil during the period 1961-2011. Daily data from 26 meteorological stations, obtained from Brazil’s National Meteorology Institute (INMET), were used to calculate annual and decadal means and standard deviations. From the annual statistics we computed linear trends in Tmin, Tmax and daily temperature range (DTR). The decadal means were used to compute changes in Tmax and Tmin. Annual anomalies were obtained by removing the climatology for 1961-2011. Results show that most of the region experienced a statistically significant increase in both Tmin and Tmax, i.e. nights as well as days are becoming hotter. The increase in Tmin is however more pronounced than in Tmax, resulting in a decrease in DTR. Of particular notice were the increases in Tmin over the state of Paraná and in Tmax along the southern Brazilian coast. Trends in standard deviations show asignificant increase in the amplitude of variability of Tmin for most of the region’s stations. Overall, there was a cooling period during the 1960s and 70s. From the early 1980s until early 90s we observed a sharp and unprecedented warming in both Tmin and Tmax time series. After 1993 the Tmax and Tmin anomalies are relatively smaller in magnitude and, in the last eight years of the record, temperatures remained near the climatological average. These results suggest a halt in the overallwarming trend over southern Brazil after mid-2003.
Keywords: Temperature, Trends, Decadal Variability, Climate Change, Southern Brazil, Global Warming Hiatus
Cite this paper: Flávia V. Rosso , Nathalie T. Boiaski , Simone E. T. Ferraz , Candida F. Dewes , Jonatan D. Tatsch , Trends and Decadal Variability in Air Temperature over Southern Brazil, American Journal of Environmental Engineering, Vol. 5 No. 1A, 2015, pp. 85-95. doi: 10.5923/s.ajee.201501.12.
Article Outline
1. Introduction
- Since the 18th century’s Industrial Revolution and the increasing use of fossil fuels, we have observed a steady increase in the concentration of greenhouse gases and aerosols in the atmosphere. In 2011, the concentration of carbon dioxide, methane, and nitrous oxide had surpassed pre-industrial levels by 40%, 150%, and 20%, respectively. Changes in land use such as deforestation and urbanization, concomitant with the warming atmosphere, have been affecting the global climate and its natural variability. The changes we observe in the climate are therefore a combination of anthropogenic and natural forcing effects [7].Hundreds of studies report significant changes in climate all over the planet [5-7], acknowledging an ongoing global climate change in which the elements air temperature and precipitation appear to be the most affected ones [14]. These changes have very diverse regional manifestations, with varying magnitudes and spatial distributions in precipitation patterns, temperature changes, sea level rise, etc. [13].Changes in air temperature are responsible for environmental, social, political, and economic impacts. Southern Brazil as a region is largely dependent on agriculture and contributes substantially to the national production. This highlights the importance of understanding decadal variability patterns in temperature and detecting changes manifested in the record. Thus, we aim here to report the observed trends and decadal changes in maximum and minimum temperatures and in daily temperature range over Southern Brazil between 1961 and 2011.
2. Climate Variability and Change
- According to the IPCC AR5 [7], the average global temperature increased 0.85 ºC over the period between 1880 and 2012, and it is extremely likely that more than half of this warming is due to the increase in anthropogenic greenhouse gas emissions.On the global scale, the 1990s was the warmest decade since measurements began at the end of the 19th century. At +0.54 °C above the climatological average (1961-1990 being the reference period), 1998 was the hottest year. 2005 came in second, at +0.48°C above normal, and 2003 in third at +0.44 °C.Studies investigating air temperature trends over South America, using station data, are generally limited to the period 1960-2000. The most remarkable findings are those related to indices based on minimum temperatures, showing significant increases in number of hot nights and decrease in number of cold nights [11, 15]. On the other hand, Rusticucci e Barrucand (2004) presented a detailed analysis of temperature extremes over Argentina between 1959 and 1998, showing negative trends in summertime maximum temperatures in the northern part of this country.The average temperature in Brazil has increased approximately 0.75 °C up to the end of the 20th century, relative to the 1961-1990 norm of 24.9 °C (countrywide) [8]. A regional study focused on maximum air temperatures in the state of São Paulo [2], showing trends towards warmer atmospheric conditions. Blain et al. (2009) used parametric and non-parametric statistics to show significant increases in minimum temperatures for the same state.Marengo e Camargo (2008) analyzed trends in minimum and maximum temperatures and in daily temperature ranges (DTR) from 27 stations in southern Brazil between 1960 and 2002. They found systematic warming at both annual and seasonal scales, and a strong trend towards lower DTRs, suggesting that increases in minimum temperatures are higher than in maximum temperatures, especially during summertime.In a more recent study, England et al (2014) report that, despite the continuous increase in the concentration of greenhouse gases in the atmosphere, the mean global air temperature has remained approximately constant since 2001. A variety of mechanisms has been proposed to explain this slowdown of global warming, the main one being a higher absorption of heat by the oceans. At the same time, cooler sea surface temperatures are observed in the Eastern Pacific, possibly associated with a negative phase in the Pacific Decadal Oscillation (PDO), but it is not clear how the ocean has remained relatively colder in that sector despite the continuous increase in radiative forcings.
3. Methods
- We used daily maximum (Tmax) and minimum (Tmin) air temperature from 26 meteorological stations in southern Brazil, made available by the National Meteorology Institute (INMET), covering a period of 51 years (1961-2011). Gaps in the data were left unfilled in order to not introduce bias, only spurious values were eliminated. From these we computed daily temperature ranges (DTR), and then the annual and decadal means in Tmax, Tmin, and DTR for each station. We used simple linear regressions to compute trends in Tmin, Tmax, and DTR annual means and also in their annual standard variations. Statistical significance of these trends was assessed via t-Student tests. Next we computed decadal differences in Tmin and Tmax, also applying the t-Student test for statistical significance of these differences. Finally, we computed the annual anomalies in Tmin and Tmax for the region of southern Brazil, by removing the climatology for 1961-2011 and applying a 5-year running mean to better identify when decadal changes occurred.
4. Results and Discussion
4.1. Trends
- In the following maps we indicate stations presenting trends higher (lower) than +0.1 (-0.1) °C/51 years. Figure 1a shows stations with trends in Tmin. Filled circles represent trends significant to the 90% level according to the t-Student test. Overall the region presents a statistically significant positive trend in Tmin that is more pronounced over the state of Paraná. Few stations show negative trends and these are mostly over the state of Rio Grande do Sul. Figure 1b shows trends in Tmax, and again most stations present significant positive trends. Only the Campo Mourão station in Paraná shows a significant negative trend. Trends in DTR are presented in Figure 1c; mostly negative trends are observed, the largest value found for Urussunga, though a particularly large positive trend was found for the Rio Grande station. We can say, however, that DTR has generally decreased over southern Brazil throughout this 51-year period. These results are consistent with findings reported by Marengo and Camargo (2008).
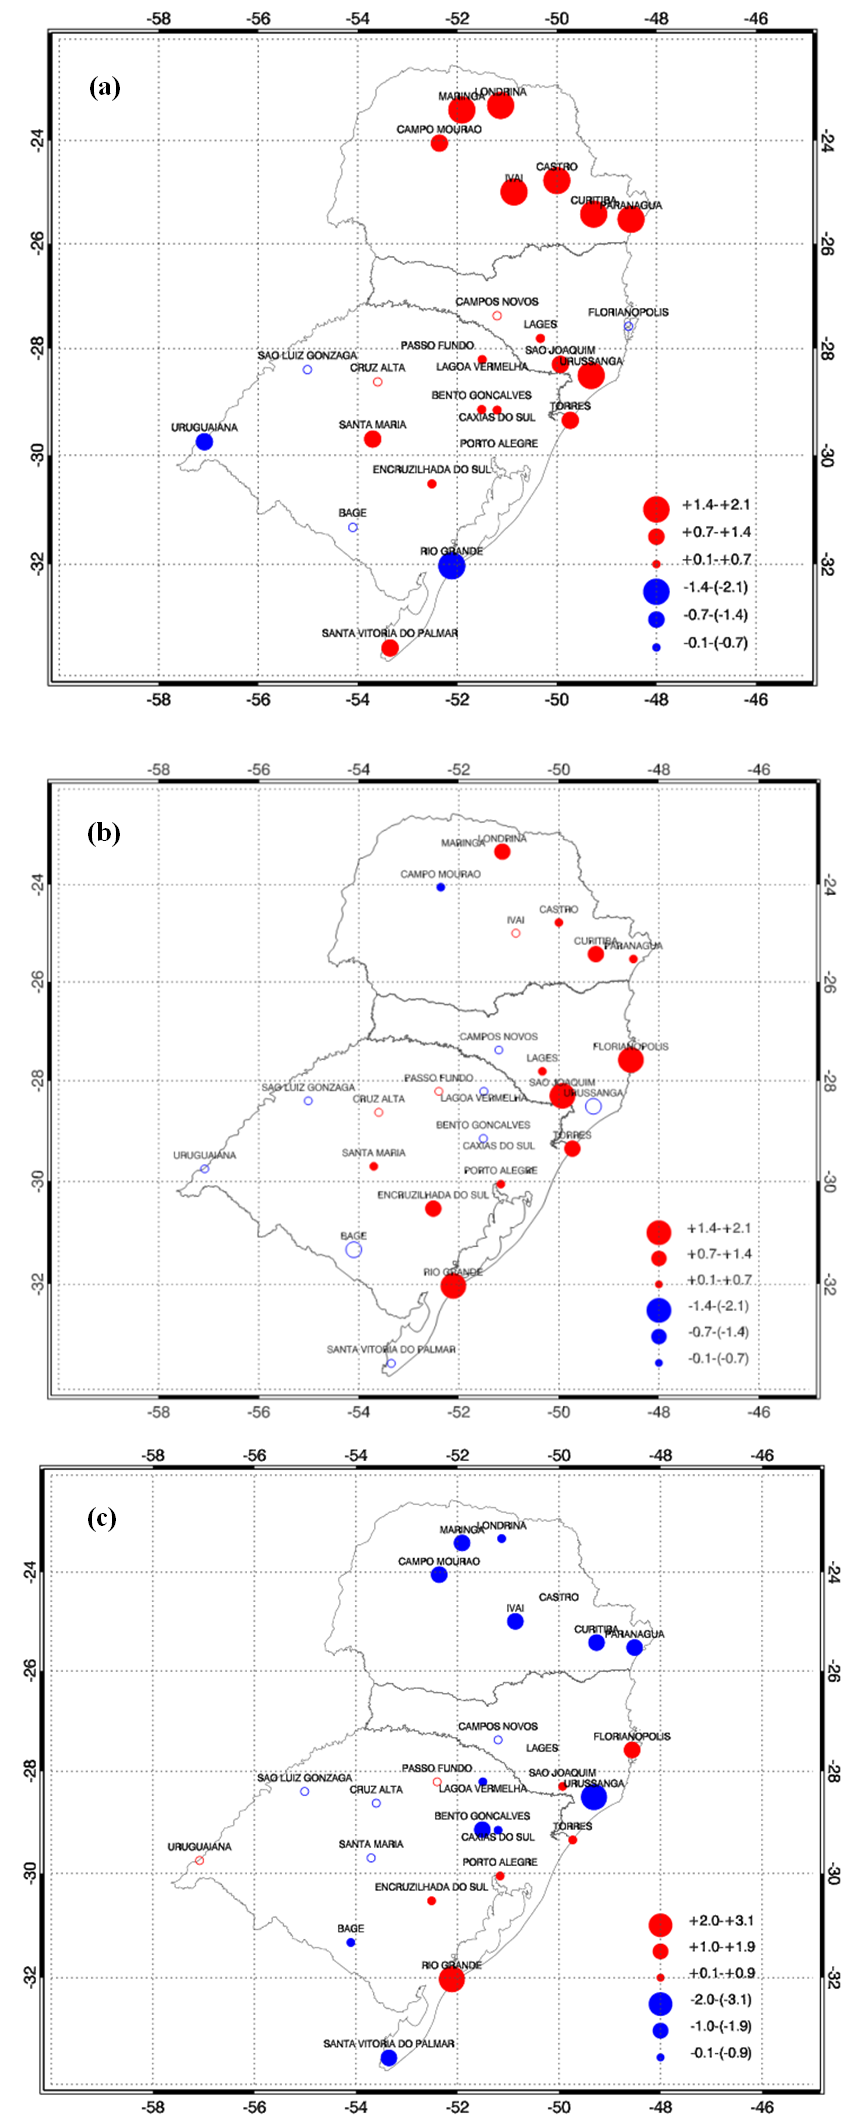 | Figure 1. Trends in Tmin (a), Tmax (b) and DTR (c) over southern Brazil for 1961-2011 (ºC/ 51 years). Filled circles represent trends significant to the 90% level (t-Student test) |
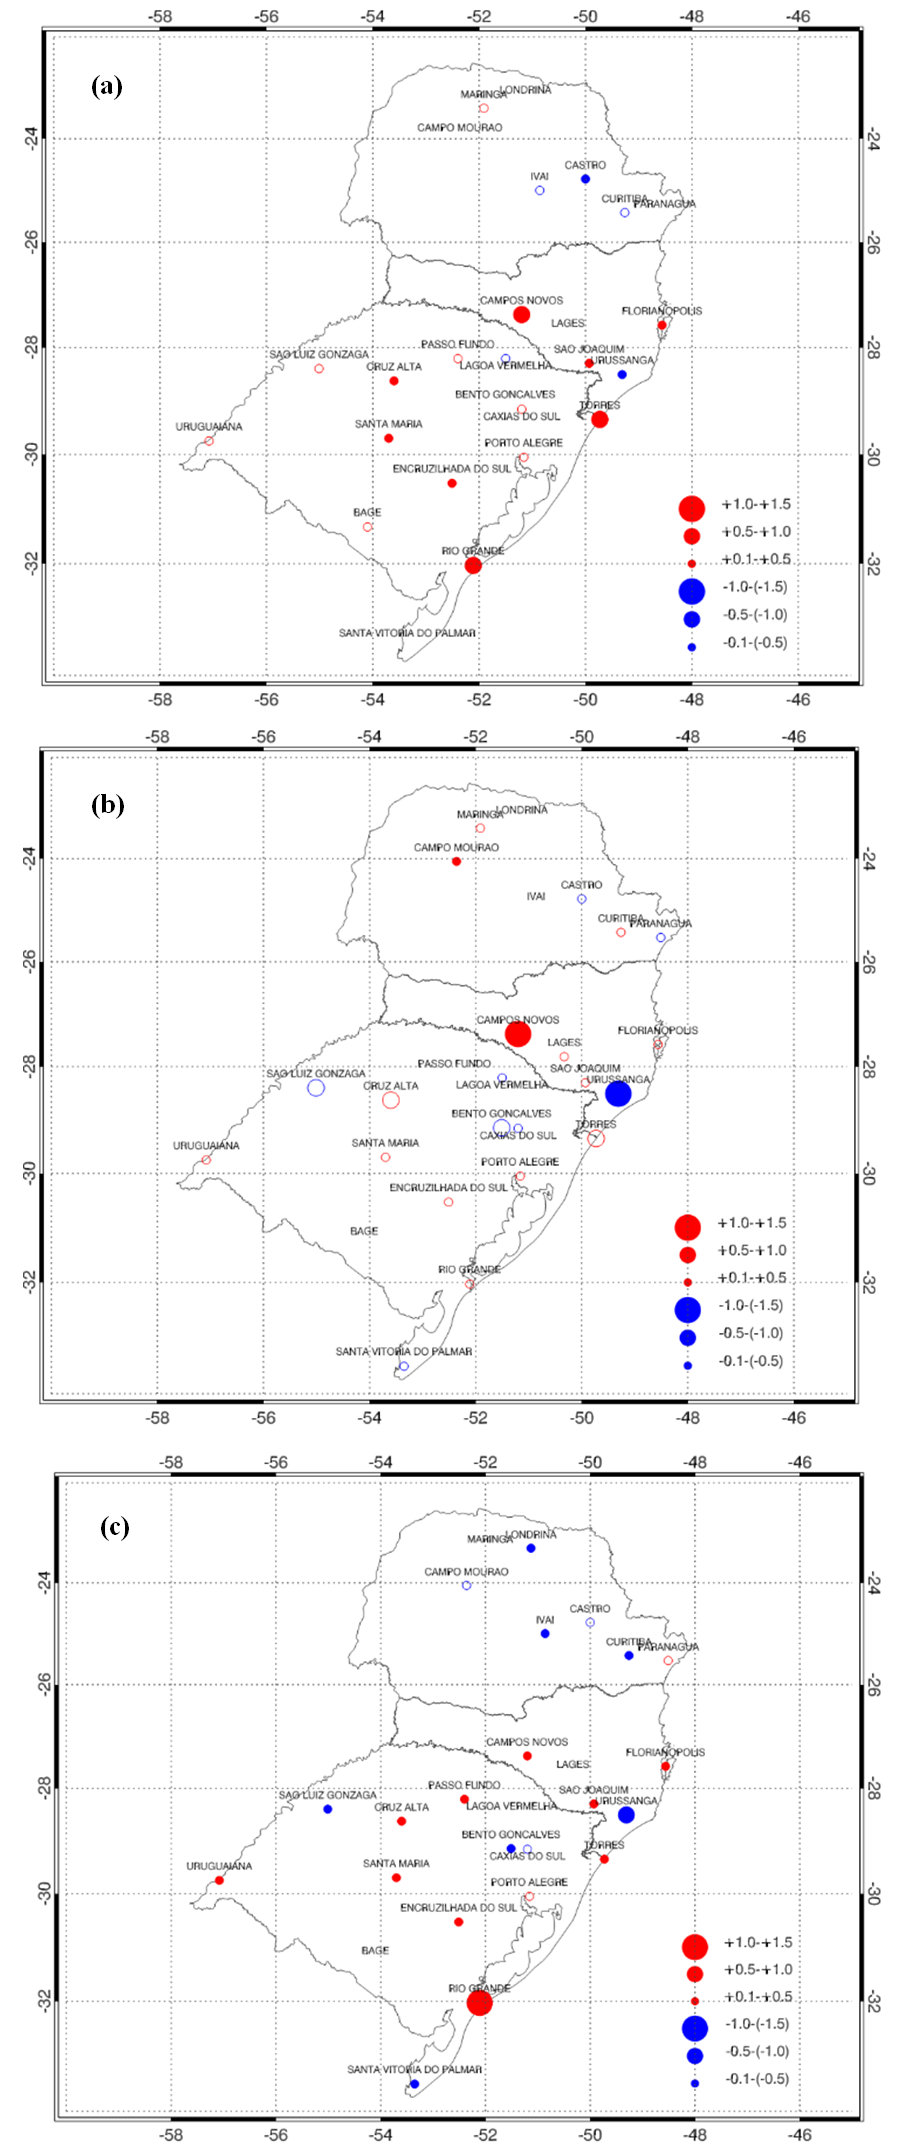 | Figure 2. Trends in standard deviations of Tmin (a), Tmax (b) and DTR (c) over southern Brazil for 1961-2011 (ºC/ 51 years). Filled circles represent trends significant to the 90% level (t-Student test) |
4.2. Decadal Differences
- In Figure 3 we present the decadal differences for Tmax. Between 1970 and 1960 (Figure 3a) we note generalized heterogeneity and most stations presented significant differences. For the 1980-1970 differences (Figure 3b), there was an overall increase in Tmax over the state of Rio Grande do Sul, though this increase is not statistically significant. Some stations in Paraná show a significant decrease in Tmax for the same period. In Figure 3c we show differences in Tmax between 1990-1980, where we point out an inversion of the pattern previously observed. Non-significant decrease in Tmax is observed in the south, and significant increase is noted over Paraná. The last decadal differences, 2000-1990, are shown in Figure 3d, and we observe a generalized significant increase in Tmax over the entire region.
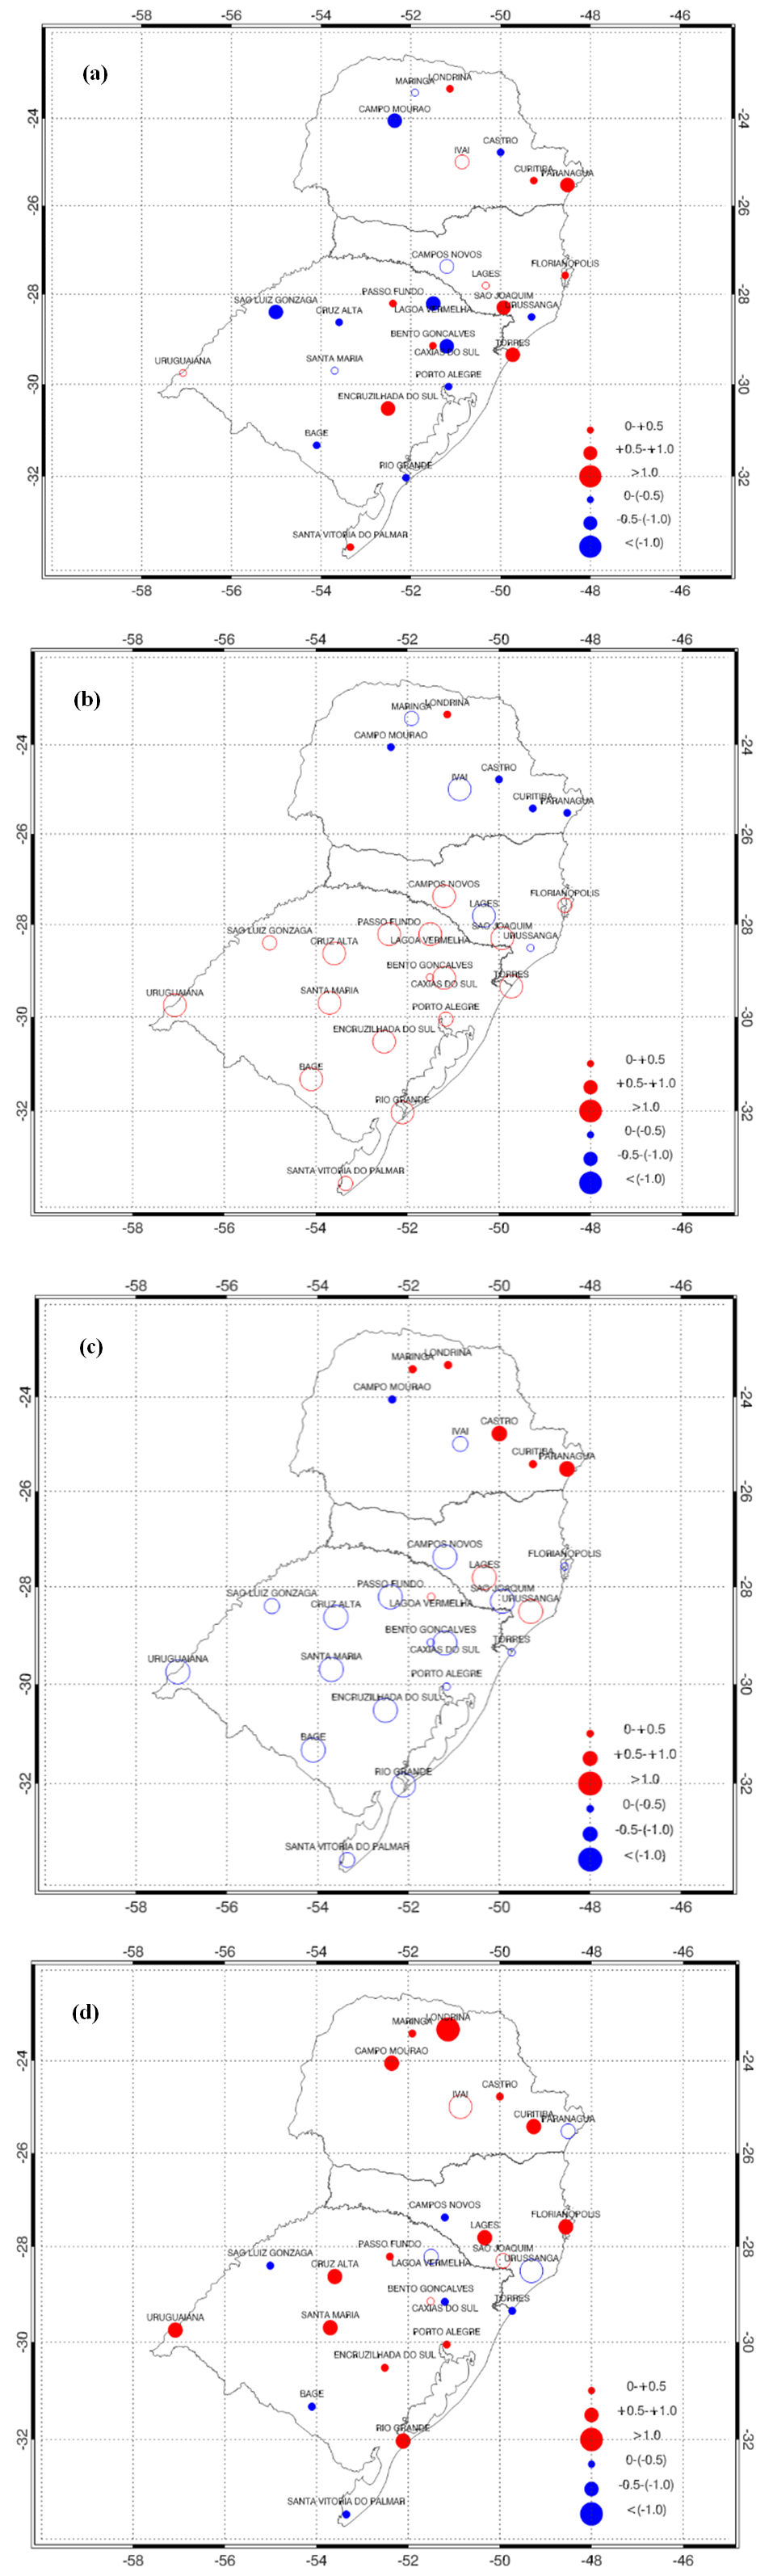 | Figure 3. Decadal differences in Tmax: 1970-1960 (a), 1980-1970 (b), 1990-1980 (c) e 2000-1990 (d). Filled circles represent differences significant to the 95% level (t-Student test) |
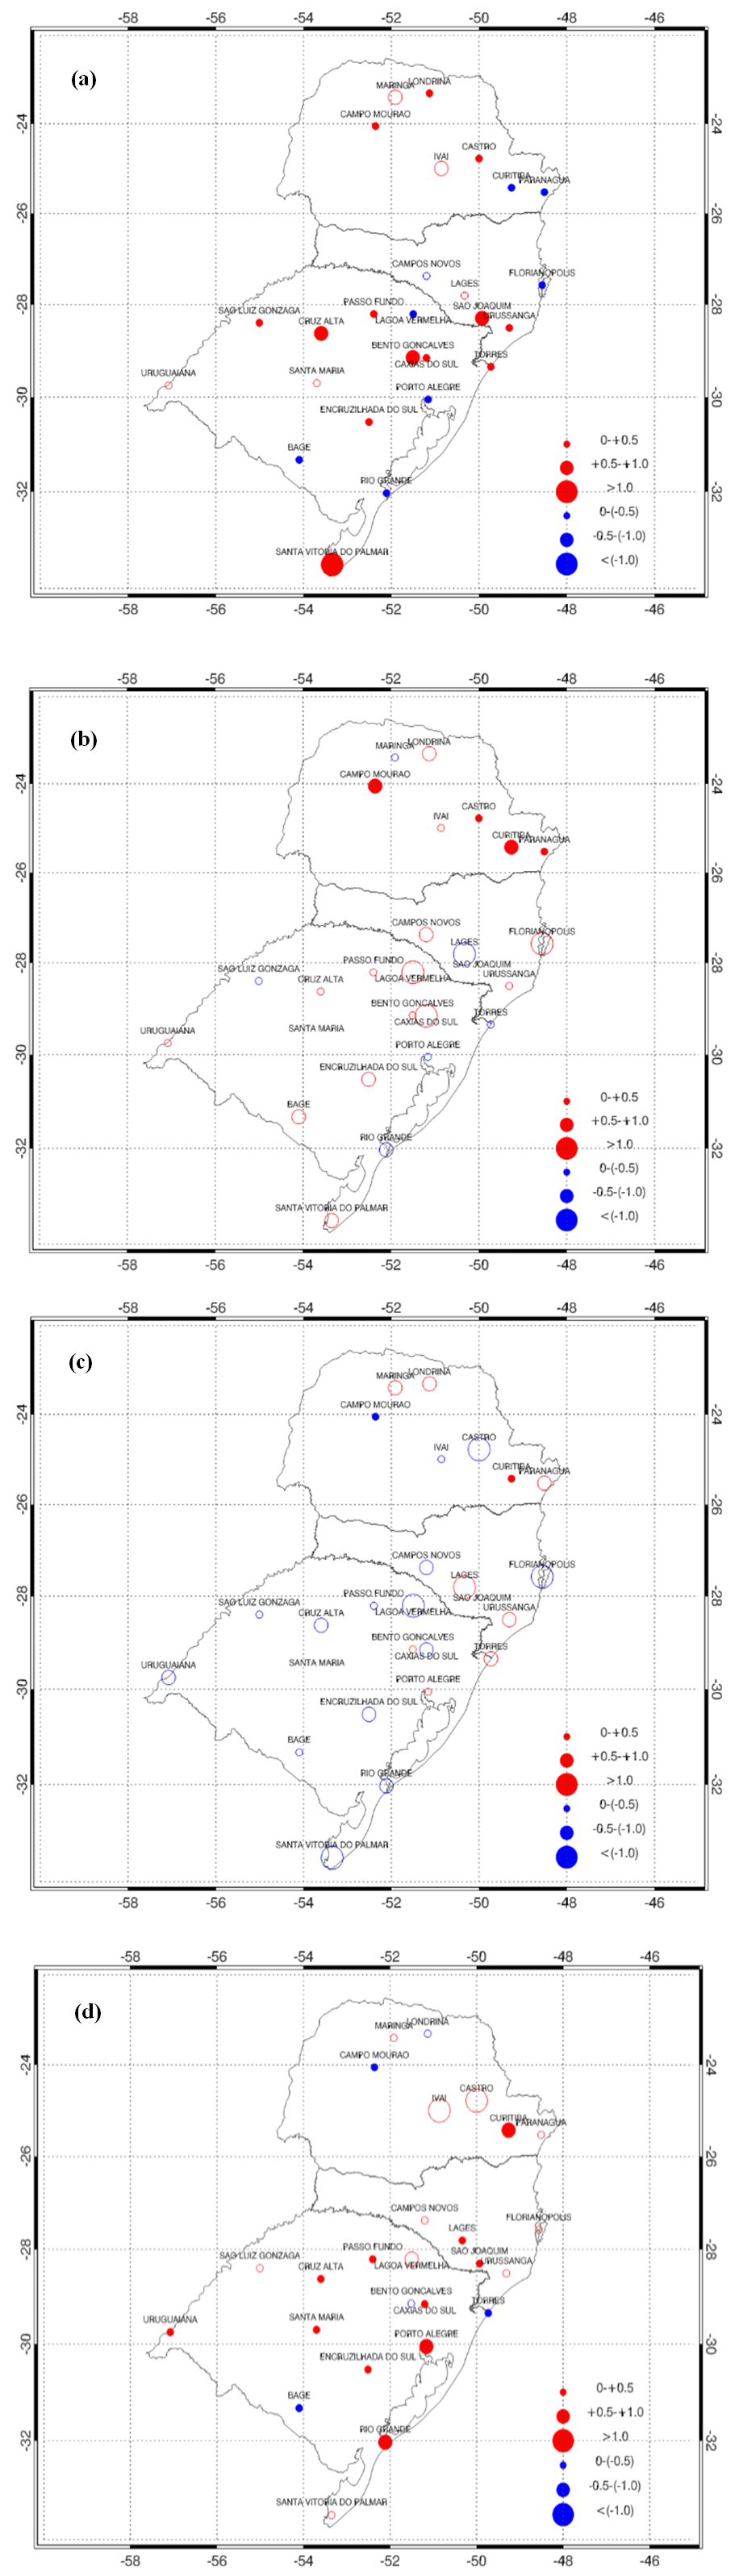 | Figure 4. Decadal differences in Tmin: 1970-1960 (a), 1980-1970 (b), 1990-1980 (c) e 2000-1990 (d). Filled circles represent differences significant to the 95% level (t-Student test) |
4.3. Temperature Anomalies
- In this section we present the regional Tmin (Figure 5) and Tmax (Figure 6) anomalies relative to the 1960-2011 reference period and their 5-year running means. We note that, from the 1960s until the end of the 1970s, Tmin anomalies remained negative, but from the 1980s to the early 1990s they were mostly positive. For the regional average, this was the warmest period considering Tmin. In the mid-1990s Tmin remained normal, showing slightly warmer anomalies in the early 2000s, then back to normal conditions for the remainder of the record.
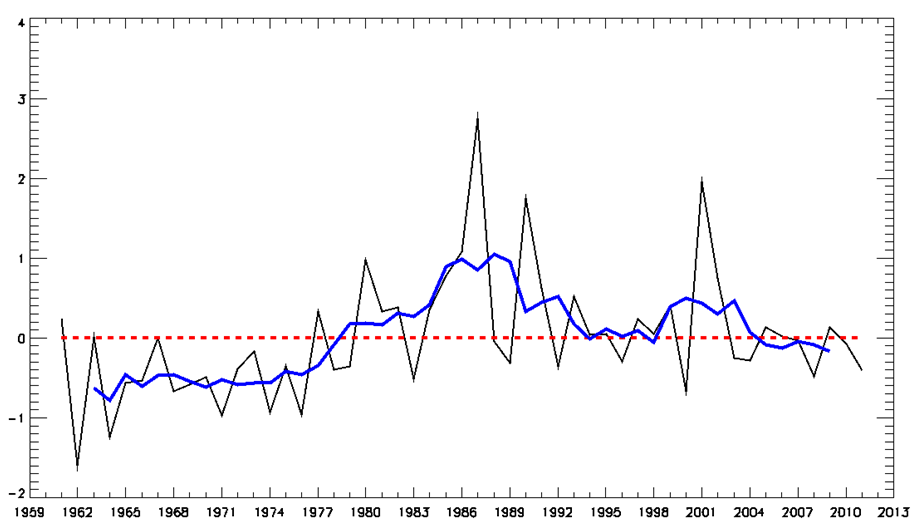 | Figure 5. Tmin anomalies (°C) over southern Brazil (black line), and their 5-year running mean (blue line) |
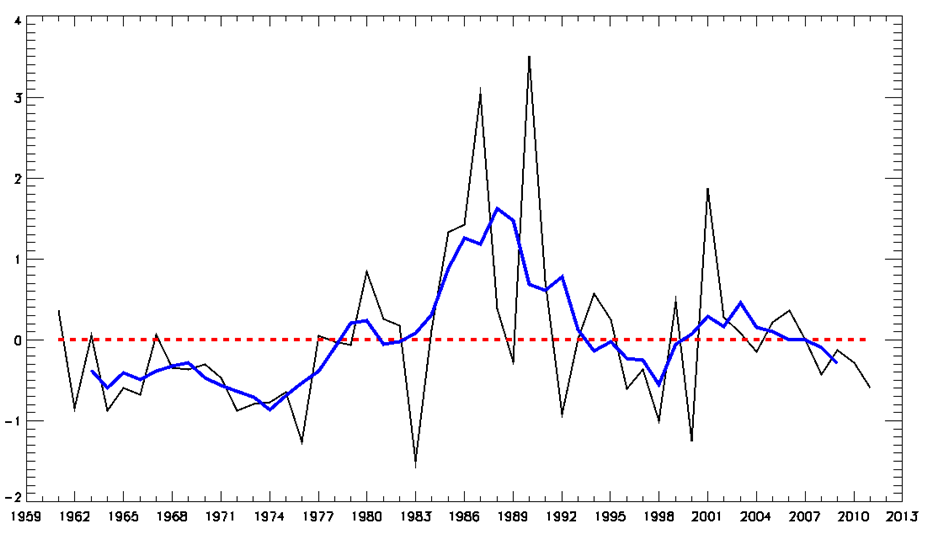 | Figure 6. Tmax anomalies (°C) over southern Brazil (black line), and their 5-year running mean (blue line) |
- The Tmax anomalies indicate a similar pattern, with cooler (negative) anomalies in the 1960s and 70s, and strong warming in the 1980s. Slight cooling was observed in the mid-1990s, but after that Tmax remained close to normal, albeit with large variability.
5. Conclusions
- Most of the southern Brazil region presented statistically significant increases in both minimum and maximum temperatures, meaning both nights and days are becoming warmer. However the increase in Tmin was more prominent than the increase in Tmax, which is reflected in the overall decrease in daily temperature range. Of particular notice were the increases in Tmin over the state of Paraná and in Tmax along the southern Brazilian coast.The trends in standard deviations show a significant increase in the amplitude of variability of Tmin for most of the region’s stations throughout the record period. We highlight that, despite the magnitude of trends being small, they are significant for higher amplitude of variations in DTR in the southern sector of this region, and for lower amplitudes in Paraná stations (the north).The largest increase in Tmax occured in the 2000s relative to the 1990s; whereas for Tmin the starkest increase happened in the 1970s, then followed by the 2000s.Overall, there was a cooling period during the 1960s and 70s. From the early 1980s until early 90s we observed a sharp and unprecedented warming in both Tmin and Tmax time series. After 1993 the Tmax and Tmin anomalies are relatively smaller in magnitude and, in the last eight years of the record, temperatures remained near the climatological average. These results suggest a halt in the overall warming trend over southern Brazil after mid-2003, which could be a regional reflection of England et al’s observation at the global scale.
ACKNOWLEDGEMENTS
- F. V. Rossois grateful for funding from CNPq (nº 180705/2014-8). N. T. Boiaskiis grateful for funding from CAPES and FAPERGS (grant numbers SPI nº 2793-25.51/12-4 and FPE nº 161/2011, respectively). J. D. Tatsch is grateful for funding from FAPERGS (nº 1988-2551/13-3). S. E. T. Ferraz is grateful for funding from FAPERGS (nº11/2033-8) and Fapesp (nº 08/58101-9).