Silvia Beatriz Alves Rolim 1, Gervásio Annes Degrazia 2, Marilei Bender Xavier 3, Cristiano Lima Hackmann 4, Waterloo Pereira Filho 5
1Programa de Pós-Graduação em Sensoriamento Remoto, Universidade Federal do Rio Grande do Sul (UFRGS) , Porto Alegre, RS
2Programa de Pós-Graduação em Física e Meteorologia, Universidade Federal de Santa Maria, Santa Maria, RS, (UFSM)
3Departamento de Matemática, Universidade de Santa Cruz do Sul (UNISC), RS
4Curso de Ciência e Tecnologia, Campus Tramandaí, Universidade Federal do Rio Grande do Sul (UFRGS), Porto Alegre, RS
5Departamento de Geociências, Universidade Federal de Santa Maria (UFSM), Santa Maria, RS
Correspondence to: Silvia Beatriz Alves Rolim , Programa de Pós-Graduação em Sensoriamento Remoto, Universidade Federal do Rio Grande do Sul (UFRGS) , Porto Alegre, RS.
| Email: |  |
Copyright © 2015 Scientific & Academic Publishing. All Rights Reserved.
Abstract
The water temperature is one of the key variables in the thermal regime of running water, since it influences the dynamics of aquatic ecosystems. A significant change of temperature of a water body modifies, directly or indirectly, its dynamics and may cause thermal variations along the longitudinal profile of the lake. In this perspective, the passage of a frontal system, can cause disturbances in surface temperature as a function of meteorology acting. The extreme south of Brazil is characterized by lagoons with different extensions, located in regions of difficult access. Comparative studies of surface temperature related to lagoons are few known. In this sense, this work presents a descriptive and comparative evaluation of surface temperature in a coastal lagoon in southern Brazil in two distinct periods, associated with the passage of frontal systems. The surface temperature response was measured from the MOD11 surface Temperature and Emissivity product of the Moderate Resolution Imaging Spectroradiometer (MODIS), aboard the orbital platform EOS-TERRA. The results represent an efficient and low cost alternative to measure the surface temperature of aquatic ecosystems of delicate environmental balance, without anthropic interference.
Keywords:
Orbital Sensor, Surface Temperature, Coastal Lagoon, Meteorology
Cite this paper: Silvia Beatriz Alves Rolim , Gervásio Annes Degrazia , Marilei Bender Xavier , Cristiano Lima Hackmann , Waterloo Pereira Filho , Remote Surface Temperature Measurements of a Coastal Lagoon in Southern Brazil: Periods of Winter and Summer, American Journal of Environmental Engineering, Vol. 5 No. 1A, 2015, pp. 78-84. doi: 10.5923/s.ajee.201501.11.
1. Introduction
The water temperature is one of the fundamental variables for balance and health of aquatic ecosystems. The thermal regime of water bodies influences the biological communities of aquatic life [10]. In this sense, it is obvious the importance of the study of the temperature variation in environmental control of surface water. According to [9] and [2], the variability and water temperature fluctuations can occur naturally, or as a result of several anthropic disturbances, such as the change of flow, thermal pollution, deforestation and climate change. A classification for these temperature fluctuations of water bodies is given by [3], and can be divided into three large groups: (i) atmospheric conditions; (ii) topography and (iii) bottom discharge of the water bodies. The weather conditions are one of the most important and the main responsible in the heat exchange processes occurring in surface water, including phase changes, solar radiation, among others [3].Air temperature (AT) is one of the most important factors of atmospheric conditions, because it exerts a direct influence on the temperature of the aquatic ecosystem and groundwater. Simultaneously, another meteorological factors can act on the temperature of water bodies, such as cloud cover, wind speed, vapor pressure and precipitation [5]. The thermodynamic regime and, therefore, the effect of temperature changes in water bodies take place initially on the surface of the water, through the process of solar irradiance. In this process, different from the soil and vegetation, most of the radiant flux incident on the water is not reflected, but absorbed or transmitted. Even so, it is possible to obtain relatively accurate measurements of the temperature of the water surface, through the radiance measurement registered by a remote sensor. Concerning to the orbital sensor, Moderate Resolution Imaging Spectroradiometer (MODIS) aboard the TERRA satellite measures surface temperature with an accuracy of 1 K, as an alternative data collection in hard-to-reach terrain. The observations of surface temperatures registered can reveal important patterns of changes in lagoons along time series. This work performs a comparative analysis of the surface temperature of a coastal lagoon (LST) in southern Brazil in two distinct periods: summer of 2005 [7], and winter of 2006. The analysis shows the differences of surface temperature in distinct periods associated with the meteorological parameters on passage of frontal systems (FS). The meteorological parameters considered in [7] were the speed of the wind and its direction. In this study, we included the air temperature (AT) in both summer and winter measurements. The mainly purpose of this study is to analyze the data consistence of MODIS sensor on the surface temperature monitoring of water bodies, as an alternative to field measurements, most of the time expensive, and with anthropic interference.
1.1. Study Area
As shown in Figure 1, the Mangueira lagoon is a freshwater ecosystem composed mainly by a shallow water body, with depths ranging between 1.5 and 6 m [4]. It has an elongated shape with 92 km, and a width ranging from 2 and 10 km. Its area is of 820 km² and stretches in the coastal area of southern Brazil, being located between the municipalities of Rio Grande and Santa Vitória do Palmar, in Rio Grande do Sul State (RS). This lagoon is part of the Hydrological System of the Taim Reserve, covering a total area of 2254 Km2.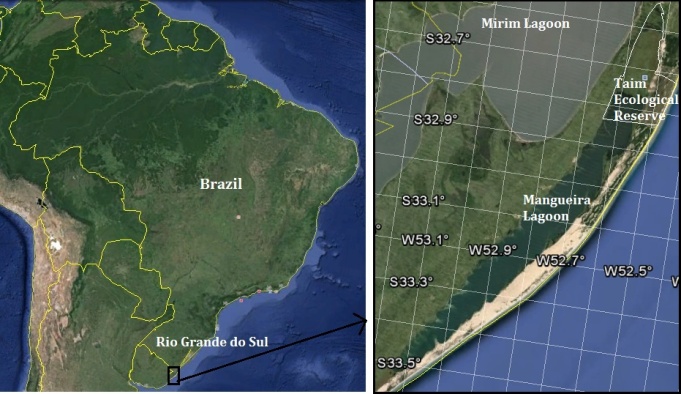 | Figure 1. Study area, Mangueira lagoon, Rio Grande do Sul, Brazil |
2. Methodology
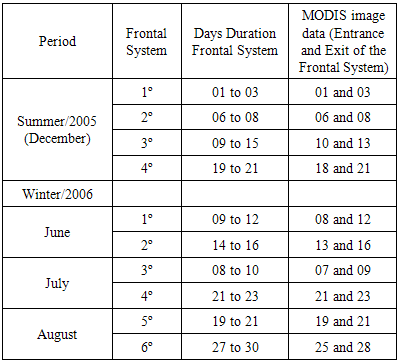
Measurements of surface temperature were obtained from the available products of MOD11 (Land surface temperature and Emissivity) of the MODIS sensor, aboard of EOS-TERRA satellite. The thermal infrared data were registered in the bands 31 (10.78 to 11.28 μm) and 32 (11.77 to 12.27 μm). The images were acquired for the dates of the passages of the frontal systems of the winter months (June/July/August) of 2006. The dates of the passages of the summer months (December) of 2005 were acquired from [7]. The Earth's surface temperature observations provided by MOD11 product (at 1 km resolution) are derived from the algorithm "generalized split-window" [8], which assumes a priori knowledge of the emissivity.According to [8], the surface temperature estimation of emissivity data is given by: where, T31 and T32 are the brightness temperatures in the band 31 and 32; ε = 0.5 (ε31 + ε32); and Δε = ε31 - ε32 are the emissivities of the surface in the bands 31 and 32; and C, A1, A2, A3, B1, B2, B3 are regression coefficients. It was traced a longitudinal profile (LP) towards NS direction on the images in order to analyze the LST variations. The meteorological data were extracted from meteorological observation station of Conventional Surface of Santa Vitória do Palmar (33° 31' 58.00'' S; 53° 20' 58.56'' O) which collects daily measurements of climate variables.This study considered the wind speed (m/s), its direction and the air temperature (AT). These variables are collected in three separate times: 12:00 pm, 6:00 pm and 00:00 am. The dates of the passages of the cold fronts were extracted from [1]. Six frontal systems were selected during the winter months of 2006 (June/July/August) in order to compare with the results of the four frontal systems of the summer [7].The images from the MODIS sensor were selected based on the cloud cover over the Mangueira lagoon, representing days of clear sky. It was selected images before and after the passages of the front in Santa Vitória do Palmar, RS. Table 1 shows the days duration of frontal systems for the two periods studied. Table 2 presents the daily averages of weather variables, wind (m/s) and (AT) °C, associated with the date of passage of frontal systems of [7] in summer of 2005. Table 3 indicates the cold fronts related to the weather data for the period of winter of 2006.
Table 1. Length of periods of frontal systems in the month of summer/ 2005 and in the winter months/2006
 |
| |
|
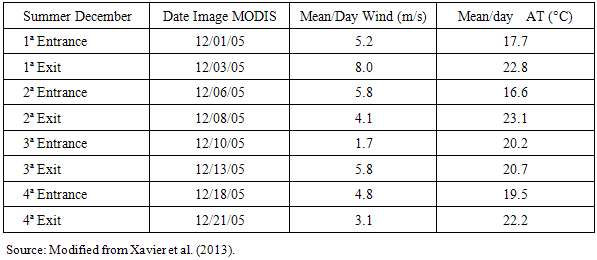
Table 2. Date of MODIS images on passage of frontal systems associated with the weather data
 |
| |
|
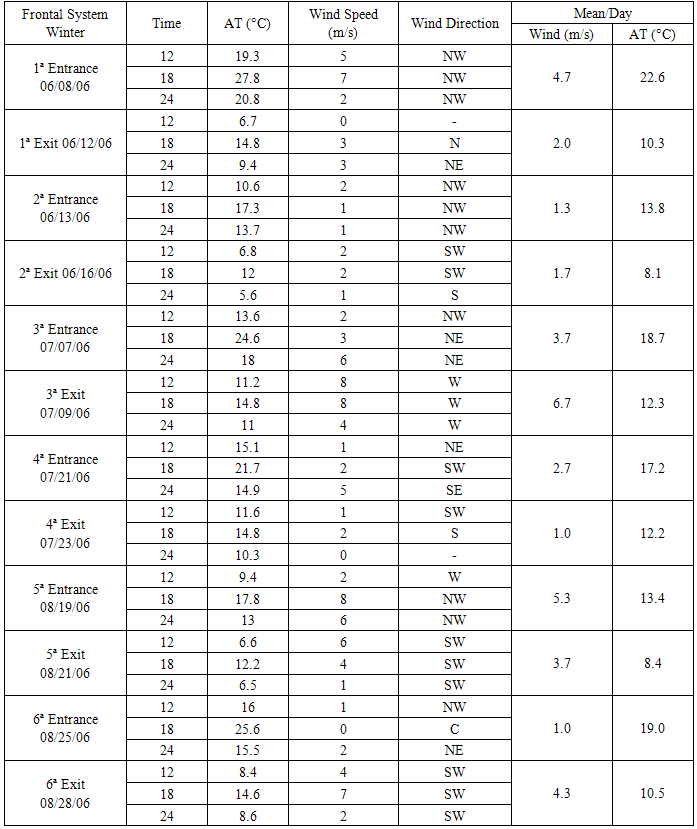
Table 3. Dates of MODIS images corresponding to the cold fronts and associated to meteorological data of Santa Vitória do Palmar, RS
 |
| |
|
3. Results
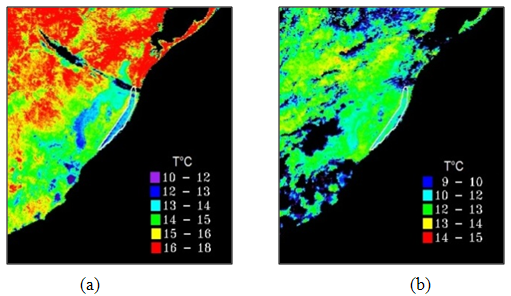
The analyses of four frontal systems in [7] revealed that the surface temperature of the Mangueira lagoon decreases after passage of these systems in December 2005. From a quantitative point of view, the central region of the lagoon, this decrease in temperature, up to 4 °C, generated a mean range from 2 °C throughout the SN profile. In this case, the highest surface temperature variations occurred with wind speeds from 7 to 9 m/s, and the smallest variations in the occurrence of light winds, from 1 to 5 m/s. These results can be found in Tables 2 and 3 [7]. In these tables it can be observed that the greatest variations of the surface temperature of the Mangueira lagoon (LST) occur at the exits of frontal systems and are associated with higher wind speeds. In this study, the air temperature is added as a supplement to the summer analysis of paper [7]. In Table 2, one can observe that in December, the largest variation of (LST) occurs in the exit of the third front system. This passage from the front is influenced by the highest mean wind speed (5.8 m/s) and by the high AT (mean of 20.7 °C) at the exit of the cold front. In Table 2, this study also shows that the air temperatures are elevated, particularly in the outputs of the frontal systems during December, and are associated with higher wind speeds (1st, 2nd and 3rd frontal systems).With respect to the winter months, Figures 2a, 2b; 3a, 3b; 4a, 4b; 5a, 5b; 6a, 6b; 7a, 7b represent initial and final passages of frontal systems which reach southern Brazil in the months of June, July and August 2006. In these Figures, the white tracing evidences the lagoon’s surface area. 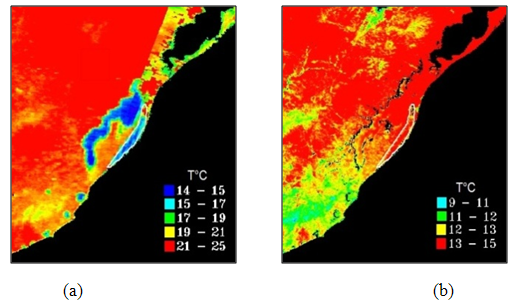 | Figure 2. 1º Frontal System (a) 06/08/06; (b) 06/12/06 |
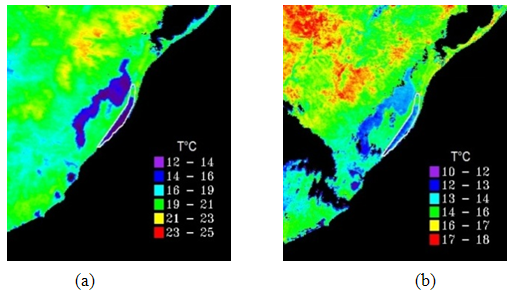
 | Figure 3. 2º Frontal System (a) 06/13/06; (b) 06/16/06 |
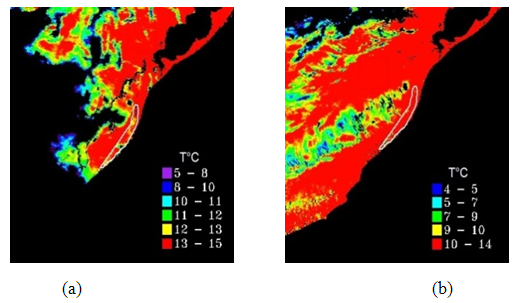
 | Figure 4. 3º Frontal System (a) 06/07/06; (b) 06/09/06 |
 | Figure 5. 4º Frontal System (a) 07/21/06; (b) 07/23/06 |
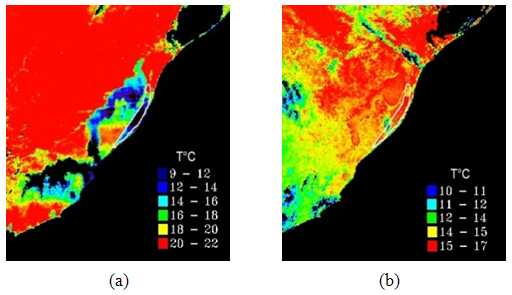
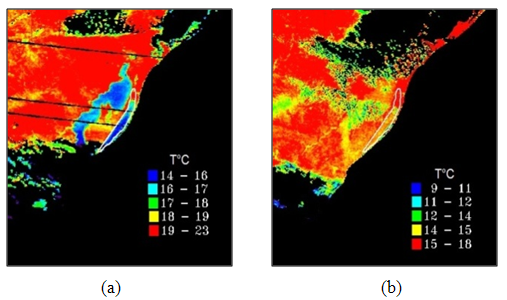
 | Figure 6. 5º Frontal System (a) 08/19/06; (b) 08/21/06 |
 | Figure 7. 6º Frontal System (a) 08/25/06; (b) 08/28/06 |
Figures 8, 9, 10, 11, 12, 13 display the longitudinal profile (LP) of LST. 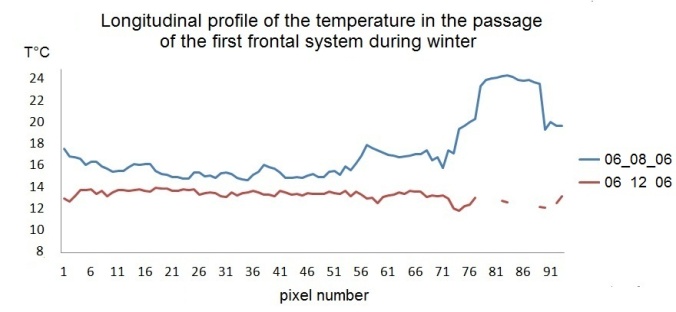 | Figure 8. Longitudinal profile: passage of the 1° FS |
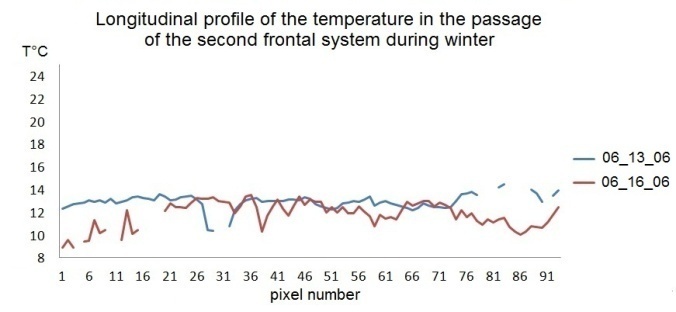 | Figure 9. Longitudinal profile: passage of the 2° FS |
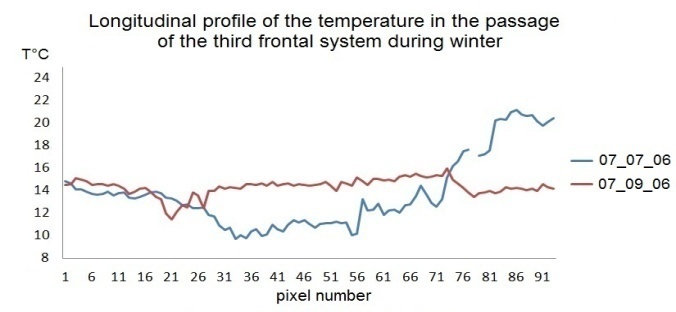 | Figure 10. Longitudinal profile: passage of the 3° FS |
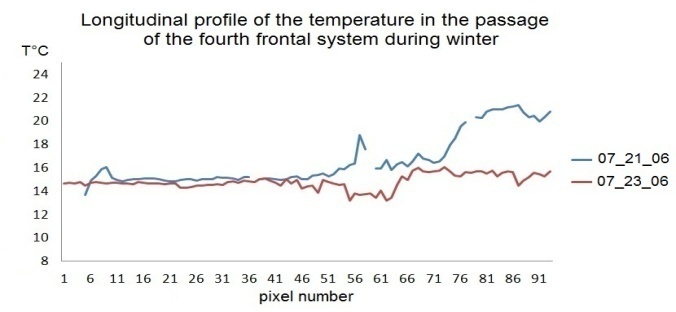 | Figure 11. Longitudinal profile: passage of the 4° FS |
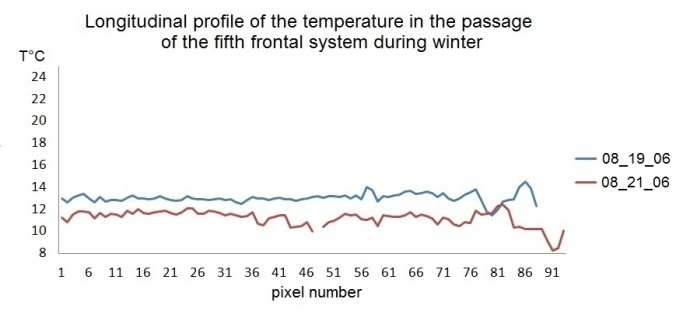 | Figure 12. Longitudinal profile: passage of the 5° FS |
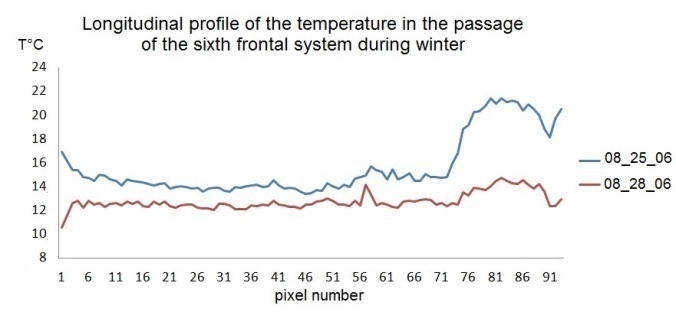 | Figure 13. Longitudinal profile: passage of the 6° FS |
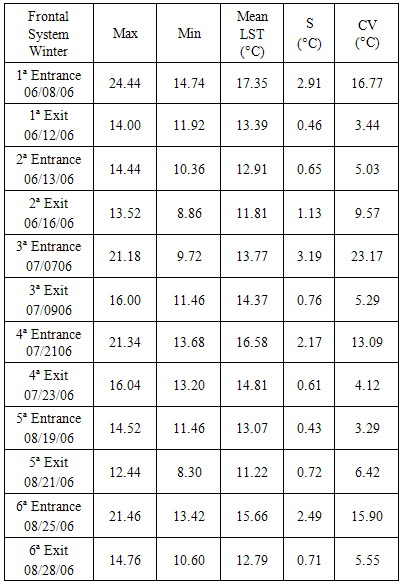
The first entry of cold snap (Figure 8) starts with a Northwest wind magnitude ranging between 5 and 7 m/s. In this process the LST presents mean of 17.35 °C and coefficients of variation (CV) of 17% (Table 4). This increase in LST can be associated with the AT ranging from 19 to 27°C. The output of this front is characterized by weaker winds, approximately 3 m/s and lower AT, generating fall of LST and lower variation along the SN profile.Table 4. Statistics of the surface temperature of the longitudinal profile (LP) of Mangueira lagoon during the entrance and exit of frontal systems in the winter months of 2006
 |
| |
|
During the passage of the second frontal system (Figure 9) occurs predominantly weak Northwest wind velocity, ranging from 1 to 2 m/s and low (AT). The output of this front is marked by the wind direction change Northwest to Southwest still weak with fall (AT), generating small drop of LST. The third cold front (Figure 10) shows that the LST increases after the passage of the cold front in the central region of the lagoon. Comparing this result with the values shown in Table 3, it is observed that during this event, the direction and speed of wind (Northwest/ Northeast, with a mean value of the order of 4.2 m/s), provoked the greatest fluctuations in the LST, with CV of 23.19%. Still, analyzing the AT (°C) for this event, there are high temperatures, with an average of 16.7 °C. This phenomenon of increased LST can be explained by the constant high temperature, which has occurred since the beginning of the arrival of the front. In this case, the relaxation time of LST response was not enough to cause the water cooling, at the exit of this cold front. The fourth cold front (Figure 11) induces little LST variation both in input as on the front exit. It is observed a low wind during the passage of the front as also a directional meander (Table 2). The AT presents itself with little variation, averaging 16 °C. The CV of 13.07% is justified by the surge of LST in the North of the Mangueira lagoon influenced by the Taim plated.In the fifth cold front (Figure 12) the LST is influenced by strong Northwest and Southwest winds in the front entrance and exit, respectively, with mean values of the order of 6 m/s and a low AT. The LST was lower at the exit of this front (of order 2 °C) and generated greater variation (CV of 6.42%) as shown in Table 4.During the passage of the sixth cold snap (Figure 13), there is a predominance of Southwest wind with speed ranging from 2 to 6 m/s, with the third largest variation of the LST, CV of 15.9% in the front entrance. The output of this front is marked by the SW wind with maximum magnitude of 7 m/s, generating fall of LST throughout the Southwest route of the lagoon.Remote results observed for the surface temperature of this water body in the winter months show that the strong winds and the AT tends to influence in order to generate greater variations in LST along the profile. The largest fluctuations of LST are under the influence of the strongest winds for the winter months and to high AT. In the winter months, the lagoon temperature shows strong winds, and an AT tending to generate higher variations in LST along the profile.The passage of the 1st frontal system (Figure 8) shows increase in variation of the LST at the front entrance, featuring CV of 17.0%. As the wind decreases, the LST suffers fall and stabilizes the CV at 3.41%. In the 3rd frontal system (Figure 10) it was noted the largest variation of the LST, with a CV of 23.19% at the entrance of the cold snap characterized by winds of around 4 m/s and AT with a mean of 16.7 °C. On the passage of 2nd and 4th frontal systems it is also observed lower variation of the LST, associated with the low speed of the winds about 1 and 2 m/s, in the input and output fronts (Figures 9 and 11). In these situations, wind power does not generate enough turbulent wave motion to create the mixture of the water body column. In this case, LST stabilizes because there is no turbulent motions. Thus, the observed effect of high LST variations, associated with strong winds and AT, may be explained by the fact that wind energy generates turbulent movements at the surface, which in turn, produces the movements of the background current resulting in the mixing of the water column. In this way, the LST becomes more unstable at the time of its register by MODIS sensor.
4. Discussion
This analysis shows that the lagoon's surface temperature decreases after passage of cold fronts in both periods studied and is related to the wind field originated in this process. The elevated surface temperature variation is observed in the summer period in the presence of strong winds and high air temperatures. During the winter the surface temperature variation is smaller and is connected with the lower wind speed and lower air temperature.
5. Conclusions
The results showed that the passage of a frontal system modifies the LST. The process of change is associated with the LST meteorological interactions of the study area. This result was showed in [7] in December 2005, and in this study, in the winter months of 2006. The investigation revealed a coherent relationship between the observed values of the LST with wind speed vector (direction and magnitude) and AT. This relationship was evident for both studied periods. The output cold snaps provoked a diminution of the LST during December (mean of 2 °C). In the winter months this mean was 1 °C.With respect to the winds, its strong presence, with well defined directions, causes large fluctuations in measurement of the LST. This robust advection, with magnitudes ranging between 5 and 8 m/s, is directionally persistent for hours in a preferred consolidated direction. In this case, the highest temperature fluctuations are a result of the water turbulence, thas causes further instability in the surface temperature. In December these fluctuations are larger than in the winter months because the wind has higher speeds in hot periods, as shown by the meteorological data in Tables 2 and 3. In December the largest variation of LST is displayed in the output of the third cold snap (Table 2). This front passage is influenced by the highest average wind speed (5.8 m/s) and high AT (mean 20.7° C) at the exit of the cold front. The results also reveal that in the winter months occur greater variation of the LST in higher AT before the passage of the cold front, as can be observed in the 3rd and 5th cold fronts. This turbulent air flow caused by the wind, just above the lagoon, transfers energy to the water surface generating turbulence and waves. Consequently, this turbulence on the surface of the lagoon can be the physical process responsible for causing fluctuations observed in the LST. The present study shows that the comparative analysis of remote measurements of surface temperature in lagoons, obtained by MODIS sensor, constitutes a viable and efficient tool to establish relationships between this variable and the meteorological parameters originated during the passage of frontal systems. In addition, this tool revealed actual behavior patterns of the Mangueira lagoon, which are consistent with the literature, as well as with the dynamics of meteorology acting on the surface of the water.
ACKNOWLEDGEMENTS
This work has been supported by the Brazilian Research Agencies Coordenação de Aperfeiçoamento de Pessoal de Ensino Superior (CAPES), and Fundação para Apoio da Pesquisa do Estado do Rio Grande do Sul (FAPERGS).
References
| [1] | CLIMANÁLISE, Bulletin Monitoring and Climate Analysis, Vol. 21 - No. 06 June / 2006. Cachoeira Paulista, SP, Brazil, INPE / CPTEC, 1986. Monthly Publication. ISSN 0103-0019 CDU-555.5 http://climanalise.cptec.inpe.br/~rclimanl/boletim/index0806.shtml accessed in Dec 2013. |
| [2] | BROWN, L.E.; HANNAH, D.M.; MILNER, A.M. Hydroclimatological influences on water column and streambed thermal dynamics in an alpine river system. Journal of Hydrology, v. 325, p. 1-20, 2006. |
| [3] | CAISSIE, D. The thermal regime of rivers: a review. Freshwater Biology, v. 51, p. 1389-1406, 2006 |
| [4] | DELANEY PJV (1965) Fisiografia e geologia da superfície da planície costeira do Rio Grande do Sul. Publ Esp Esc Geol Univ Fed Rio Grande Sul (Porto Alegre) 6:1-63. |
| [5] | MOSLEY, M.P. New Zealand river temperature regimes. Water and Soil Miscellaneous Publ. No. 36. Wellington, N.Z., 87p., 1982. |
| [6] | NASA. Site acquisition of Product Images Mod11. Available in http://reverb.echo.nasa.gov/reverb Accessed December 2011. |
| [7] | XAVIER, M.B.; ROLIM, S.B.A.; DEGRAZIA, G.A.; MOOR, L.P., Analysis of Remote Surface Temperature of a Coastal Lagoon in Southern Brazil during the Passage of Frontal System, vol. 3, n.2, pp. 107-114 |
| [8] | WAN, Z. AND J. DOZIER, ‘‘A generalized split-window algorithm for retrieving land-surface temperature from space,’’ EEE Trans. Geosc. Remote Sens., vol. 34, no. 4, pp. 892-905, 1996. |
| [9] | WEBB, B.W.; CLACK, P.D.; WALLING, D.E. Water–air temperature relationships in a Devon River system and the role of flow. Hydrological Processes, v. 17, p. 3069-3084, 2003. |
| [10] | WHEATON, W. The cyclic behavior of the National Office Market. AREUEA Journal, v. 15, n. 4, p. 281-299, 1987. |
 Abstract
 Reference
 Full-Text PDF
 Full-text HTML