American Journal of Environmental Engineering

p-ISSN: 2166-4633    e-ISSN: 2166-465X

2015;  5(1A): 39-44

doi:10.5923/s.ajee.201501.06

The Daily Cycle of the Atmospheric Boundary Layer Heights over Pasture Site in Amazonia

Theomar T. de A. T. Neves 1, Gilberto Fisch 2

1Centre of Weather Forecast and Climate Studies, National Institute of Space Research, São José dos Campos, Brazil

2Science and Technology Aerospace Department, Aeronautics and Space Institute, São José dos Campos, Brazil

Correspondence to: Gilberto Fisch , Science and Technology Aerospace Department, Aeronautics and Space Institute, São José dos Campos, Brazil.

Email:

Copyright © 2015 Scientific & Academic Publishing. All Rights Reserved.

Abstract

A better descriptions of the atmospheric boundary layer (ABL) properties in Amazonia, such as its time evolution is necessary, especially for studies involving weather forecast and climatic simulation. The objective of this work was integrate and comparing data of the ABL characteristics made by different techniques in RaCCI/LBA experiment, held in southwestern Amazonia pasture site during the dry-to-wet seasons of 2002. For daytime it was possible to observe that there is an abrupt growth of the Convective Boundary Layer (CBL) between 08 and 11 Local Time (LT) with a stationary pattern between 14 and 17 LT. The maximum heights at late afternoon were around 1500 m. The onset of the Nocturnal Boundary Layer (NBL) occurs before the sunset (18 LT) and its height is very stable during the whole night (typical values around 180-250 m). The erosion of the NBL lasts for 2 hours and it is complete at 08 LT.

Keywords: Nocturnal and daytime boundary layer, Radiosondes, Tethered balloon, Amazonia

Cite this paper: Theomar T. de A. T. Neves , Gilberto Fisch , The Daily Cycle of the Atmospheric Boundary Layer Heights over Pasture Site in Amazonia, American Journal of Environmental Engineering, Vol. 5 No. 1A, 2015, pp. 39-44. doi: 10.5923/s.ajee.201501.06.

1. Introduction

In the last decades a great effort has been made by the scientists from micrometeorology and boundary layer for a better understanding of the dynamics and the description of the properties of the atmospheric boundary layer (ABL). As an example, the studies on the atmospheric transport and diffusion of pollutants [1, 2], mountain-valley and land-sea breezes [3], turbulence and wind regime [4] and parameters of climate models and general circulation [5] can benefit from the knowledge improvements about ABL.
An important feature of ABL is its height, which dictates the volume where the source of pollutants can disperse, being an important parameter for the modeling of atmospheric dispersion. [6] describe the ABL as the layer adjacent to the earth’s surface with significant turbulent transfers of heat, mass and momentum occurring over a period of the order of an hour. It has atmospheric processes due to the thermal and mechanical convection during daytime and suppressed turbulent conditions which persist and evolves during the nighttime. The heights of the atmospheric boundary layer during unstable atmospheric stability (mainly daytime) are named CBL (Convective Boundary Layer), whereas those obtained during the period of stable stability (mainly nighttime) will be denominated NBL (Nocturnal Boundary Layer).
The observational evaluation of CBL and NBL is a broad field of study, since those atmospheric processes in the lower atmosphere have an important impact on society and in the environment. Despite its importance, the logistics of the observations of atmospheric boundary layer is usually complicated [7] and with this problematic its height are considered many times as fixed in some climatic and forecast models. Also, this study different to the usual that contributes for medium latitudes will contribute for both scientific and practical applications [8-10] in lower latitudes (tropics), as it gives some new information for computational modelling and strategy designfor field experiments. Thus, the objective of this work is to integrate and compare data from the heights of ABL measured or estimated by several different instruments as radiosonde, tethered balloon and SODAR deployed on RaCCI/LBA experiment. This data tends to be representative for the daily cycle evolution of CBL and NBL over a pasture area at southwest Amazonia during the transition of the dry to the wet season.

2. Data and Methods

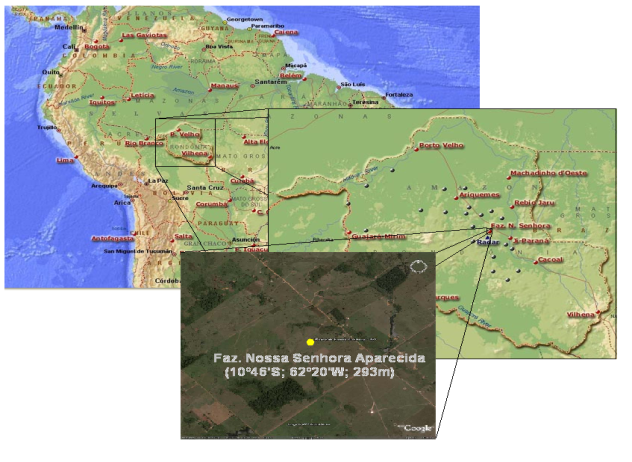
The measurements were made at Nossa Senhora Aparecida farm (10° 45' S, 62° 22' W; 293 m), Figure 1, a cleared/pasture area, which has been used in LBA´s micrometeorological field campaigns since the 90s [12].
Figure 1. Site location
The data-set was obtained during the RaCCI/LBA (Radiation, Cloud and Climate Interactions in the Amazonia/Large Scale Biosphere-Atmosphere Experiment in Amazonia) experiment, conducted from September 6 up to October 31, 2002, which occurred during the transition between the dry and rainy seasons. In order to characterize the soil moisture conditions and energy partition, the data set was divided into two periods, represented by Phases I (dry) and II (wet) as suggested by [13] and shown in Figure 2.
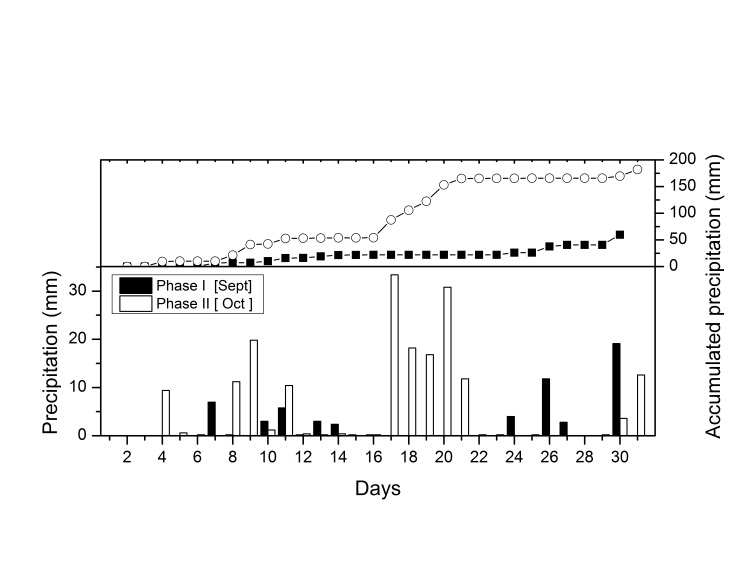
Figure 2. Time series of the rainfall (daily and accumulated precipitation) during the transition from dry (represented by Phase I) to rainy season (Phase II)
The instruments used can be described as:
- SODAR: an instrument using the remote sensing technique of the sonic waves (model REMTECH PA2), with a maximum range of 1.5 km in height and temporal wind profile measurements made every 30 min. This was practically a continuous operation throughout the experiment. The equipment is monostatic and works with a power of 10 W, approximate frequency of 2 kHz and the transmitting antenna/receiver has an area of 1.96 m². In this analysis we have used the measurements of windspeed (resolution of 0.2 m s-1) profile and estimates of the thermal inversion height through calculations made by the internal manufacturer's software.
- Tethered Balloon (named TB): it has an in situ probe attached to a balloon, which has a maximum vertical height of 0.5 km. The equipment used was an ADAS - "Atmospheric Data Acquisition System" from A. I. R. Inc. (USA) measuring air temperature, specific humidity, pressure and winds profiles. There were 61 TB profiles during the period from 20 to 30 October in several different launching times from 18 up to 10 LT (Local Time), only nighttime and early morning periods. The values of potential temperature calculated from air temperature and pressure were used. As the profiles had a 10 m vertical resolution, they thus create very detailed observations of the NBL.
- Radiosonde (named RS): an equipment DIGICORA (MW12) system from Vaisala (Finland) using radiosondes model RS80-15G. The radiosondings occurred at 02, 08, 11, 14, 17 and 20 LT from the period of September 15-30 (Phase I) and from October 15-31 (Phase II). The radiosondes measured the temperature, humidity, pressure and winds (determined by the GPS windfinding).
In order to estimate the CBL’s height, 3 different procedures were used and showed in the Figure 3: i) profile method (after Profile) is based in the height of the top of a well mixed structure (of neutral stability) observed in the profiles of potential temperature and specific humidity, because it is generate by strong convections produced by the surface heating the profiles is almost completely constant with the height. Over this mixed layer is found an inversion (stable to temperature/unstable to humidity) that represents the interaction with the free atmosphere, identified by the entrainment zone; ii) Parcel method (after Parcel) is a method which uses the dry adiabatic curve, starting from the surface potential temperature until the intersection with the radiosonde potential temperature. Determining the height through the equilibrium level of a hypothetic rising parcel of air representing a thermal [6]; iii) Richardson number method (after Richardson), uses the parameterization of the wind shear production by the turbulence in the surface layer and the consideration of an excessive temperature, over convective conditions [13].
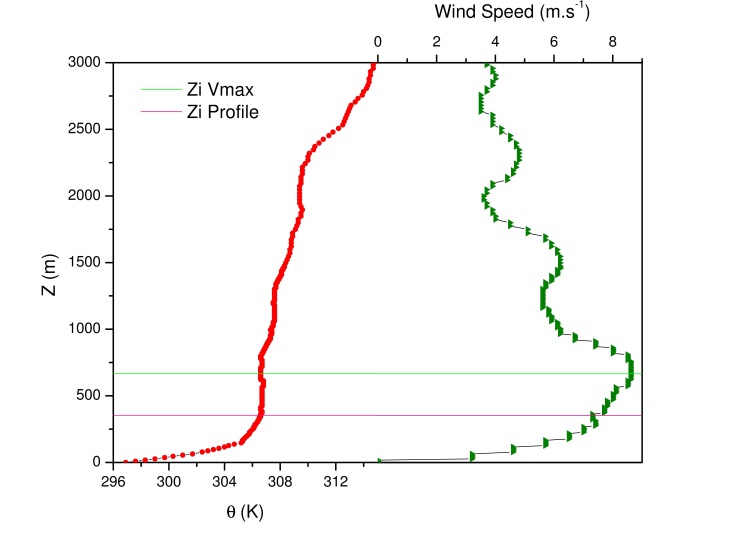
Figure 3. Schemes of the methods to obtain the convective boundary layer height. As an exemple was used the day sept/20 at 17 LT
The SODAR’s data provided by the commercial software were not used due to the misrepresentation of the CBL [14].
To the nocturnal period (Figure 4), the heights were computed by: i) profile method using a data-set of radiosonde (after RS) and tethered Balloon (TB); and ii) with the SODAR using the height of maximum wind speed (as suggested by [15] and used by [14].
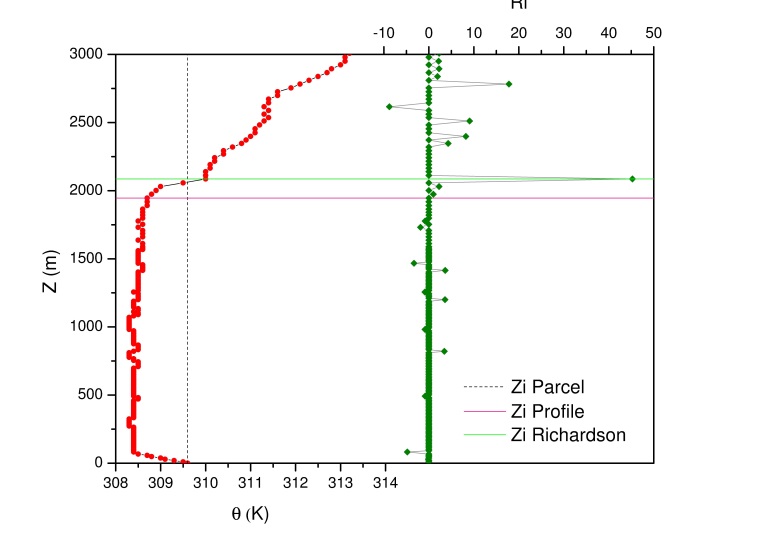
Figure 4. Schemes of the methods to obtain the nocturnal boundary layer height. As an exemple was used the day sept/20 at 02 LT

3. Results and Discussions

Figure 5 shows the hourly average ABL´s heights for the Phase I (which represents the end of the dry season). The daytime (convective) and nighttime (stable) conditions were separated by vertical lines in 06 and 18 LT as well a dashed line was included to identify the end of NBL erosion.
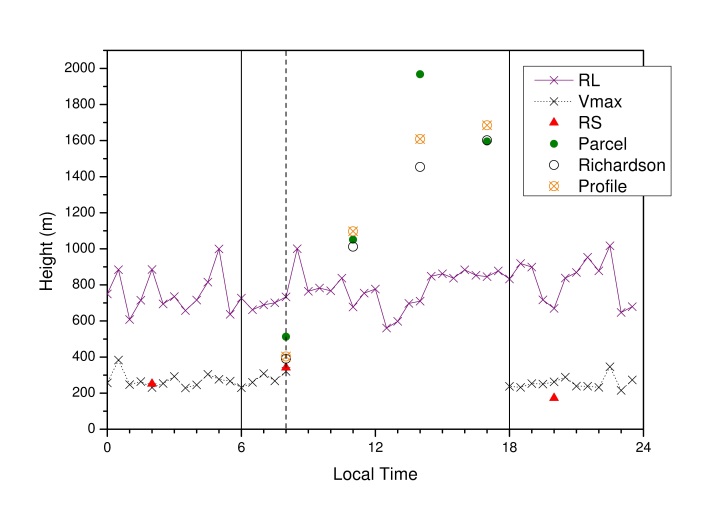
Figure 5. ABL heights during the Phase I of LBA/RaCCI 2002 experiment
During the daytime, the CBL calculated by the method of the profiles using radiosondes showed an initial height of 403 ± 108 m at 08 LT and a subsequent growth rate about 231.3 m h-1 up to 11 LT due to surface heating. At late afternoon due to the lower solar radiation flux, this rate reduced to approximately 25.3 m h-1 however reaching a maximum height of 1685 ± 266 m at 17 LT. The profile method has traditionally been used as an indicator of the height of the CBL [11]. According to [12], the parcel method has tendencies to overestimate CBL especially in areas with high incidence of solar radiation and superadiabatic gradients, which is the case of the pasture areas in the Amazon, and it showed a growth rate of 242.5 mm h-1 between 08 and 14 LT. The final height of the CBL by this method is 1595 ± 439 m at 17 LT after reaching a maximum about 1968 ± 421 m at 14 LT. The values obtained from the method of Richardson number are very similar to the profile method at 17 LT, only 7 m of difference, although with an underestimation of 182 m for the entire daytime, representing a growth rate of 134.6 m h-1 (from 08 up to 17 LT). The values obtained by SODAR´s software for the CBL´s heights virtually do not present a daily cycle, with a constant value around 780 m. These estimations do not represent the classical knowledge on the evolution of the CBL height [15] and are quite different from those observed by other methods and previous work. This fact leads to the confirmation that the heights determined internally by the SODAR are not compatible with the physical processes occurring at this site.
During Phase I, no TB measurement was made. Although the radiosondes are not the ideal instruments for determining the height of the NBL, their estimated values can provide a broader view of the NBL and showed a maximum development of 341 ± 100 m at 08 LT, associated with an average rate growth of 14.1 m h-1 from 20 LT to 08 LT. The SODAR´s estimates, through the identification of the thermal inversion by an internal calculation (named RL), overestimated the heights measured by the RS (508 ± 121 m). Mean height of the RL was 781 ± 300 m. [14] evaluating the values of evening atmospheric profiles, had noticed that this heights is not representative of the NBL top, but of a residual layer resulted from the previous day. Using the methodology proposed by [14], named Vmax, based on the concept that the height of the NBL and the level of occurrence of maximum wind are coincident [15], these heights were re-computed and has an average of 288 ± 134 m. The heights of the NBL between 02 and 08 LT obtained by the Vmax method and by the estimates from RS are very close, with an average difference of only 21 m. At the evening (20 LT) the height of the NBL was underestimated by -90 m.
Figure 6 represents the hourly average values of the ABL height to the data obtained in Phase II (beginning of rainy season). The analysis done for the CBL, calculated from radiosonde data by the profile method, shown at 08 LT a height of 465 ± 89 m, greater than that found in CBL phase I. This may be due to combination of the Sun´s position (astronomical factor) associated with a lower absorption of solar radiation by the aerosols (washed out by the rain), producing a higher surface heating. The other values of CBL heights (11 and 14 LT) in Phase II are very similar to Phase I, although the final height (17 LT) was between 1322 ± 251 m and 1361 ± 231 m, respectively for the methods of the Profile and the Richardson number. The method of Parcel showed the same pattern described at Phase I, representing a height of 1791 ± 477 m at 14 LT and later decreased to 1573 ± 442 m at 17 LT, also demonstrating that the value determined by the method of the number of Richardson was even closer to that represented by profile (1361 ± 231 m) at the end of the day. The growth rates for the CBL, in the Phase II, had lower average about 190.3 m h-1, due to the lower sensible heat and highest latent heat release attributed to higher moisture in the soil. Between 14 and 17 LT, the growth rate decreases to an order of -7.0 m h-1 reaching a maximum height of 1343 ± 238 m at 14 LT. The methods of parcel and Richardson had growth rates very similar to the 14 LT, approximately 147.7 m h-1, however the method of Richardson was the only one which has shown a decrease after the 14 LT, even if it was small (0.3 m h-1). Again, the parcel method overestimated the other methods.
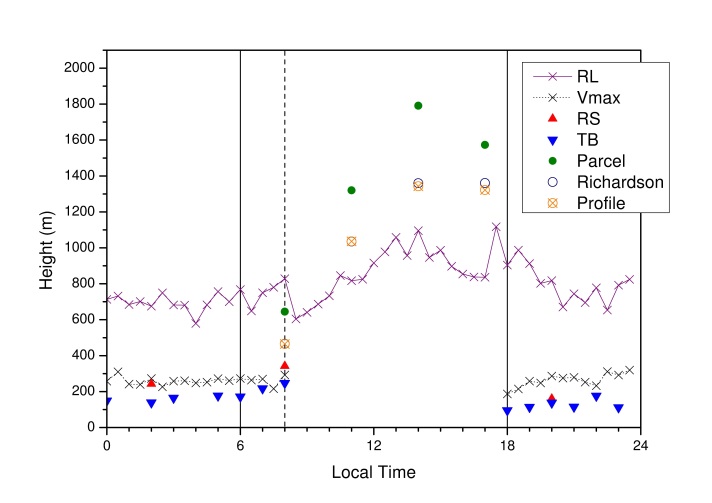
Figure 6. ABL heights during the Phase II of LBA/RaCCI 2002 experiment
The SODAR estimated an average height of 873 ± 276 m for CBL in Phase II, representing a small improvement in the trend of growth of the layer, but still cannot be considered as representative of the CBL height. It was noted that between 08 up to 14 LT, the SODAR presents an increase of the CBL height although the nominal values are lower than the observations. This fact was not observed for the Phase I.
The tethered balloon (CB) showed hourly average lower than other methods and instruments. The comparison of the TB with the others instruments is not statistically representative because of the quantity of measurements, but it is here presented as additional information obtained. The average height of the NBL was 155 ± 54 m, with a growth rate of 12.6 m h-1. Compared with the results of radiosonde and maximum wind obtained by SODAR, the difference with the results of TB were respectively +93 m and +1058 m, respectively. Estimated by the RS during the night showed an average increase of 15.2 m h-1 and a maximum development of 342 ± 100 m at 08 LT. Between 02 and 08 LT, the results obtained with the RS are close to those estimated by the SODAR through the Vmax. The differences found in these zones (02 and 08 LT) were on average 40 m, a value lower than the standard deviation (90 m). In the early evening (20 LT) the height of the NBL was overestimated by the SODAR by 126 m. The heights estimated by the method by SODAR again did not represent the NBL, with an average height of 756 ± 287 m. The heights given by the Vmax method (average of 261 ± 29 m), featured a smaller growth compared with Phase II to Phase I. This fact may be associated with a higher quantity of water vapor in the atmosphere due to the onset of rain.
In the estimates obtained through the Vmax it was also observed that there is growing rate about 0.3 m h-1 which is lower than that the dry phase, which explains by the increase of the precipitation in the Phase II (Figure 2).
Performing a general analysis for the entire experiment (Figure 7), it was possible to observe that there is an abrupt growth of the CBL between 08 and 11 LT with a stationary pattern between 14 and 17 LT. The maximum heights at late afternoon were around 1500 m. The onset of the NBL occurs before the sunset (18 LT) and its height is very stable during the whole night (typical values around 180-250 m). The erosion of the NBL lasts for 2 hours and it is complete at 08 LT.
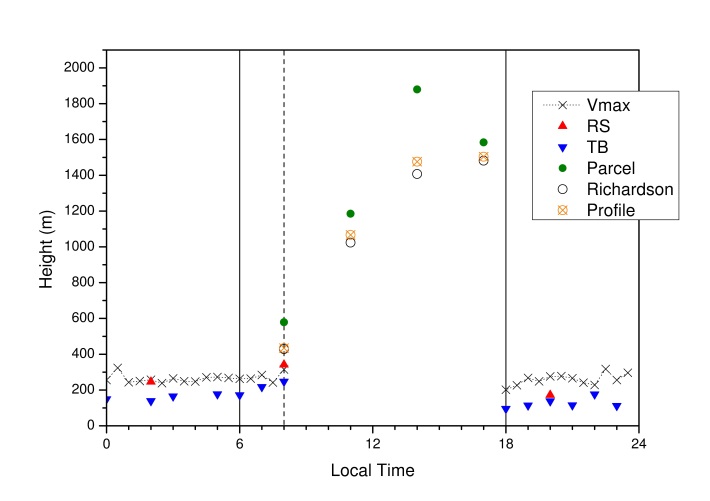
Figure 7. ABL heights during the LBA/RaCCI 2002 experiment

4. Conclusions

The daily cycle behavior of the Atmospheric Boundary Layer heights in a deforested area (pasture site) in south-western Amazonia (Rondônia) was derived using different instruments/methods (radiosondes, tethered balloon and sodar measurements). Typical values for the daytime / convective (CBL) and nocturnal / stable (NBL) boundary layer depth were determined for a field campaign held during the transition period from the dry to wet season in the region (LBA/RACCI 2002 Experiment): for the CBL is around 1500 m and ranged from 180-250 m for the NBL. An additional result is that the commercial software from REMTECH for the height of the boundary layer for nighttime does not represent the true depth but instead the height of the residual layer. An alternative method (height of the maximum windspeed) was proposed using the SODAR data-set and the results are compatible with the estimates using radiosonde and tethered balloon.
According to [15], he presents a classical figure of the ABL development in his book, which even referring to a development mean of the atmospheric boundary layer it was very similar to the Figure 7. Although, as can be seen in [16], the pattern changes due to local characteristics, reforcing the idea of ABL’s height study as important. Also, different parameterizations can be created using different measurements and observations methods, resulting in significant model errors [17]. These errors may be produced mainly by lack of local average (observational) knowledge.

ACKNOWLEDGEMENTS

The authors acknowledge the CNPq by the support to this work, process number 131165/2009-7, during the master degree.

References

[1]  Carvalho, J. C., Degrazia, G. A., Anfossi, D., Goulart, A. G., Cuchiara, G. C., Mortarini, L., 2010. Simulating the characteristic patterns of the dispersion during sunset PBL. Atmospheric Research, 98:274-284. (DOI: 10.1016/j.atmosres.2010.06.009).
[2]  Barbaro, E. W., Arellano, J. V.-G., Krol, M. C., Holtslag, A. A. M., 2013. Impacts of Aerosol Shortwave Radiation Absorption on the Dynamics of an Idealized Convective Atmospheric Boundary Layer. Boundary-Layer Meteorology. 148:31–49 (DOI 10.1007/s10546-013-9800-7).
[3]  Crosman, E. T., Horel, J. D., 2010. Sea and Lake Breezes: A Review of Numerical Studies. Boundary Layer Meteorology, p.1-29, 2010. (DOI: 10.1007/s10546-010-9517-9).
[4]  Pires, L. B. M., Souza, L. F., Fisch, G., Gielow, R., 2009. La influenza de la altura de la Capa Limite Oceanica en el Centro de Lanzamientos de Alcântara. Información Tecnológica (Impresa), 20: 119-128.
[5]  Mesinger, F., 2010. Several PBL parameterization lessons arrived at running an NWP model. IOP Conference Series: Earth and Environmental Science. 13:012005, 2010. DOI: 10.1088/1755-1315/13/1/012005.
[6]  Seibert, P., Beyrich, F., Gryning, S. E., Joffre, S., Rasmussen, A., Tercier, P., 2000. Review and intercomparison of operational methods for the determination of the mixing height. Atmospheric Environment. 34:1001–1027. (DOI: 10.1016/S1352-2310(99)00349-0).
[7]  Van Der Kamp, D., Mackendroy, I., 2010. Diurnal and seasonal trends in Convective Mixed-Layer heights estimated from two years of continuous ceilometer observations in Vancouver, BC. Boundary Layer Meteorology. Online. DOI: 10.1007/s10546-010-9535-7.
[8]  Beyrich, F., 1997. Mixing height estimation from SODAR data – A critical discussion. Atmospheric Environment, 31: 3941-3953. (DOI:10.1016/S1352-2310(97)00231-8).
[9]  Melas, D., Abbate, G., Haralampopoulos, D., Kelesidis, A., 2000. Estimation of meteorological parameters for air quality management: Coupling of SODAR data with simple numerical models. Journal Applied Meteorology, 4:509-515. (Doi:10.1175/1520-0450(2000)039<0509:EOMPFA>2.0.CO;2).
[10]  Contini, D., Cava, D., Martano, P., Donateo, A., Grasso, F., 2008. Boundary layer height estimation by SODAR and sonic anemometer measurements. In: International Symposium for the Advancement of boundary layer Remote Sensing (ISARS), 14., 2008, Roskilde, Denmark. Proceedings... Gebrüder Borntraeger Verlagsbuchhandlung Science Publishers.
[11]  Fisch, G., Tota, J., Machado, L. A. T., Silva Dias, M. A. F., Lyra, R. F. da F., Nobre, C. A., Dolman, A. J., Gash, J. H. C., 2004. The convective boundary layer over pasture and forest in Amazonia. Theoretical and Applied Climatology, 78:47-59, 2004.
[12]  Santos, L. A. R. dos, Fisch, G., 2007. Intercomparação entre quatro métodos de estimativa da altura da camada limite convectiva durante o experimento RaCCI-LBA (2002) em Rondônia – Amazônia. Revista Brasileira de Meteorologia, 22:322-328.
[13]  Vogelezang, D. H. P., and A. A. M. Holtslag, 1996, Evalution and model impacts of alternative boundary-layer height formulations. Boundary-Layer Meteorology, 81: 245-269.
[14]  Neves, T. T. de A. T., Fisch, G., 2011. Camada Limite Noturna sobre pastagem na Amazônia. Revista Brasileira de Meteorologia, 26: 619 - 628.
[15]  Stull, R., 1988. An introduction to the boundary layer. Dordrecht, The Nederlands: Kluwer Academic Press, 1988, 666 p.
[16]  Lyra, R. F. F., Molion, L. C. B., Da Silva, M. R. G., Fisch, G., Nobre, C. A., 2003. Some Aspects of the Atmospheric Boundary Layer Over Western Amazonian: Dry Season 1994. Revista Brasileira de Meteorologia, 18:79-85.
[17]  Shin, H. H., Hong, S.-Y., 2011. Intercomparison of Planetary Boundary-Layer Parametrizations in the WRF Model for a Single Day from CASES-99. Boundary-Layer Meteorology. 139:261–281. (DOI 10.1007/s10546-010-9583-z).