R. F. Caetano1, Y. D. U. Hoyer1, C. Oliveira1, 2, M. S. D. Silva1, J. C. Nascimento1, G. J. P. Abreu1, I. M. Martin1, K. G. Grigorov1, 3, V. W. Ribas1, R. S. Pessoa1, 4, B. N. Sismanoglu1
1Instituto Tecnológico de Aeronáutica - ITA, Departamento de Física, Brazil
2Laboratório Nacional de Ciência e Tecnologia do Bioetanol–CTBE/CNPEM, Campinas, Brazil
3Space Research and Technology Institute, Sofia, Bulgaria
4Universidade do Vale do Paraíba - Univap, Laboratório de Nanotecnologia e Processos a Plasma, Brazil
Correspondence to: B. N. Sismanoglu, Instituto Tecnológico de Aeronáutica - ITA, Departamento de Física, Brazil.
| Email: |  |
Copyright © 2014 Scientific & Academic Publishing. All Rights Reserved.
Abstract
The ion density distribution has been made and the ionization rate profile has been studied at moderate to atmospheric pressure inside the cavity of microhollow cathode glow discharge to better understand the microplasma behavior, aiming thin film deposition. This methodology sounds as a quite straightforward approach for very investigated, but not well understood, glow discharge at atmospheric pressure. An analytical solution for the continuity equation was proposed, which permits to obtain the ion density distribution and ionization rate profile inside the microplasma. The radial ionization rate has a maximum at the edge of the negative glow where the density of high-energy electrons is higher increasing the number of ionization collisions. The solution of continuity equation shows that microhollow cathode glow discharge has elevated ion density as would be for high pressure discharges. The results were compared with spectroscopic measurements employing argon and Balmer lines. This microplasma was used as glow plasma based aiming the improvement of the wettability on polypropylene film.
Keywords:
Microhollow cathode discharge, Spectroscopic measurements, Wettability
Cite this paper: R. F. Caetano, Y. D. U. Hoyer, C. Oliveira, M. S. D. Silva, J. C. Nascimento, G. J. P. Abreu, I. M. Martin, K. G. Grigorov, V. W. Ribas, R. S. Pessoa, B. N. Sismanoglu, Study of Microhollow Cathode Glow Discharge to Improve the Wettability on Surface of Polypropylene Film, American Journal of Condensed Matter Physics, Vol. 4 No. 3A, 2014, pp. 32-39. doi: 10.5923/s.ajcmp.201401.05.
1. Introduction
Glow discharge easily develops in a gas tube at low pressure between cathode and anode electrodes, where generally plane-parallel electrodes has been subject of study for nearly 180 years. When voltage is applied to the electrodes and gradually raised an ammeter would record initially very low current (of the order of pA) until reaches saturation due to the collection of seed electrons present in the medium. After that, as the voltage is increased, the electron will engage more ionizing collisions producing more electrons until the gas breakdown in the gap. Light emission is observed and a self-sustaining discharge is established [1]. The hollow cathode discharge (HCD) is characterized by cathode surface (planar, cylindrical or spherical), which contains the negative glow inside the cavity while the anode is placed outside. The plasma region is enclosed or partially bounded by walls at the cathode potential. In this region not only electrons are emitted, but they are also reflected from the cathode walls and do not escape as easily as they otherwise would; like occurs in the sustained cathode-anode glow discharge. The discharge can therefore be sustained more easily, due mainly by the hollow cathode effect, that is essentially an effect of the strong ionization produced by fast electrons in the cathode cavity. These fast electrons are accelerated in the cathode sheaths, and then electrostatically confined to oscillate between cathode surfaces. This is the so-called “pendulum effect” responsible for the hollow cathode effect. Hollow cathode discharges have been better studied in last years at low and high-pressure operations. The gas pressure versus cathode hole diameter product (pD) establishes the transition for these two discharge types. Relatively high-pressure operation can be achieved by reducing the diameter, D, of the cathode hole. The lowest value of pD is given by the condition that the mean free path for ionization must not exceed the hole diameter. Because of the required small size of the cathode opening for high-pressure operation, these discharges are known as Microhollow Cathode (MHC) discharges [2-10]. High-pressure direct current (dc) MHC glow discharges can be easily generated inside the cavity between perforated small area of Cu foil electrodes (9cm2 and 50μm thickness), separated by thin layer of mica (dielectric material, about 100μm thickness). The cylindrical hole of about 200μm in the cathode, mica and anode can be drilled mechanically or by laser. After evacuating a discharge chamber (of order of 200Torr), sustaining dc voltage of about 300V and current of few mA are needed in order to observe a stable glow inside the hole. A ballast resistor of about 50KΩ is needed to stabilize the current. In this work an analytical description on the ion density distribution has been made and ionization rate profile has been described inside the cavity of microhollow cathode glow discharge at moderate to atmospheric pressure. The results were compared with spectroscopic measurements, for current ranging from 7 to 23mA at ~ 220V of applied voltage for copper cathode.  rotational bands at 306.357 nm and also the ArI 603.213 nm line sensitive to van der Waals broadening was used to determine the gas temperature, which ranges from 500 to 780K. Electron number density was determined through a careful analysis of the main broadening mechanisms of the H line. From both Ar I 603.213 nm and 565.070 nm spectral lines broadenings, it was possible to obtain simultaneously electron number density and electron temperature. Electron excitation temperature was also measured from Boltzmann-plot of Ar I 4p – 4s (red lines) and 5p – 4s (blue lines) transitions.
2. Theory
For this microplasma, recent estimation of the electron number density (ne), obtained with optical emission spectroscopy through analysis of the Hβ Balmer spectral line broadening, agree somewhat with previous estimative and shows the behavior of ne as function of the pressure and the electron temperature [7]. In this work, we proceed to obtain the ne as function of the discharge parameters, but taking into account that our experimental arrangement has circular cylindrical symmetry and circular cylindrical coordinates solutions is need for it. Hashiguchi [10] plotted a graph of ionization rate profile and mean electron energy distribution, using electron energy distribution function (EEDF) calculated from Monte Carlo numerical model, where electron-electron collisions and electron collisions with atoms were taken into account, for conventional helium hollow cathode glow discharge. Fig. 1 shows synthetically his results in a graph where the highest mean electrons energy is located inside cathode sheath, once within this region occurs various processes responsible for generation of secondary electrons. At the edge of negative glow, electrons realize many collisions that lead to ionization of neutrals atoms and consequently lead to a diminishing of the electrons energy gain. In the negative glow, the EEDF presents a plateau-like profile in the low-energy region that approximates a Maxwellian distribution. The mean energy of electrons decreases rapidly at about the minimum excitation energy of the atom. According to Hashiguchi results, in the center of the negative glow, the density of low-energy electrons are five orders of magnitude higher than the high-energy electrons, which have enough energy to excite or ionize atoms. The same behavior is observed for ionization rate, see Fig. 2. Thus, the ion distribution in a radial dependence can be conveniently represented by an expression of the form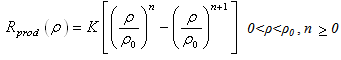 | (1) |
where n is a number that depends on a mean free path for ionization by electrons collisions. Large values of n are characteristic of a distribution which rises sharply to a maximum close to the sheath edge, ρ0, at a point given by ρmax = ρ0n/(n+1). Fig. 2 shows the distribution over ρ of ionization rate for some integers n. In this graphic, K and n was obtained for a simulated MHC glow discharge with R = 100μm and L = 100μm, and dc operated in air at atmospheric pressure. 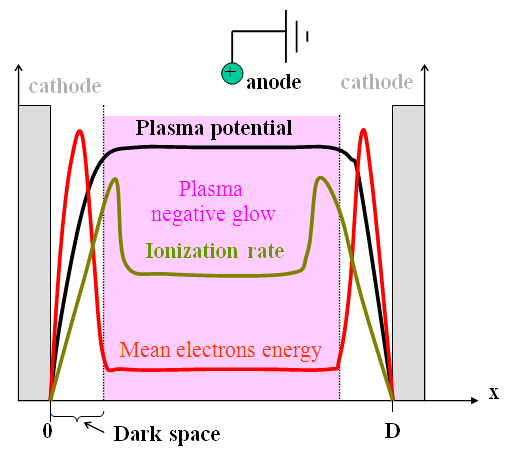 | Figure 1. Plasma parameters variations in hollow cathode according Hashiguchi [10] |
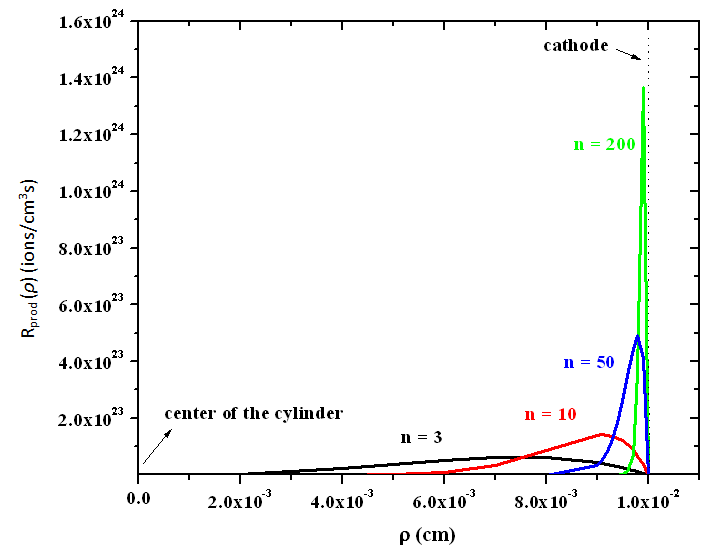 | Figure 2. Distribution of the radial ionization rate as a function of ρ and n |
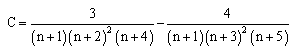
By carrying out the integrations of continuity equation, the general solution for ni(ρ = 0, z = 0) considering Eq. 1, will be 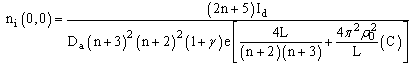 | (2) |
where 
3. Results and Discussion
In order to investigate the mechanisms of line broadening of hydrogen and of ArI lines, a study was carried out to evaluate the most important ones according to the transition. In our microplasma jet, where the density is about 1015cm-3 in atmospheric pressure, Stark and van der Waals are the most important effects. Resonance broadening is negligible in Balmer lines and in the ArI 603.213nm and 565.070nm lines, once there are no transitions involving a level that is dipole-coupled to the ground state. The relation between Gaussian, Lorentzian and the resultant Voigt, full-widths at half-maximum (FWHM), profiles is given by 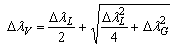 | (3) |
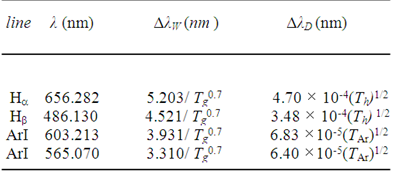
where the subscripts represent: L = Lorentzian, G = Gaussian, V = Voigt, W = van der Waals, S = Stark, D = Doppler, I = Instrumental. An observed line generally has a Voigt profile and its FWHM can be measured directly. For the lines of interest in this work, the Doppler and van der Waals broadening (FWHM) are given in Table 1. In this table, Th and TAr are the temperature of the hydrogen and argon atom, respectively. These temperatures are not necessarily equal to the gas temperature, mainly in non-equilibrium discharges.Table 1. van der Waals and Doppler broadening FWHM
 |
| |
|
One can see that the van der Waals broadening is gas temperature dependent: higher is the temperature, lower is the broadening. From the broadening of the argon lines it is possible to determine the gas temperature. If both electron number density and electron temperature are already known, for example from H analysis, one can measure H Stark width (FWHM) and calculate another plasma parameter, like the emitter temperature. In our microplasma, excited non-hydrogenic neutral atoms like ArI, lines 603.213nm and 565.070nm may be used for diagnostic purposes because they are intense and well isolated. The Stark width (FWHM) may be calculated from the following equation | (4) |
where 2ωe(Te) is the electron impact half-width and (Te) is the ion broadening parameter, given in. The presence of the ion impact correction gives an additional line asymmetry. For the line ArI 603.213nm the Stark width (FWHM) is given by | (5) |
and the Stark width (FWHM) for the ArI 565.070nm line is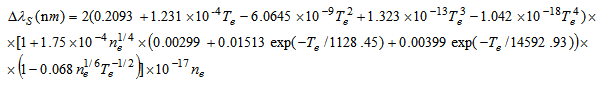 | (6) |
Solving simultaneously Eqs. (5) and (6) one can obtain ne and Te, provided the widths of the lines are known previously.The excitation temperature was measured with Boltzmann-plot and was around 7000K between 7 and 23mA. The rotational temperature (Trot) was also measured by using the  emission band at 306.357nm. The OH radical emissions in the atmospheric plasma are the result of water vapor naturally present as impurity in the open air. This band was used to determine the gas temperature from Q1 branch, assuming that these radicals are in equilibrium with the gas neutral atoms. In microplasma jet it was observed emission band between 306 and 312 nm. The Trot value may be taken from the slope of the plot ln(I0λ/A) as a function of the upper state energy. Here, I0 is the line intensity, is the transition wavelength and A the transition probability. From the Hβ profile ne may be measured and Tg may also be obtained from the ArI 603.213nm line. As an example of this procedure, for Id = 17mA, ΔλD ≅ 0 and ΔλG ≅ ΔλI = 0.0213 nm and ne = 8.57 1014 cm-3 (from Hβ, Fig. 3).
 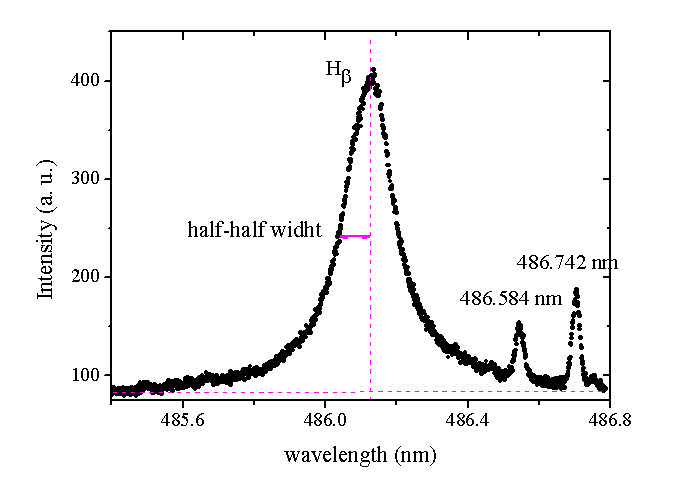 | Figure 3. H spectral profile showing HWHM |
From line deconvolution, we get ΔλL = (0.060 ± 0.003) nm ΔλS = (0.019 ± 0.001) nm. Thus, ΔλW =ΔλL - ΔλS = (0.041 ± 0.001) nm and, substituting this in ΔλS = 3.931/ Tg0.7, we find Tg = (678 ± 23) K. Fig. 4 shows the results for electron number density (ne) and gas temperature obtained for static MHC, with the order of magnitude of about 1015cm-3, in a function of current. In these results, the propagation of uncertainties resulting both from three random measurements and from the applied method was around 10%. Fig. 4 also shows the results for ion density (ni) obtained from analytical model for static MHC, with the order of magnitude of about 1015cm-3. In reality, one may obtain better agreement between these results increasing the gas temperature in the above model, consequently increasing the coefficient of ambipolar diffusion and so ni. The results reported in Fig. 4 shows that the ion density increases with the current as should be for glow discharges and was also observed from spectroscopic measurements of electron number density for MHC. As we have seen before, it’s easy to operate dc microplasma with an atmospheric air at moderate pressures. For this reason, we are going to repeat this calculations for a MHC with L = 100μm and R = 100μm using argon at pressure of 37.5Torr, current of 0.1 mA and gas temperature of about T = 380K. In accordance with reference [8], P = 0.03cmTorr and for the latter case n = 12 (lower than previous high-pressure case), we obtain Da ≅ 322.6cm2/s and finally, ni(0,0) = 1.01013cm-3. One can note that the density decrease with the pressure reduction.
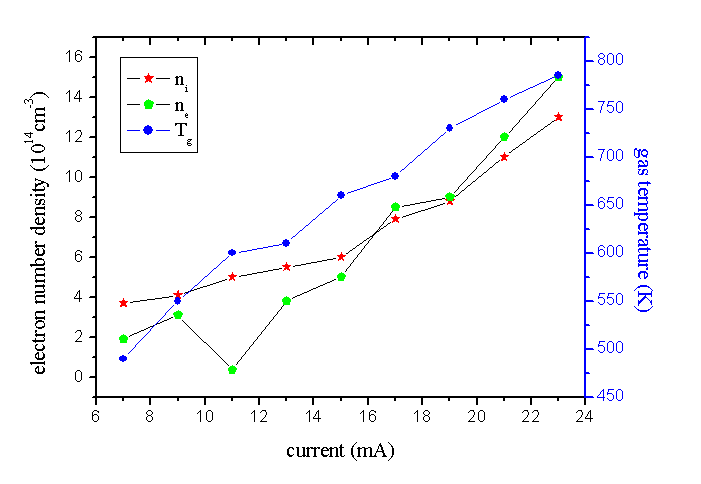 | Figure 4. Gas temperature Tg, electron number density ne (from spectroscopic measurements) and ion density ni (from analytical calculations) |
The distribution of the radial ionization rate can be observed in Fig. 5 which is very similar to those results obtained by Hashiguchi. Notice that the ionization rate has considerably large value in the negative glow, showing a considerable number of high-energy electrons. Numerical calculations [10] show that the number of the low energy electrons has a maximum on the central axis, decreasing gradually with increasing the radial distance. This number decreases rapidly at the edge of the negative glow. A plot of the ion density distribution as a function of ρ and z, for argon dc discharge, is given in Fig. 6. 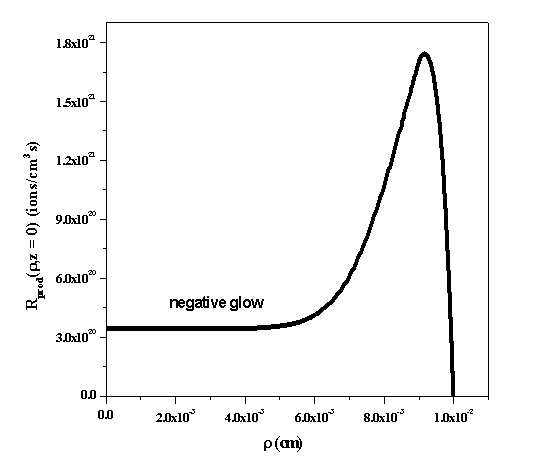 | Figure 5. Radial ionization rate for MHC operating in argon with L = 100μm and R = 100μm. Pressure of 37.5Torr, current of 0.1mA gas temperature of T = 380K |
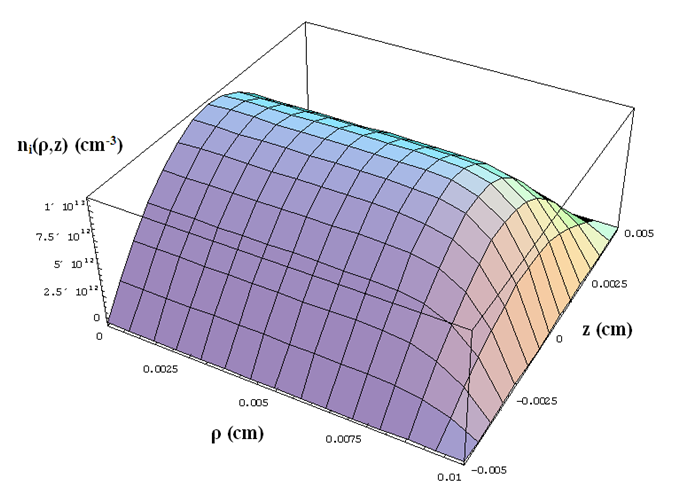 | Figure 6. Ion density distribution as a function of ρ and z for argon MHC glow discharge at pressure of 37.5Torr and PD = 0.75Torr.cm |
We note that the highest ion density occurs at point ρ = 0, z = 0, at the center of the cylindrical configuration. The ionization rate distribution now is shown in Fig. 7 as a function of ρ and z. Notice that highest rate occurs next to cathode wall.This microplasma was used as glow plasma aiming the change of wettability on surface of polypropylene (PP). The wide range of chemical species present in the plasma is ideal for modifying the atmosphere of the upper material surface altering the chemical and morphological nature. The plasma treatment is important to modify their surfaces and improve their adhesion characteristics. Oxygen was addeed to the reactive Ar or He gas because the effect of surface modification is obtained by ionization of the oxygen present between the electrodes which polarize the film surface and increases its surface energy. The discharge located at 3 mm from the discharge where the gas temperature is around room temperature and the chemical species are scattered over the PP surface located at this axial position. Ar or He gas with a little admixture of O2 was used to treat the sample (300 μm thick). The contact angle of the untreated PP surface was approximately 95o. The gas flow of 300 ml/min was used to achieve the minimum angle of 40o and there is no need for longer treatment operation beyond the time of 390 s. The current of 1.0 mA was setted to obtain the smallest angle to the flow of 300 ml/min. 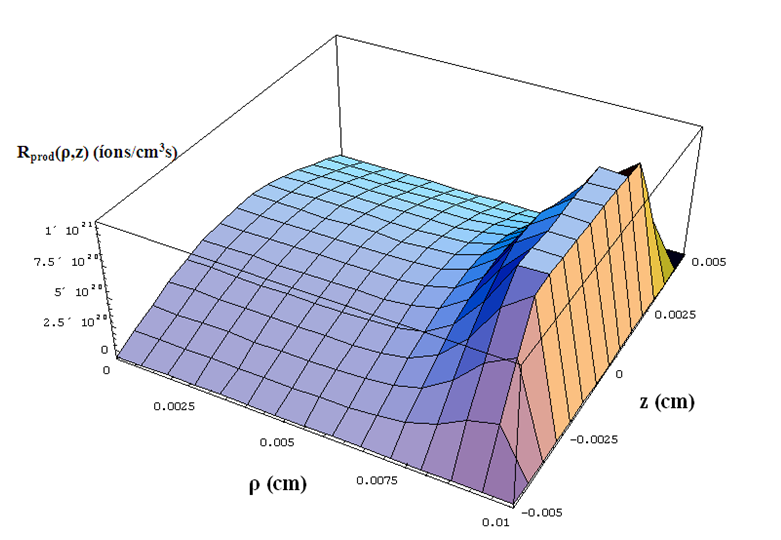 | Figure 7. Ionization rate distribution as a function of ρ and z for argon MHC glow discharge at pressure of 37.5Torr and PD = 0.75Torr.cm |
4. Conclusions
A résumé of glow discharge has been made showing the differences between the conventional plane-parallel hollow cathode and the microhollow cathode configurations. In this work an analytical solution for the continuity equation was given which permits to obtain the ion density distribution and ionization rate profile inside the cavity of microhollow cathode discharges in moderate and high gas-pressures. Our analytical description of ion density distribution arose naturally from a proposed ionization rate expression for this kind of plasma and is in accordance with more complete numerical model. The radial ionization rate has a maximum at the edge of the negative glow where the density of high-energy electrons is higher, increasing the number of ionization collisions. It is known from the literature that conventional hollow cathode glow discharge operating at high pressure has elevated ion density and microhollow cathode glow discharge has exactly the same behavior. These results were compared with optical measurements according the H and Ar atomic spectral lines broadenings. The analytical solution of plasma ion density (and therefore electron number density) was developed with the purpose to understand the microplasma processes, mainly because very interesting physical concepts are involved and this microplasma source represent a new area of significant perspectives for industrial and biomedical applications and thin film depositions in biomaterials. Ar or He gas with a little admixture of O2 was used to treat polypropylene (PP) (300 μm thick) film. The contact angle of the untreated PP surface was approximately 95o. The gas flow of 300 ml/min was used to achieve the minimum angle of 40o and there is no need for longer treatment operation beyond the time of 390 s. The current of 1.0 mA was setted to obtain the smallest angle to the flow of 300 ml/min.
ACKNOWLEDGMENTS
The authors acknowledge the financial support of the programs CAPES, FAPESP and CNPq for the partial financial support under Grant No. FAPESP/12/13064-4, FAPESP/PRONEX/11/50773-0, CNPq/MCTI/SECIS 406035/2013-0, CNPq/306095/2013-0 PQ, CNPq/310419/2012-3 DT, CAPES/88881.030340/2013-01 BJT, CAPES/ITA No. 5/2014 and CAPES/PVE/ BEX9796/12-6.
References
| [1] | E. Nasser, Fundamentals of Gaseous Ionization and Plasma Electronics (John Willey and Sons, New York, 1970). |
| [2] | R. Caetano, Y. D. Hoyer, I. M. Barbosa, K. G. Grigorov, B. N. Sismanoglu, “Radial measurements of gas discharge parameters of atmospheric pressure microplasma”, Int. J. of Mod. Phys. B, 14, 1350089-1350102 (2013). |
| [3] | Y. D. Hoyer, B. N. Sismanoglu, K.G. Grigorov, “Measurements of spatially resolved electron number densities and modes temperatures using optical emission spectroscopy of atmospheric pressure microplasma jet”, The Eur. Phys. J. D, At., Mol. and Opt. Phys. 66, 171-180 (2012). |
| [4] | R. Foest, M. Schmidt, K. Becker, “Microplasmas, an emerging field of low-temperature plasma science and technology”, Int. J. of Mass Spect. 248, 87-102 (2005). |
| [5] | K. H. Becker, H. H. Schoenbach, J. G. Eden, “Microplasmas and applications”, J. Phys. D: Appl. Phys. 39, R55-R70 (2006). |
| [6] | K. H Schoenbach, R. Verhappen, T. Tessnow, P. F. Peterkin and W. Byszewski, “Microhollow cathode discharges,” appl. Phys. Lett. 68, 13-15 (1996). |
| [7] | A. D. White, “New hollow cathode glow discharge,” J. appl. Phys. 30, 711-719 (1959). |
| [8] | Yu. P. Raizer, Gas Discharge Physics (Springer-Verlag, New York, 1997). |
| [9] | Q. Wang, I. Koleva, V. M. Donelly and D. J. Economou, “Spatially resolved diagnostics of an atmospheric pressure direct current helium microplasma,” J. Phys. D: Appl. Phys. 38, 1690-1697 (2005). |
| [10] | S. Hashiguchi, “Numerical calculations for the electron energy distribution in a helium hollow cathode glow discharge,” IEEE Trans. Plasma Sci. 19, 297-300 (1991). |
 Abstract
 Reference
 Full-Text PDF
 Full-text HTML