C. Oliveira1, 2, F. M. Freitas1, G. J. P. Abreu1, M. P. Gomes1, K. G. Grigorov1, 3, P. Getsov3, I. M. Martin1, R. S. Pessoa1, 4, L. V. Santos1, 4, V. W. Ribas1, B. N. Sismanoglu1
1Technological Institute of Aeronautics (ITA), Physics Department, São José dos Campos, Brazil
2Laboratório Nacional de Ciência e Tecnologia do Bioetanol–CTBE/CNPEM, Campinas, Brazil
3Space Research and Technology Institute, Acad. G. Bonchev Str. bl.1, Sofia, Bulgaria
4University of Paraiba Valley (Univap), Nanotecnology and Plasmas Processes Laboratory, Brazil
Correspondence to: B. N. Sismanoglu, Technological Institute of Aeronautics (ITA), Physics Department, São José dos Campos, Brazil.
| Email: |  |
Copyright © 2014 Scientific & Academic Publishing. All Rights Reserved.
Abstract
Gas discharge parameters of a direct current Ar+2%H2 non-thermal microplasma operated at atmospheric pressure were measured in this work. The microplasma was investigated in the normal and abnormal glow regimes, for current ranging from 10 to 130 mA, at ~ 160 - 250 V of applied voltage for a cathode formed with Cu+Mo+Fe foils, covered with mica at front face Cu foil. The microplasma goes through an opening hole traversing the dielectric and metal foils and emerging on open air. Both OH  bands were used to estimate the gas temperature, which ranges from 450 to 800 K. The electron number densities, ranging from 3.0 × 10¹⁴ to 8.0 × 1014 cm-3, were determined by the
  line. Excitation temperatures were measured from three methods: from two Cu I and Mo I spectral lines ratio (Texc = 2 700 K) and from Boltzmann-plot of both Fe I and He I transitions (Texc = 3 000 K). The vibrational temperature was carried out from the second positive system N2
  for Δν = -2 and it was in the range 2500 - 3000 K for a current varying from 20 to 100 mA.
Keywords:
Optical emission spectroscopy, Microplasma, Electron number density, Excitation temperature
Cite this paper: C. Oliveira, F. M. Freitas, G. J. P. Abreu, M. P. Gomes, K. G. Grigorov, P. Getsov, I. M. Martin, R. S. Pessoa, L. V. Santos, V. W. Ribas, B. N. Sismanoglu, Optical Measurements of Atmospheric Pressure Direct Current He/H2 Microplasma in Open Air for Surface Modification, American Journal of Condensed Matter Physics, Vol. 4 No. 3A, 2014, pp. 19-27. doi: 10.5923/s.ajcmp.201401.03.
1. Introduction
Stable uniform and homogeneous non-thermal discharges can be generated in small regions and these discharges are known as microplasmas [1-9]. Microplasmas are usually characterized by low gas temperature and high electron mean energy. Microplasmas enable applications such as thin film processing, deposition, medical and industrial technologies, and analytical chemistry. McKenna et al [10] group used two different atmospheric pressure microplasma systems for surface engineering of a range of nanomaterials. Specifically a gas-phase approach from vaporized tetramethylsilane has been used to synthesize silicon carbide nanoparticles with diameters below 10 nm. Microplasma-liquid system has been used to tailor surface properties of silicon nanoparticles and to reduce graphene oxide into graphene. Gregório et al [11] presents an imaging analysis of stable microplasmas produced in air, argon, and helium at atmospheric pressure, using a continuous microwave (2.45 GHz) excitation. The microplasma develops within the 50–200 μm gap created between two metal electrodes (6 mm in length), placed at the open end of the transmission line. Zhu et al [12] has used a direct current (DC), non-thermal atmospheric-pressure microplasma with He/O2 gas mixture to characterize the electrical properties as a function of the oxygen concentration. They have observed a self-pulsed mode (negative resistivity) before the transition of the discharge to normal glow mode. Optical emission spectroscopy (OES) was used from both end-on and side-on along the plasma to analyze the reactive species generated in the plasma, which allows for enhanced applications in health and medical related areas. Hong et al [13] presents an atmospheric-pressure N2-plasma jet generated from microdischarges in a porous dielectric. A plasma jet with a length of 42 mm was produced by feeding nitrogen gas through a porous alumina installed between an outer electrode and a hollow inner electrode and by applying 60 Hz sinusoidal voltage wave to the electrodes. Microdischarges in the porous alumina are ejected as a plasma jet from the outer electrode through a 1 mm hole by increasing the applied voltage, showing that the temperature of the jet decreases to a value close to room temperature. Benedikt et al [14] developed an RF microplasma jet working at atmospheric pressure for thin film deposition. One capillary tube was excited by an RF frequency of 13.56 MHz at rms voltages of around 200–250 V. The plasma was generated in a plasma forming gas (He or Ar) in the annular space between the capillary and the ceramic tube. The electron number densities were around 8×10²⁰ m−3, measured using optical emission spectroscopy. The gas temperature stays below than 400 K. Deposition of hydrogenated amorphous carbon films and silicon oxide films has been tested using Ar/C2H2 and Ar/hexamethyldisiloxane/O2 mixtures, respectively. Mohamed et al [15] performed microplasma where the electrode’s opening was about 200 μm diameter. They measured Tg by evaluating the rotational (0-0) band of the second positive system of N2. Sismanoglu et al [3] and Gomes et al [4] studied electrical parameters of relatively high pressure microplasmas, showing the different operation modes: the pre-breakdown and breakdown behaviors and the main gas parameters. For pressures range from 90 to 800 Torr of Ar flow at 0.03 L.min-1 and currents from 5 to 20 mA, OES measurements results ne ∼ 1014 cm-3, Tg ∼ 650 K, Texc ∼ 8000 K. By flowing gas at 0.7 L.min-1, microhollow cathode-type microplasma yields for ne (2–41014 cm-3), Tg (460 - 640 K), Texc (∼ 7000 K), when the discharge current (Id) ranges from 7 to 15 mA [3]. Jovovic et al [16] present results on segmented microhollow gas discharge source (SMHGD) operating at atmospheric pressure in DC regime. In their results, Texc, Tg and ne ≈ (2–4)×1014cm−3 were measured in helium operating in the voltage range (220 to 475) V and currents 80 mA. Boltzmann plots of relative He I line intensities were used to measure Texc = (2500–2800) K. The same technique is applied to  band to measure Tg in the range (700–900) K in He. Microtubular cathode microplasmas is constituted by a capillary tube as the cathode and a metal foil as the anode. The microplasma is on in the normal glow mode with Id from 2 to 20 mA and the applied voltage (Vd) varies from 260 to 500 V for cathode-anode gaps ranging from 0.5 to 2.5 mm. In our device, the anode is a microtube and the cathode is a sandwich of the metal foils covered with mica. A microhole is drilled and the discharge occurs between the hollow anode and the hollow cathode. From 10 to 130 mA, it is observed a flow of Cu I and Mo I sputtered excited atoms ejected from the cathode enabling the estimation of the Texc through two spectral lines ratio method.
2. Experimental
Fig. 1 shows the experimental set-up constructed to generate the He + 2%H2 microplasma at atmospheric pressure. A tungsten carbide microtube of 600 m inner diameter was positively polarized and positioned in front of the opening of a microtube through a set of sheets arranged in the following order: mica + copper + molybdenum + iron. These foils have a thickness of 60 m and are fixed by staples, without the use of glue. The digital oscilloscope used in the experiments was a DPO 7254 from Tektronix, 2.5 GHz. The high voltage probe (from Tektronix) was a P6015A and a current probe TCP 312 with amplifier TCPA 300. The He gas flow was 1.5 L.min-1, while the H2 flux was 30×10-3 L.min-1 and the plasma were yielded in open air (709 Torr in the laboratory) as shown in Fig. 1. A series ballast resistor of 50 KΩ was connected into the cathode to limit the current in the circuit. DC power supply provides 5 KV voltage at 300 mA. High resolution monochromator IHR550 model Horiba-Jobin-Yvon with a diffraction grating of 1800 lines.mm-1 blazed at 500 nm and 2400 lines.mm-1 at 300 nm was used to collect radiation. The instrumental Gaussian-type full-width at half-maximum (FWHM)  = 0.03 nm was in the spectral line broadening. The spectra at the exit slit were recorded by a CCD Symphony with 1024×512 pixels and the SynerJy software was used to handle the spectra.
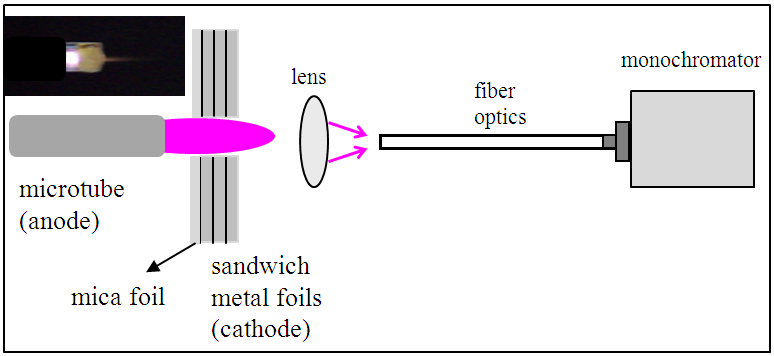 | Figure 1. Experimental set-up showing the microplasma and optical apparatus |
3. Results and Discussion
Electrical and optical emission spectroscopy (OES) measurements were used to estimate the microplasma parameters. The optical measurements were done in a gas mixture composed He/H2, using molecular (OH and H2) and atomic species (Cu I, Mo I, He I and Fe I). It is worth to see that the later was observed when ferrocene was injected to produce analyte atoms used as thermometric species. Hβ line was used to estimate the electron number density. Fig. 2 shows the V-I characteristic curves for the microplasma. From 10 to 120 mA normal mode and abnormal mode operations appear. The applied voltage varies from 140 to 300 V, for cathode-anode gaps ranging from 0.5 to 3.0 mm.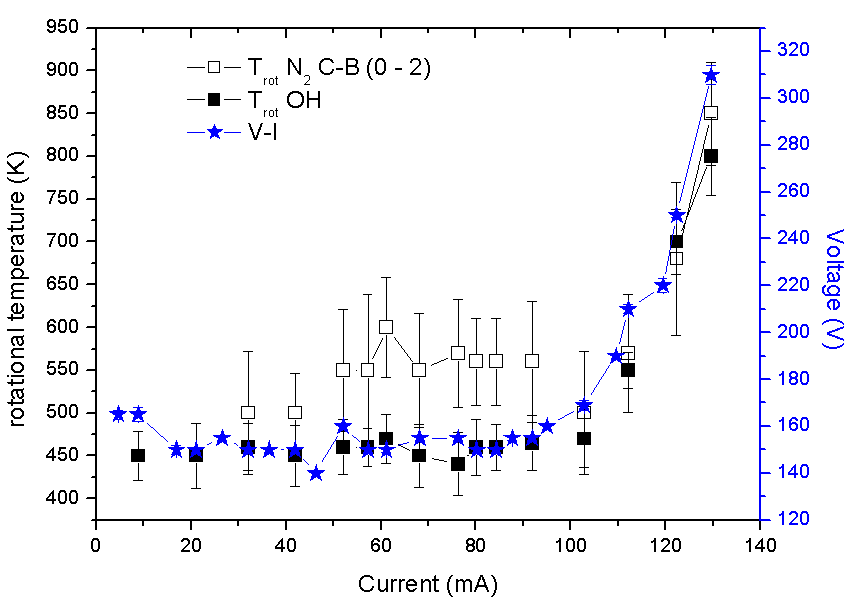 | Figure 2. V-I characteristic curve for the microplasma and rotational temperature for a range of currents. Errors bars are resulting from a set of three measurements or from the limitations of the used method |
Fig. 3 shows the strongest emission lines from the plasma bulk, which one can see the He I lines. The OH, NO, NH and N2 spectrum commonly appears as well. The presence of these lines, Cu I lines (510 to 530 nm) and Mo I lines (440 to 450 nm) indicates collisional processes at the cathode region (glow plasma). 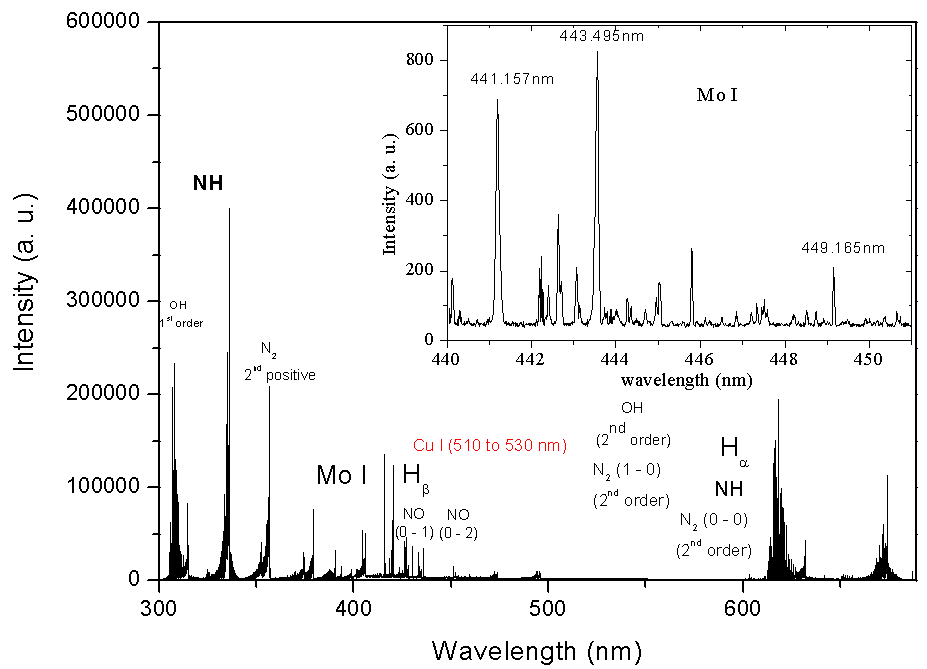 | Figure 3. The main emission lines from the microplasma. Inset, the Mo I lines |
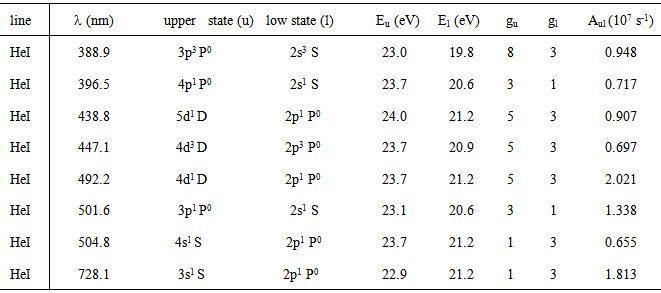
The excitation temperature (Texc) was obtained with two Mo I lines method which has resulted in Texc ~ 2700 K, over all current range; two copper lines method which has resulted in Texc ~ 2 800 K, over all current range; Boltzmann-plot method (BP), for He I transition lines (Table 1) has resulted in the mean value Texc ~ 3 000 K; BP applied to Fe I lines (Table 2) which results the mean value 3 300 K. In The BP method [3, 6], Texc could be estimate from the slope of the best linear fit from the plot ln(Iulλul/gulAul) versus the energy Eu. The observed Fe I lines, sputtered from the cathode surface, were very weak for the discharge showing the limitation of the electrons energy or the greater distance of the Fe foil from the microplasma jet exit nozzle at the anode side. Therefore, the excitation temperature was also estimated introducing ferrocene (organometallic compound with the formula Fe(C5H5)2 and boiling point at 525 K) to the main gas line. Table 1. Characteristics of the He I lines observed in the discharge [17]
 |
| |
|
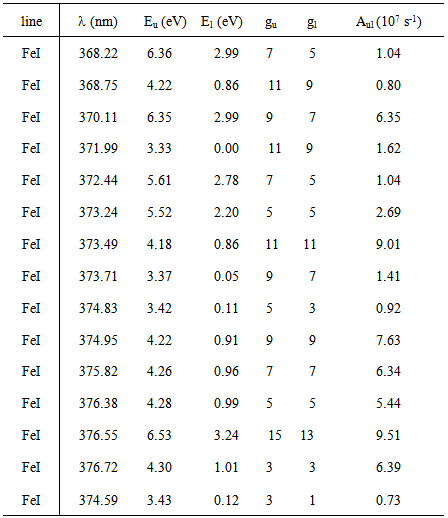
Table 2. Characteristics of the Fe I lines observed in the discharge [17]
 |
| |
|
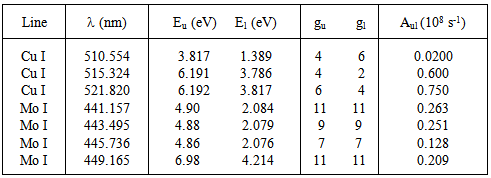
The distribution of species in different excited states could be described by the Boltzmann distribution function, and the well-known method of Boltzmann-plot or the two-line method (considering the Cu I lines and Mo I lines, Table 3). This is possible because the discharge generally behaves like near-partial-local thermodynamic equilibrium (PLTE).Table 3. Line parameters of the Cu I and Mo I lines [17]
 |
| |
|
The listed Cu I and Mo I lines (Table 2) were the strongest ones allowing the estimation of Texc. The excitation temperature obtained from this method is related to the upper excited states of the pair. In this method, one can use the relation [18] to obtain Texc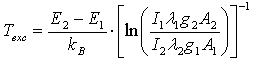 | (1) |
Our results for Texc present a good agreement with similar discharges in helium plasma at atmospheric pressure [16, 19]. Fig. 4 and Fig. 5 show the BP for Fe I lines given Texc ~ 3018 K and for He I spectral lines given Texc ~ 2800 K, respectively.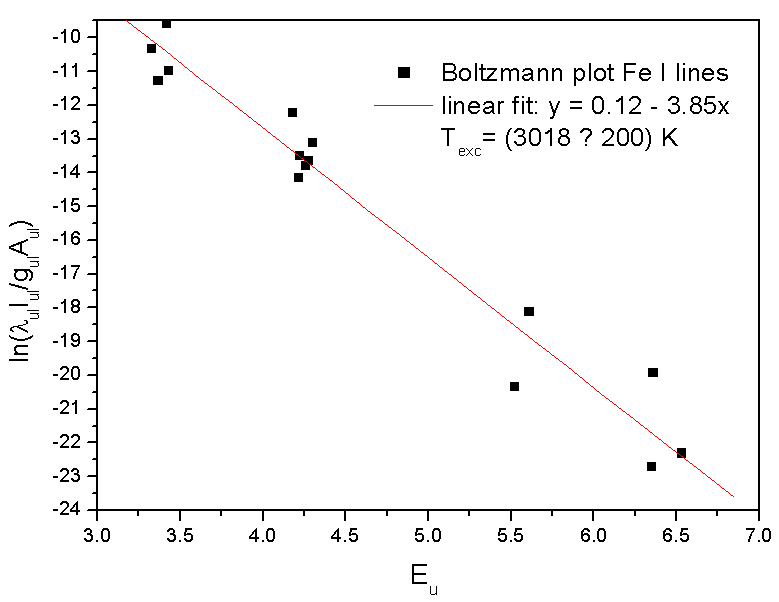 | Figure 4. Typical Boltzmann plot of the Fe I lines (experimental conditions: 70 mA, given Texc ~ 3000 K) |
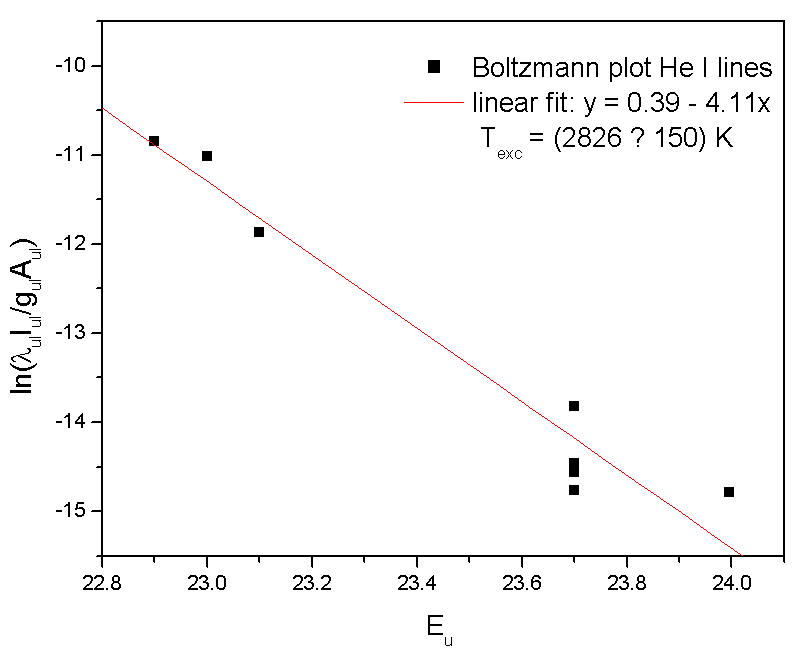 | Figure 5. Typical Boltzmann plot of the He I lines (experimental conditions: 70 mA, given Texc ~ 2800 K) |
The rotational temperature (Trot) was measured by using the OH (first order, ultra-violet,  emission band at 306.36 nm to estimate the gas temperature from Q1 branch, (Fig. 6). In Fig. 2 is depicted the rotational temperature (gas temperature) obtained from the OH radical method in a function of the current. The gas temperature has remained constant in the normal region (700 K), as in conventional glow discharge. In the high current operation, as expect, the gas temperature has increased. In our microplasma, it was obtained Tg ranging from 450 to 800 K for a range of electrical current. The gas flow cooled the plasma volume and the cathode surface and this microplasma could be used for surface treatments, such as deposition and corrosion. The gas temperature could also be measured through
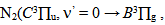
 in the ultraviolet region (Fig. 7). This method was used in ref. [20]. In atmospheric pressure microplasmas at non-equilibrium conditions the energy exchange between
  states and He atoms can be related to the thermalization of these species and, in our experimental conditions, Tg also could be estimated from the N2 rotational temperature at the
  transition (see results in Fig. 2).
 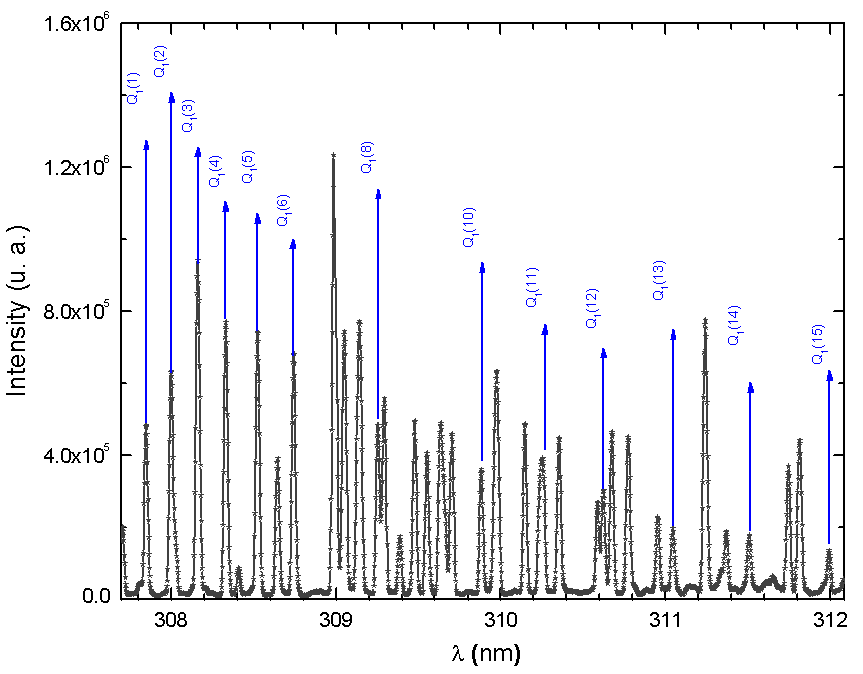 | Figure 6. UV emission bands of OH (first order, ultra-violet, 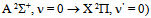 emission band at 306.36 nm emission band at 306.36 nm |
 | Figure 7. The observed second positive system of N2 from 330 to 410nm transition at Id = 60 mA, Vd = 205 V (inset, the rotational spectrum of the transition  R branch at 380.5 nm to estimate Tg = 640 K) R branch at 380.5 nm to estimate Tg = 640 K) |
For the vibrational temperature (Tv) the Boltzmann plot method was also carried out. Now, the second positive system  for Δν = -2 was used to estimate the temperature in the plasma bulk. This was done by Boltzmann plot of the transitions at 364.20, 367.20, 371.00, 375.54 and 380.49 nm. The range temperature was 2500 - 3000 K for a current varying from 20 to 100 mA. Electron number density (ne) measurements could be done by analyzing the Balmer Hβ line at 486.1 nm [21, 22]. To increase the density of this line in such a manner to observe adequate emission intensity we introduced a small amount of H2 (~2%) to the main gas flow. The Stark contribution to the broadening of this line is electron temperature independent for our microplasma conditions and ne is easily estimated from the Gig-Card tables and maps [21, 22]. The needed procedure followed to relate ne with the Stark broadening of the line must consider all Gaussian and Lorentzian contributions to the final Voigt profile of the experimental line. The Stark and van der Waals contributions (Lorentzian profile) were the most important effects in the spectral line broadening. The relation amoung Gaussian, Lorentzian and the Voigt full-widths at half-maximum (FWHM) profiles is given by [3, 6, 8, 20]
 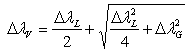 | (2) |
where the subscripts of  represent: L = Lorentzian, G = Gaussian and V = Voigt. For the
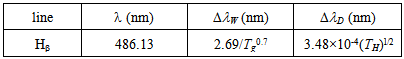
  Balmer line the Doppler and van der Waals broadening (FWHM) are given in Table 4.
 Table 4. Van der Waals and Doppler broadening full-widths at half-maximum (FWHM)
 |
| |
|
From the Hβ profile, the ne could be measured. Also, from this line method, we can calculate ne from using Eq. (2) [21, 22]. Depicted in Fig. 8 is the ne estimated from Hβ line. The electron number densities were in the range (3.0-8.0) ×1014 cm-3. The results for ne present a good agreement with works reported earlier, showing that ne has increased with the current as it must be for glow discharges. Jovovic et al [16] obtained (2–4)×1014 cm−3 and Wang et al [20] estimated (4–7) × 1013 cm−3. Finally, it is important to state that all standard deviations related to the measurements and applied methods presented in this paper are around ± 10%.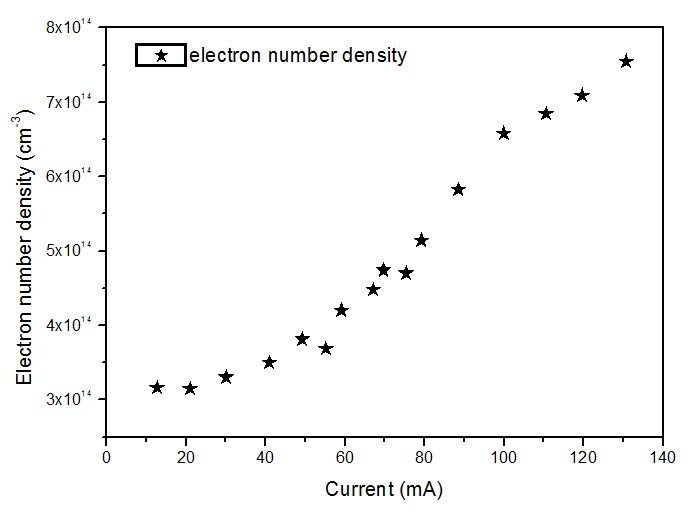 | Figure 8. Electron number density for a range of current |
4. Conclusions
Optical emission spectroscopy measurements were done to study DC microplasma at atmospheric pressure in a mixture of He+2% H2. The Balmer line Hβ was used to characterize the plasma formed at the hollow cathode borehole localized at the center of three parallel metal foils, covered with mica. The gas flow was forced to traverse the hollow structure, producing laminar jet at the exit nozzle, where end-on measurements were performed. Spectral line broadening mechanisms were used to obtain electron number density, excitation temperature and the gas rotational temperature, estimated from both OH radical Q1 branch (first order, ultra-violet,  emission band at 306.36 nm and
  in the ultraviolet region. The gas temperature has remained constant in the normal region (~ 450 K from OH lines and 550 K from N2). The excitation temperature (Texc) was obtained from two Mo I lines method which has resulted in Texc ~ 2700 K, over all current range; from two copper lines method which has resulted in Texc ~ 2 800 K, over all current range; from Boltzmann-plot method (BP), for He I transition lines has resulted in Texc ~ 3 000 K and, finally, from BP applied to Fe I lines (added to the discharge) which results 3 300 K. The temperatures determined from Saha-Boltzmann method were too low due to absence of LTE conditions in our experiments. The BP method was carried out to obtain the vibrational temperature (Tv). The second positive system N2
  for Δν = -2 was used to estimate the temperature. This was done through the transitions at 364.20, 367.20, 371.00, 375.54 and 380.49 nm. The temperature was in the range 2500 - 3000 K for a current varying from 20 to 100 mA. The electron number density was measured from Hβ profile and found to be in the range of 3 1014 to 8 1014 cm-3 in a good agreement with works reported earlier.
ACKNOWLEDGMENTS
The authors acknowledge the financial support of the programs CAPES, FAPESP and CNPq for the partial financial support under Grant No. FAPESP/12/13064-4, FAPESP/PRONEX/11/50773-0, CNPq/MCTI/SECIS406035/2013-0, CNPq/306095/2013-0 PQ, CNPq/310419/2012-3 DT, CAPES/88881.030340/2013-01 BJT and CAPES/PVE/ BEX9796/12-6.
References
| [1] | R. Foest, M. Schmidt and K. Becker, Int. J. of Mass Spect. 248, 87 (2005). |
| [2] | K. H. Becker, H. H. Schoenbach and J. G. Eden, J. Phys. D: Appl. Phys. 39, R55 (2006). |
| [3] | B. N. Sismanoglu, K. G. Grigorov, R. Caetano, M. V. O. Rezende and Y. D. Hoyer, Eur. Phys. J. D. 60, 505 (2010). |
| [4] | M. P. Gomes, B. N. Sismanoglu, J. Amorim, Braz. J. of Phys. 39, 25 (2009). |
| [5] | C. Oliveira, J. A. Souza Corrêa, M. P. Gomes, B. N. Sismanoglu, J. Amorim, Appl. Phys. Lett. 93, 041503 (2008). |
| [6] | B. N. Sismanoglu and J. Amorim, Eur. Phys. J. Appl. Phys 41, 165 (2008). |
| [7] | R. S. Pessoa, B. N. Sismanoglu, J. Amorim, G. Petraconi and H. S. Maciel, in Gas Discharges, Fundamentals and Applications (Transworld Research Network, India, 2007). |
| [8] | R. Caetano, Y. D. Hoyer, I. M. Barbosa, K. G. Grigorov, B. N. Sismanoglu, Int. J. Mod. Phys. B 27, 1350089 (2013). |
| [9] | R. Foest, M. Schmidt and K. Becker, Int. J. of Mass Spect. 248, 87 (2005). |
| [10] | J. McKenna, J. Pate, S. Mitra, N. Soin, V. Svrcek, P. Maguire and D. Mariotti, Eur. Phys. J. Appl. Phys. 56, 24020 (2011). |
| [11] | J. Gregório, O. Leroy, P. Leprince, C. Boisse-Laporte and Luís L. Alves, IEEE Trans. on Plasma Science 39, 2674 (2011). |
| [12] | W. Zhu and J. L. Lopez, Plasma Sources Sci. Technol. 21, 034018 (2012). |
| [13] | Y. Hong, S. Yoo and B. Lee, J. of Electrost. 69, 92 (2011). |
| [14] | J. Benedikt, V. Raballand, A. Yanguas-Gil, K. Focke and A. von Keudell, Plasma Phys. Control. Fusion 49, B419 (2007). |
| [15] | A. -A. H. Mohamed, J. F. Kolb and K. H. Schoenbach, Eur. Phys. J. D 60, 517 (2010). |
| [16] | J. Jovovic and N. Konjevic, Eur. Phys. J. D 68, 60 (2014). |
| [17] | www.nist.gov, accessed in June 2014. |
| [18] | H. R. Griem, Plasma Spectroscopy (McGraw-Hill, New York, 1964). |
| [19] | Q. Xiong, A. Yu. Nikiforov, M.A. Gonzalez, C. Leys and X.P. Lu, Plasma Sources Sci. Technol. 22, 015011 (2013). |
| [20] | Q. Wang, I. Koleva , V. M. Donnelly and D. J Economou, J. Phys. D: Appl. Phys. 38, 1690 (2005). |
| [21] | M. A Gigosos, M. A. González and V. Cardeñoso, Spechtrochim. Acta Part B 58, 1489 (2003). |
| [22] | M. A. Gigosos and V. Cardeñoso, J. Phys. B: At. Mol. Opt. Phys. 29, 4795 (1996). |
 Abstract
 Reference
 Full-Text PDF
 Full-text HTML