-
Paper Information
- Previous Paper
- Paper Submission
-
Journal Information
- About This Journal
- Editorial Board
- Current Issue
- Archive
- Author Guidelines
- Contact Us
American Journal of Biomedical Engineering
p-ISSN: 2163-1050 e-ISSN: 2163-1077
2013; 3(6A): 22-26
doi:10.5923/s.ajbe.201310.04
Contrast Medium Volume Optimization in Abdominal CT on Basis of Lean Body Weight
 Abstract
 Reference
 Full-Text PDF
 Full-text HTML
Rodrigues Liliana 1, Sampaio Ricardo 2, Coimbra Miguel 3
1Escola Superior de Tecnologia da Saúde do Porto, Instituto Politécnico do Porto, Vila Nova de Gaia, and Unidade de Imagiologia, Hospital da Boavista, Porto, Portugal
2Unidade de Imagiologia, Hospital da Boavista, Porto, Portugal
3Instituto de Telecomunicações, Faculdade de Ciências da Universidade do Porto, Portugal
Correspondence to: Rodrigues Liliana , Escola Superior de Tecnologia da Saúde do Porto, Instituto Politécnico do Porto, Vila Nova de Gaia, and Unidade de Imagiologia, Hospital da Boavista, Porto, Portugal.
| Email: |  |
Copyright © 2012 Scientific & Academic Publishing. All Rights Reserved.
Computed tomography (CT) in abdominal imaging has undergone great advances in recent years. The administration of iodinated contrast media (CM) has evolved along with the evolution of the CT equipment. The most common method for calculation of the CM volume in abdominal CT is based on total body weight (TBW), but in this way some patients get a lower dose and some other patients get a higher dose that the optimal dose they need. In the literature there are many formulas to calculate the CM volume to be administered in abdominal CT, but practice shows that the variability of enhancement is wide. The main objective of this study is to verify that the volume of intravenous CM in abdominal CT calculated on basis of lean body weight (LBW) allows good liver enhancement with small amplitude of variation around the mean, that is, with less variability in enhancement than CM volume calculated on basis of TBW. In conclusion the calculation of the volume of CM on basis of LBW translates into a low variability of liver enhancement–25.50 HU. In our results 96.05% of sample belongs to a good hepatic enhancement. If we stratify sample by groups of BMI, we also verify no significative differences between slims and fat patients when analysed mean hepatic enhancement.
Keywords: Intravenous contrast medium, Computed tomography, Lean body weight, Liver enhancement, Abdominal CT
Cite this paper: Rodrigues Liliana , Sampaio Ricardo , Coimbra Miguel , Contrast Medium Volume Optimization in Abdominal CT on Basis of Lean Body Weight, American Journal of Biomedical Engineering, Vol. 3 No. 6A, 2013, pp. 22-26. doi: 10.5923/s.ajbe.201310.04.
Article Outline
1. Introduction
- The development of multidetector CT equipment (MDCT) with increased spatial and temporal resolution, with acquisition of large volumes in a fraction of time previously needed, and the development of double head injectors, allowed for a revolution in abdominal CT imaging and improved diagnostic accuracy[1]. A low dose of iodinated CM results in low parenchymal enhancement and hence limits the diagnostic accuracy of the study. A high dose emphasizes lesions but increases cost and the likelihood of contrast media adverse reaction such as contrast-induced nephropathy (CIN). It would therefore be useful if a simple calculation method that leads to a more uniform hepatic enhancement among patients could be developed[2]. In the literature there are many protocols to calculate contrast volume administration in abdominal CT. The most common formulae calculate CM volume based upon the patient TBW. Other formulae do the same calculation based on the iodine concentration of the CM, using and iodine ratio of 0.521g per kilogram of body weight[3]. There are also centres that use a fixed volume of CM, no matter the patient’s size or body weight[2]. The most recent literature refers that calculating the CM volume based on the LBW may reduce patient-to-patient enhancement variability, while maintaining satisfactory hepatic enhancement. This method would allow one to achieve consistent hepatic enhancement[4,5] and may contribute to the estimation of optimal iodine doses to be used in obese patients[6]. A different approach, using body fat percentage (BFP) as been advocated in one study as a good method of calculating CM volume, but BFP is correlated with the LBW and essentially assumes the same principle, that fat does not capture significant amounts of CM and can be disregarded when calculating the optimal dose of CM to be injected[7]. To measure hepatic enhancement the portal/venous phase is the best. Liver enhancement occurs 40/50s after aortic enhancement. So there are two forms to acquire images in portal/venous phase: one uses an empirically delay of 70s or a more rigorous one uses a bolus-tracking program to determine the initiation[5, 8]. Literature considers a good hepatic enhancement when the variation between hepatic density before administration of CM and hepatic enhancement after CM administration is around 50-60 HU[3,5,7]. The main objective of this study is to verify if the volume of intravenous contrast medium in abdominal CT calculated on LBW allows good liver enhancement. To achieve this we define some specific objectives: to find if this method avoids low doses in slim patients and overdoses in fat patients; to verify how the method of volume calculate can influence de final volume (TBW/LBW), to verify if exist a correlation between hepatic enhancement calculates on basis of LBW and sex or age of individual.
2. Material and Methods
2.1. Explained Methods
- The data collection phase occurred between January and July 2011 in The Imaging Unit of Hospital da Boavista in Porto, Portugal.
2.2. Patients
- This study was approved by the administration of the Hospital da Boavista in Porto. The inclusion criteria were: acceptance and signing of an informed consent for all patients, patients proposed to an abdominal CT with administration of contrast media in a venous/portal phase, 20 gauge plastic intravenous catheter placed in an antecubital vein, injection rate of 3.5 mL/s and finally patients with orthostatic ability to measured and weighed. We excluded all exams with variations in the initial protocol, patients with hepatic steatosis and patients without clear visualization of hepatic veins in the venous phase (low cardiac debit).
2.3. Estimated LBW
- For each patient a sheet was created which recorded height and weight. The initial phase of the protocol was determine the value of LBW, estimated using the “Clinical Calculator” – The Medcalc©, which is based on the following formula:LBW (Men) = (1.10 x weight (kg)) - 128 (weight2 / (100 x height (m)) 2; LBW (female) = (1.07 x weight (kg)) - 148 (weight2 / (100 x height (m)) 2.
2.4. Calculation of CM Volume
- We adopted the ratio of Kondo (2010), adapted to protocol of the Imaging Unit of the Hospital da Boavista. In Kondo’s study the author´s used 600 mg I /kg of TBW and reached a value of 812 mg I /kg of LBW[5]. Protocol of Hospital da Boavista uses 525 mg I /kg of TBW (1,5 mL/kg). Using the same reasoning our new value is 718 mg I /kg LBW (2 mL/kg).
2.5. Equipment and Material
- The imaging was performed through a multidetector CT scanner (Siemens Somatom Sensation 40), sections at 1.2 mm detector collimation, 1.5 mm per rotation table feed and 1 pitch. Gantry rotation time was 0.5 s. We used Care Dose 4D, with 250 effective mAs, 120 kV and the acquisition was with a soft kernel filter (kernel 30F medium smooth) and abdominal window. The injection was performed by using a double head injector (Medtron Injekron CT2) allowing saline injection, immediately after injection of CM. The contrast media used was Iobitridol (Xenetix ®), with a concentration of 350 mg I / mL, which mean 767.8 mg I/mL of solution. This CM is classified as water soluble, non-ionic and low osmolality.
2.6. Acquisition Protocol
- All acquisitions were done using a protocol previously record in the CT console. The examination includes a control scan in the liver region and utilization of a bolus-tracking program to determine the initiation time of the venous/portal phase. A region-of-interest (ROI) with 1 cm2 was placed in the abdominal aorta and the image acquisition 40 s after ROI measure 150HU. The literature says that a real venous/portal phase occurs 40 s after arterial phase[8]. The CM volume was calculated based on LBW with an injection of 40 mL of saline solution and a rate of 3.5 mL/s.
2.7. Data Analysis
- Image analysis included three main stages, as described below. The first step consisted in checking all data sheets, confirming the values recorded on the data sheet (lean weight, calculating the CM volume) and also analysing all observations noted in the record susceptible to modify the result of the examination, for example, change in the protocol. The second was analysing all control scans (images without administration of CM) for measuring the density of the liver and spleen for evidence of hepatic steatosis (Figure 1). This analysis was performed with RadiAnt DICOM Viewer®. We used four ROI with 1 cm2, three in the liver and one in the spleen, so we can compare the liver density with the spleen density. The patients with liver density inferior to 40 HU and all patients with liver density superior to 40 HU but with less of 10 HU of spleen density were excluded[9, 10].
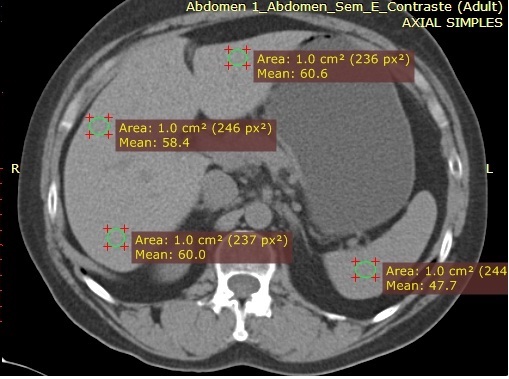 | Figure 1. Example of measuring the density of the liver and spleen for evidence of hepatic steatosis, in images without CM |
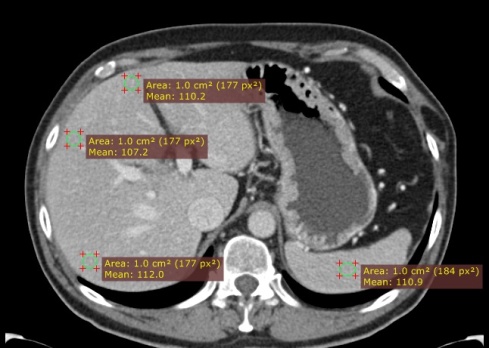 | Figure 2. Example of the method to measure liver enhancement, after CM administration |
2.8. Statistical Analysis
- Statistical analysis was performed using adequate software: Statistical Package for Social Sciences (SPSS, version 19.0). We used the analysis of frequencies to describe sample and analyse the distribution of hepatic enhancement. We used a Intraclass Correlation Coefficient (ICC) to validate data. Sample T-Test was used to verify how the method of calculation (TBW or LBW) influences the volume. To verify whether there was a statistically significant correlation between hepatic enhancement and age or sex we use Pearson correlation test.
3. Results
3.1. Patients
- The initial sample included 108 non-consecutive patients that met the enrolment criteria. Of 108 patients, 32 were excluded, due to changes to the protocol (8), unavailability of images (7), withdrawal of a patient participating (1), debit cardiac alterations (8) and hepatic steatosis (8). The final sample consisted of 76 individuals: 46 (60.5%) were male and 30 (39.5%) were female, aged between 19 and 87 years, a body weight between 45 and 93 kg and a height between 140 and 186 cm, according to Table 1.
| ||||||||||||||||||||||||||||
3.2. Intra-class Correlation Coefficients
- Since all measurements were performed by the same person, we calculated the intra-class correlation coefficients (ICC). An external evaluator analyzed 30% of the sample, selected randomly. Subsequently, these measurements were compared with the total sample, obtaining an ICC value of .909 for simple measures and .953 for average measures. We assume the measurements used as valid.
3.3. Hepatic Enhancement
- Our results show a uniformity of hepatic enhancement in the total analysis. Comparing hepatic density after CM administration with hepatic enhancement before CM administration, results show an average increase of 54 HU (Table 2). The variation between the maximum and minimum values after CM administration was 25.50 HU; the hepatic density variation before CM administration was 27 HU (Table 2).
|
|
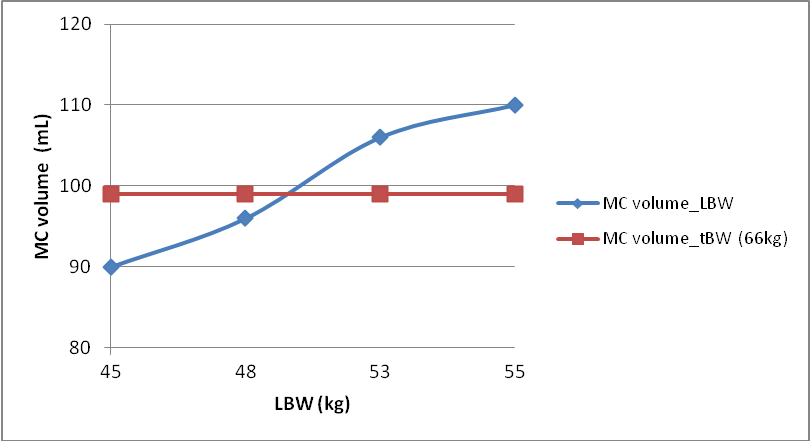 | Figure 3. MC Volume TBW/LBW |
4. Discussion
- Previous studies refer that to achieve an optimal hepatic enhancement the variation of HU will be around 50 – 60[1]. Since the density of normal liver also lies between 50 and 60 HU, we can consider values between 100 and 120 HU belonging to a good range of hepatic enhancement. In Table 3 is possible confirm that 96.05% of our results belong this range. Table 2 reveals also that the average variation of hepatic enhancement in our sample was 53.77 HU. If volume of CM is calculated based on TBW, patients with the same body weight receive the same volume of CM, independently of height and fat percentage[10]. According Figure 3, if we calculate the CM volume on basis of LBW in four patients with same body weight we obtain different values; in this case volume can vary between 90 and 110 mL. It is also important to observe that this new method does not reduce the volume. It optimizes it for each patient. We can also see in Figure 3 that to patients with same body weight, we may use higher or lower volumes, in comparing LBW to TBW. When we divided the patients into four groups of BMI, we verified that hepatic enhancement means are very close, which means a low variability of values. Some authors also recommend not calculating CM volume on basis of TBW in patients below 60 kg and over 90 kg[8]. We verify no significative statistic differences between men and women, unlike some previous studies[11,12]. The explanation lies in the fact that the calculation of LBW takes into account the sex of the individual. We think that previous studies observed differences between sexes because they used TBW to calculate CM volume. On the other hand we find a statistically significant correlation between hepatic enhancement and age, which is possibly related with changes in cardiac output that changes with age, and was not tested in this study. The fundamental point of this study is based on the following principle: when comparing vascularization of fat tissues with other tissues, such as muscle and solid bodies, that have a greater vascularity and therefore need more volume of CM[1,2,7,13,14]. When someone gets fat, there is an increase exclusively of fat mass. Thus, if we increase the value of CM linearly with the increase in weight it will occur overdose of these individuals. This means that it’s arguable that we should increase the volume of CM in proportion to weight, making more sense to calculate based on LBW[1, 5, 13,14]. The models for calculating the volume of CM based on the TBW try, in some way, to correct overdose imposing a maximum of CM volume. In some countries such as the United States, 120 mL is recommended as the maximum value. However, the relative values prevail and they aren’t adapted to the real individual constitution[4,5,15]. The division in four groups of BMI was important to demonstrate that there aren’t differences between slim and fat patients in hepatic enhancement.
5. Conclusions
- In clinical practice, the calculation of the volume of CM on basis of LBW translates into a low variability of liver enhancement – 25.50 HU. In our results 96.05% of sample belongs to a good hepatic enhancement. If we stratify sample by groups of BMI, we also verify no significative differences between slims and fat patients when analysed mean hepatic enhancement. We suggest that this could replace the calculation based on TBW.
ACKNOWLEDGEMENTS
- We would like to thank to all persons of Boavista Hospital who made this study possible, special to Unidade de Imagiologia.
References
| [1] | Rengo, M., Bellini, D., De Cecco, C. N., Osimani, M., Vecchietti, F., Caruso, D., Maceroni, M. M., et al. (2011). The optimal contrast media policy in CT of the liver. Part I: Technical notes. Acta radiologica (Stockholm, Sweden:1987), 52(5), 467-72. doi:10.1258/ar.2011.100499 |
| [2] | Li, J., Udayasankar, U. K., Tang, X., Carew, J., Toth, T. L., & Small, W. C. (2010). An optimal contrast dose indicator for the determination of hepatic enhancement in abdominal multidetector computed tomography: comparison of patient attenuation indicator with total body weight and body mass index. Journal of computer assisted tomography, 34(6), 874-8. doi:10.1097/RCT.0b013e3181ed2f72 |
| [3] | Heiken, J., Brink, J., CMClennan, B., Sagel, S., Crowe, T., & Gaines, M. (1995). Dynamic incremental CT: effect of volume and concentration of contrast material and patient weight on hepatic enhancement. Radiology, 195(2), 353-7 |
| [4] | Ho, L., Nelson, R., & Delong, D. (2007). Determining Contrast Medium Dose and Rate on Basis of Lean Body Weight: Does This Strategy Improve Patient-to-Patient Uniformity of Hepatic Enhancement during Multi–Detector Row CT? Radiology, 243(2), 431-437. |
| [5] | Kondo, H., Kanematsu, M., Goshima, S., Tomita, Y., Kim, M.-J., Moriyama, N., Onozuka, M., et al. (2010). Body size indexes for optimizing iodine dose for aortic and hepatic enhancement at multidetector CT: comparison of total body weight, lean body weight, and blood volume. Radiology, 254 (1), 163-9. doi:10.1148/radiol.09090369 |
| [6] | Yanaga, Y., Awai, K., Nakaura, T., Oda, S., Funama, Y., Bae, K. T., & Yamashita, Y. (2009). Effect of contrast injection protocols with dose adjusted to the estimated lean patient body weight on aortic enhancement at CT angiography. AJR. American journal of roentgenology, 192 (4), 1071-8. doi:10.2214/AJR.08.1407 |
| [7] | Kondo, H., Kanematsu, M., Goshima, S., Tomita, Y., Miyoshi, T., Hatcho, A., Moriyama, N., et al. (2008). Abdominal Multidetector CT in Patients with Varying Body Fat Percentages: Estimation of Optimal Contrast Material Dose. Radiology, 249(3), 872-877. |
| [8] | Fleischmann, D., & Kamaya, A. (2009). Optimal Vascular and Parenchymal Contrast Enhancement: The Current State of the Art. Radiologic Clinics of North America - Advances in MDCT (pp. 13-26). Elsevier. doi:10.1016/j.rcl.2009.01.003 |
| [9] | Hamer, O., Aguirre, D., Casola, G., Lavine, J., Woenckhaus, M., & Sirlin, C. (2006). Fatty liver: imaging patterns and pitfalls. Radiographics: a review publication of the Radiological Society of North America, Inc, 26(6), 1637-53. doi:10.1148/rg.266065004 |
| [10] | Bae, K., Seeck, B., Hildebolt, C., Tao, C., Zhu, F., Kanematsu, M., & Woodard, P. (2008). Contrast enhancement in cardiovascular MDCT: effect of body weight, height, body surface area, body mass index, and obesity. AJR. American journal of roentgenology, 190(3), 777-84.doi:10.2214/AJR.07.2765 |
| [11] | Suzuki, H., Oshima, H., Shiraki, N., Ikeya, C., & Shibamoto, Y. (2004). Comparison of two contrast materials with different iodine concentrations in enhancing the density of the the aorta, portal vein and liver at multi-detector row CT: a randomized study. European radiology, 14(11), 2099-104. doi:10.1007/s00330-004-2439-5 |
| [12] | Tanaka, J., Kozawa, E., Inoue, K., Okamoto, Y., Toya, M., & Sato, Y. (2011). Should the dose of contrast medium be determined solely on the basis of body weight regardless of the patient’s sex? Japanese Journal of Radiology, 29(5), 330-334. doi:10.1007/s11604-011-0563-0 |
| [13] | Bae, K. (2010). Intravenous Contrast Medium Administration and Scan Timing at CT: Considerations and Approaches. Radiology, 256(1), 32-61. |
| [14] | Bae, K. T. (2010). Administration and Scan Timing at CT : Considerations. Radiology, 256(1), 32-61. |
| [15] | Fishman, E. (2011). CT is US - advancing diagnosis imaging. Retrieved November 6, 2011, from http://www.ctisus.com/. |