-
Paper Information
- Next Paper
- Previous Paper
- Paper Submission
-
Journal Information
- About This Journal
- Editorial Board
- Current Issue
- Archive
- Author Guidelines
- Contact Us
American Journal of Biomedical Engineering
p-ISSN: 2163-1050 e-ISSN: 2163-1077
2013; 3(6A): 8-14
doi:10.5923/s.ajbe.201310.02
Image Quality Control in Digital Radiology
 Abstract
 Reference
 Full-Text PDF
 Full-text HTML
Susana Cândido 1, Luís Pedro Vieira Ribeiro 2, Anabela Magalhães Ribeiro 3, António Fernando Lagem Abrantes 4, João Pedro Pinheiro 5, Rui Pedro Pereira Almeida 6, Kevin Barros Azevedo 7
1BSc, Algarve´s University Health School (ESSUAlg), Algarve, Portugal
2PhD, Member of the Research Center of Sports and Physical Activity (CIDAF) of Coimbra University, Professor and Member of the Center for Health Studies (CES) of Algarve´s University Health School (ESSUAlg), Algarve, Portugal
3MSc, Coordinator Radiographer, Hospitalar Center of Barlavento Algarvio, Professor and Member of the Center for Health Studies (CES) of Algarve´s University Health School (ESSUAlg), Algarve, Portugal
4PhD, Member of the Research Center of Sociologic Studies of Lisbon´s Nova University (Cesnova), Professor and Member of the Center for Health Studies (CES) of Algarve´s University Health School (ESSUAlg), Director of the Radiology Department and professor at ESSUAlg, Algarve, Portugal
5Post-graduate, MSc student at the National Public Health School, Professor of the Radiology Department at Algarve´s University Health School (ESSUAlg), Algarve, Portugal
6Post-graduate, Member of the Center for Health Studies (CES), PhD Student at Beira Interior University, Professor of the Radiology Department at Algarve´s University Health School (ESSUAlg), Algarve, Portugal
7Post-graduate, Member of the Center for Health Studies (CES), PhD Student at Cranfield University, Professor of the Radiology Department at Algarve´s University Health School (ESSUAlg), Algarve, Portugal
Correspondence to: Luís Pedro Vieira Ribeiro , PhD, Member of the Research Center of Sports and Physical Activity (CIDAF) of Coimbra University, Professor and Member of the Center for Health Studies (CES) of Algarve´s University Health School (ESSUAlg), Algarve, Portugal.
| Email: |  |
Copyright © 2012 Scientific & Academic Publishing. All Rights Reserved.
Image Quality Control is an important factor that contributes to the improvement of patient care and overall diagnostic accuracy. Our purpose was to elaborate Quality Control Charts and demonstrate the importance of image quality control in a radiology department. A total of 37 random samples, composed of 30 x-ray exams each, were selected and analyzed. Primarily, data about image non-conformities were compiled to make three distinct Quality Control Charts. Secondly, improvement and corrective actions were suggested. Our results allowed us to identify and account for different types of non-conformities found on x-ray images. This illustrates the importance and necessity for the implementation of an adequate Image Quality Control in Digital Radiology.
Keywords: Image Quality, Quality Control, Control Chart, Non-conformities
Cite this paper: Susana Cândido , Luís Pedro Vieira Ribeiro , Anabela Magalhães Ribeiro , António Fernando Lagem Abrantes , João Pedro Pinheiro , Rui Pedro Pereira Almeida , Kevin Barros Azevedo , Image Quality Control in Digital Radiology, American Journal of Biomedical Engineering, Vol. 3 No. 6A, 2013, pp. 8-14. doi: 10.5923/s.ajbe.201310.02.
Article Outline
1. Introduction
- Nowadays medical imaging is essential and greatly used as an aid to medical diagnoses. Through the evolution of medical imaging equipment there is an increased association with digital technology, the implementation of image quality control becoming essential. The radiological image must have the quality needed for medical diagnosis. It should be obtained on the first attempt in order to avoid repetition of exams and the consequent exposure of patients to a higher dose of radiation. Technical errors are present when a radiological exam is not performed using the appropriate protocols, or is inappropriately processed[1]. To assess the quality of the radiological images produced it is necessary to monitor the production process. This monitoring can be accomplished through the development of quality control charts previously defined, where nonconformities can be identified.Through research conducted on quality management and quality aof radiological images, the vast majority of studies performed are concerned with radiological equipment quality control[2][3] to assess their functionality[4].It is very important for equipment to comply with legal requirements[4], but it is also essential that the quality control of the radiological image encompasses the entire production process and therefore radiographer performance cannot be forgotten. Thus, there is a need to accurately assess whether the images produced, possess enough quality to be used in a clinical diagnosis. The main objective is to study the quality control of digital radiographic images, through the elaboration of Quality Control Charts. As specific objectives: To assess the quality of digital radiographic images; To plan and suggest corrective and improvement actions; To contribute to the improvement of image quality and medical diagnostic.
1.1. Research Questions
- 1. Which quality control chart best suits a radiology department?2. Will there be a large number of non-conformities?3. What are the most common types of non-conformities?4. Which corrective actions should be suggested to improve image quality?
2. Methods
- In this section we present the methodology followed in conducting this research. We characterize the type of study, its location, the sample, the instrument, ethical issues and the procedures for collecting, processing and analyzing data.
2.1. Type of Study
- This is a case study that employs quantitative methods as we have to quantify the non-conformities existing on digital radiological images.
2.2. Location
- All data was collected from the radiology department of one major public hospital.
2.3. Sample
- The target population of this study comprises a series of conventional radiology exams. The set of exams concerns the following anatomical structures: Thorax, Abdomen and Foot x-rays. The sample is a stratified random sample. The probabilistic sample is a selection procedure in which each element of the population has the same probability of being selected[5].The X-ray exams selected were performed to the following anatomical structures: Chest (postero-anterior (PA), anteroposterior (AP) and lateral incidence), abdomen (PA and AP) and Foot (AP and internal oblique).This study comprises 37 samples of conventional radiology exams composed of 30 elements each. 640 are chest exams, 340 abdomen exams and 130 foot exams.
2.4. Variables
- The type of variable used is an attribute variable.
2.5. Instrument
- A specific checklist was made for this study. Contained in the header of the instrument sheet there is the following information: date, hour and the number of the exam.On the instrument there is information about:• Total number of selected exams;• Type of exam;• Anatomical Structure;• Conform Image;• Non-conform Image.In the end of the sheet there is information regarding the total number of conform and non-conform exams in the sample, as well as information about the radiographer´s shift.The program used for image visualization was the “Magic Web System”.The criteria to classify an exam as Conform (C) or Non-conform (NC) were made using guidelines on how to perform and classify radiology exams[6][7]. We considered conform when they are present in the study, in other words, requirements were obtained (quality criteria), previously established, as listed below:• Image processing: Radiographer ID, Side identification, Adequate Contrast;• Correct Patient Positioning: no overlapped structures, complete view from the study area;• Image artefacts: absence of metallic artefacts, clean Image Plate (IP), no movement artefacts.
2.6. Ethical Issues
- In accordance to institutional guidelines, the approval of this study was obtained from the review board and the data of the patients selected were kept confidential.
2.7. Data Processing and Analysis
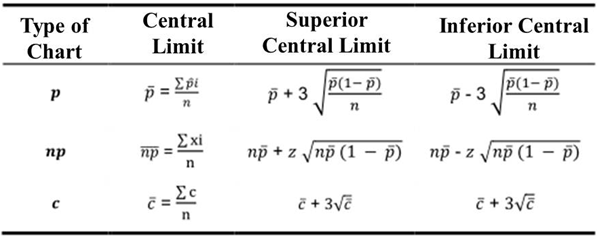
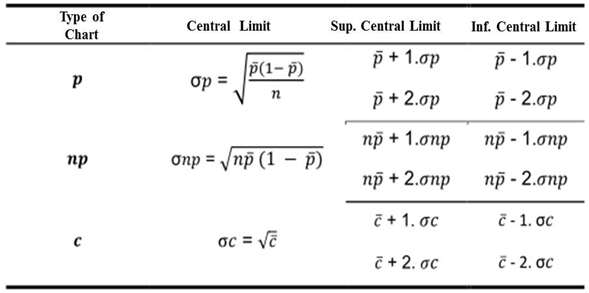
- The collected data was introduced in Microsoft Excel Office 2007, to calculate the control limits and construct the Control Charts by type p, np and c (Table 1). These charts classify a product as Conform or Non-conform and assess the overall image quality.Taking into account the sample size Type p Control Charts were chosen to determine the average percentage of non-conform exams and Type c Control Charts to identify the total number of Non-conform exams on each sample [8][9].
|
|
3. Results
- In this section we present the results of our research. Firstly, the data used to determine the Control Limits of the three control charts (Control Charts p, np and c). Secondly, we demonstrate the respective Control Graphics. Thirdly, the data related with the number of Non-conformity exams and the type of Non-conformities found.
3.1. Control Charts Preparation
- By grouping all data, we built several Control Charts:• Type p Control ChartA Type p Control Chart was made based on the proportion of Non-conformity exams of the samples. To ensure the quality and statistical control of our samples, an adjusted Type p Control Chart was made in order to eliminate outliers. The values of the Central Limit (CL), Superior Central Limit (SCL) and Lower Central Limit (LCL) were set to 59%, 86% and 32% respectively (Graphic 1).The adjusted Type p Control Chart does not present any sample outside the Control Limits, indicating that the quality of our samples is under statistic control. These values will be used as the standard Quality Control referential for Type p Control Charts.
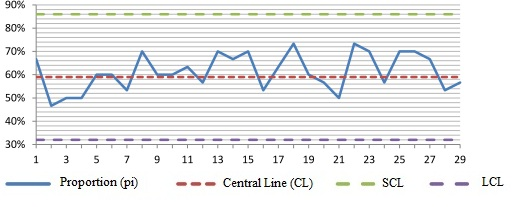 | Graphic 1. Adjusted Type p Chart composed of 29 Samples |
 | Graphic 2. Type np Control Charts |
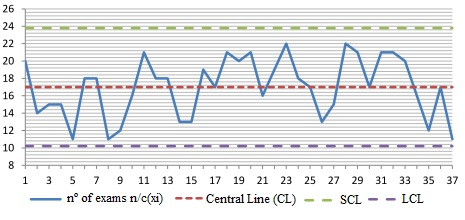
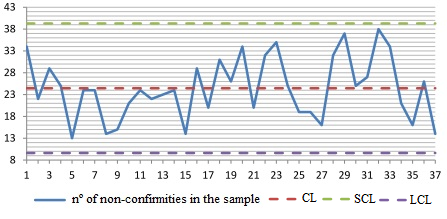 | Graphic 3. Type c Control Chart |
3.2. Analysis of x-ray Exams Collected
- Of all 1110 x-ray exams observed (37 samples, composed of 30 elements each) of the chest, abdomen and foot, there is a larger number of Non-conform exams than Conform exams with 57% and 43% respectively (Table 3).Of the 640 chest x-rays analysed, 40% were were Conform and 60% were Non-conform. Of the 340 abdomen x-rays analysed, 46% are Conform and 54% are Non-conform. Relatively to foot x-rays, 51% are Conform and 49% are Non-conform (Table 3).
3.3. Analysis of the Type of Non-conformities Identified
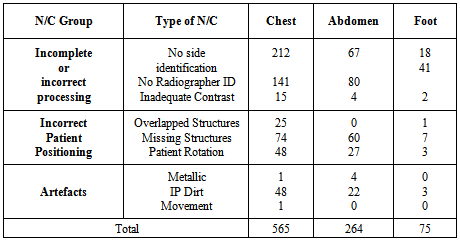
- An x-ray exam was considered Non-conform when at least one or more images, that constitute the radiographic study, did not meet the quality criteria set for this study (Table 4).Non-conformities were grouped into 3 groups:1. Incomplete/incorrect image process;2. Incorrect Positioning;3. Artefacts;Image processing is divided into 2 subgroups – Non-conformities that do not affect image interpretation (i.e. “right” or “left” side marking and radiographer´s identification) and Non-conformities that affect image quality (i.e. inadequate contrast). For Incorrect Positioning the following Non-conformities were identified: overlapped anatomical structures, missing anatomical structures and patient rotation. The Artefacts group had the following Non-conformities: metallic artefacts, Image Plate (IP) dirt/grains and movement artefacts.
|
|
|
4. Discussion
- A study on the evaluation of mammography in Australia, used two different benchmarks for evaluating mammography exams: the PGMI and the EAR (10). The first classified images as Perfect, Good, Moderate and Inadequate and the latter as Excellent, Acceptable and Repeat. In spite of the great subjectivity of these two benchmarks, the importance of radiological image quality in the detection and identification of breast tumors was clearly shown. Another study assessed technical errors in intraoral peri-apical radiographs[11] where 82.74% presented technical errors, but 50,51% were acceptable. This results shows us the importance of image quality improvement, because even if some images are acceptable for medical diagnosis, its interpretation becomes much more difficult.
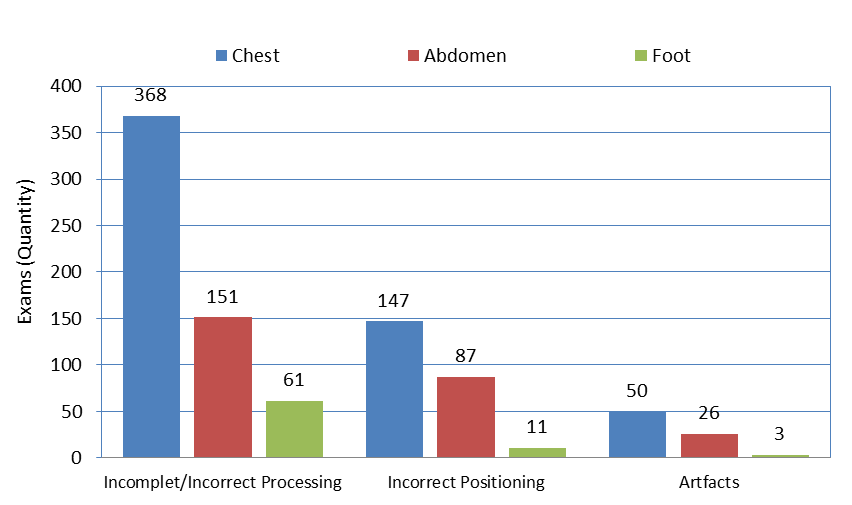 | Graphic 4. Non-conformities identified by anatomical structure (Chest, abdomen and Foot x-rays) |
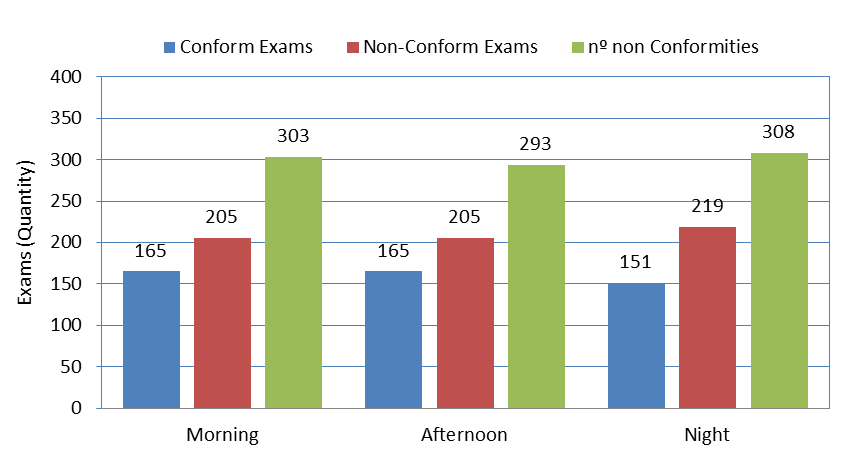 | Graphic 5. Distribution of Conform Exams, Non-conform exams and number of Non-Conformities |
5. Conclusions
- The existence of adequate quality control carried out on radiological images, allows greater uniformity of the final product and decreases the variability of exam execution, regardless of the Radiographer performing the exam. This type of control allows us to find out the causes of variability when it is out of statistical control, making corrective actions easier to apply.We can infer there is a necessity for improvement standardization in radiographic imaging that can be achieved through the implementation of a Quality Control of Radiographic Images.
5.1. Limitations
- • The virtual absence of studies related to this field of research, making results comparisons difficult;• Since this is a case study it is not possible to extrapolate results to other radiology departments;• Due to schedule limitations only three anatomical structures were studied;
5.2. Improvement Suggestions
- • This study focused on 3 main types of radiographic exams (chest, abdomen and foot x-rays). Further research is needed to implement the same methodology on other anatomical structures.
5.3. Recommendations
- To minimize the occurrence of non-conformities, corrective actions must be applied, such as:• The expansion of Quality Control Charts and Results through several institutions;• The performance of x-ray exams following established guidelines;• Always take into account collimation and the irradiated area of the patient;• Periodic Image Plate maintenance;
References
| [1] | Donnelly, L. F., & Strife JL. Performance-Based Assessment of Radiology Faculty: A Practical Plan to Promote Improvement and Meet JCAHO Standards. American Journal of Roentgenology. 2005;1398–401. |
| [2] | Osibote, A., Azevedo, A., Carvalho, A., Khoury, H., Oliveira, R., & Silva M. Exposição de pacientes e qualidade da imagem em radiografias de tórax: uma avaliação crítica. Radiologia Brasileira. 2007;(40):119–22. |
| [3] | Cunha, G., Machado, N., & Teixeira N. Controlo Estatístico do Processo - monitorização do desempenho de equipamento radiológico. In: Edições Sílabo L, editor. QuaLidade Numa Perspectiva Multi e Interdisciplinar. Lisboa; 2010. p. 186–91. |
| [4] | Ministério da Justiça. Decreto-Lei n.o 140/2004 de 8 de Junho[Internet]. Lisboa; 2004. Available from:www.ipq.pt/backhtmlfiles/dl140.html |
| [5] | Fortin, M.F., Côté, J., & Filion F. Fundamentos e Etapas do Processo de Investigação. 2nd ed. Loures: Lusodidacta; 2009. p. 1–540. |
| [6] | Practice guideline for digital radiography. In Practice Guidelines and Technical Standards. Reston, Va: American College of Radiology; 2007:23-57. |
| [7] | ACR practice guideline for the performance of pediatric and adult chest radiography. In: Practice Guidelines and Technical Standards. Reston, Va: American College of Radiology; 2006:233-238. |
| [8] | Shewhart control charts. ISO 8258:1991. 1991. |
| [9] | Pires AR. Qualidade: sistemas de gestão da qualidade. 3rd ed. Lisboa: Sílabo, LDA; 2004. |
| [10] | Moreira, C., Svoboda, K., Poulos, A., Taylor, R., Page, A., & Rickard M. Comparison of the validity and reliability of two image classification systems for the assessment of mammogram quality. Journal of Medical Screening. 2005;(12):38–42. |
| [11] | Carvalho, P. L., Neves, A. C., Medeiros, J. M., Zöllner, N. A., Carlos, R. L., & Almeida E.T. Erros técnicos nas radiografias intrabucais realizadas por alunos de graduação. Revista Gaúcha de Odontologia. 2009;2(57):151–5. |
| [12] | Proença JA. Implementação do controlo da qualidade da imagem radiológica digital. Revista da Faculdade de Ciências e Tecnologias. 2009;6–19. |
| [13] | Nancy R. Tague’s The Quality Toolbox, Second Edition, ASQ Quality Press, 2004, pages 247–249. |