-
Paper Information
- Next Paper
- Previous Paper
- Paper Submission
-
Journal Information
- About This Journal
- Editorial Board
- Current Issue
- Archive
- Author Guidelines
- Contact Us
American Journal of Biomedical Engineering
p-ISSN: 2163-1050 e-ISSN: 2163-1077
2013; 3(6A): 1-7
doi:10.5923/s.ajbe.201310.01
Image Quality Assessment of Head CT: Control Charts as an Useful Instrument
 Abstract
 Reference
 Full-Text PDF
 Full-text HTML
Joana Guiomar 1, Luís Pedro Vieira Ribeiro 2, Anabela Magalhães Ribeiro 3, António Fernando Lagem Abrantes 4, João Pedro Pinheiro 5, Rui Pedro Pereira Almeida 6, Kevin Barros Azevedo 7
1BSc, Algarve, Portugal
2PhD, Member of the Research Center of Sports and Physical Activity (CIDAF) of Coimbra University, Professor and Member of the Center for Health Studies (CES) of Algarve´s University Health School (ESSUAlg), Algarve, Portugal
3MSc, Coordinator Radiographer, Hospitalar Center of BarlaventoAlgarvio, Professor and Member of the Center for Health Studies (CES) of Algarve´s University Health School (ESSUAlg), Algarve, Portugal
4PhD, Member of the Research Center of Sociologic Studies of Lisbon´s Nova University (Cesnova), Professor and Member of the Center for Health Studies (CES) of Algarve´s University Health School (ESSUAlg), Director of the Radiology Department and professor at ESSUAlg, Algarve, Portugal
5Post-graduate, MSc student at the National Public Health School, Professor of the Radiology Department at Algarve´s University Health School (ESSUAlg), Algarve, Portugal
6Post-graduate, Member of the Center for Health Studies (CES), PhD Student at Beira Interior University, Professor and Member of the Center for Health Studies (CES) of Algarve´s University Health School (ESSUAlg), Algarve, Portugal
7Post-graduate, Member of the Center for Health Studies (CES), PhD Student at Cranfield University, Professor of the Radiology Department at Algarve´s University Health School (ESSUAlg), Algarve, Portugal
Correspondence to: Luís Pedro Vieira Ribeiro , PhD, Member of the Research Center of Sports and Physical Activity (CIDAF) of Coimbra University, Professor and Member of the Center for Health Studies (CES) of Algarve´s University Health School (ESSUAlg), Algarve, Portugal.
| Email: |  |
Copyright © 2012 Scientific & Academic Publishing. All Rights Reserved.
Themain objective of this research was to determine if the diagnostic image, acquired by CT scan, meets the quality criteria previously established for head CT exams. A total of 360 Head Computed Tomography exams were analyzed, using a checklist. For data collection, quality criteria were created, organized into four criteria groups, consisting of multiple items that must appear in the images studies. After data processing, a large number of non-conformexaminations were identified in than more than 50% of the sample. We concluded the main causes of these results are: the “incorrect or incomplete positioning”, the lack of name of the radiographer and “motion artefacts”. Therefore it is essential to implement a checklist for a systematic evaluationof procedures.
Keywords: Image Quality, Computed Tomography, Conformities, Quality Control Charts
Cite this paper: Joana Guiomar , Luís Pedro Vieira Ribeiro , Anabela Magalhães Ribeiro , António Fernando Lagem Abrantes , João Pedro Pinheiro , Rui Pedro Pereira Almeida , Kevin Barros Azevedo , Image Quality Assessment of Head CT: Control Charts as an Useful Instrument, American Journal of Biomedical Engineering, Vol. 3 No. 6A, 2013, pp. 1-7. doi: 10.5923/s.ajbe.201310.01.
Article Outline
1. Introduction
- The Quality Control of the Computed Tomography (CT) image is critical, because examinations performed must have good diagnostic quality without resorting to repeated examinations. The relevance of this issue is the fact that there are few studies conducted on this subject and those that arise in the bibliography are more directed to the Quality Control of Radiology equipment, not showing the importance of quality in the product (radiologic image).Although equipment complies with quality program, the technique applied by radiographers may not be the most accurate, while performing the imaging study and non-conformities occur diminishing the quality of examination.Our main objective is to evaluate image quality of Head Computed Tomography (HCT), through a benchmark of quality. On the other hand, this goal leads to other more specific objectives, such as to determine the image quality of HCT through control charts, performed in aradiology department. To identify the presence of conformities and non-conformities in the radiological image,we created corrective actions that may be implemented to reduce the incidence of non-conformities and, ultimately, understand the causes of the existence of non-conformities.Therefore, themain objective of this research is to determine if the diagnostic image, acquired by CT scan, meets the quality criteria previously established for head CT exams.This research is supported on a problem that origins various research questions such as: “what is the best control chart that applies the Quality Control of HCT imaging?”; “when evaluating HCT images, are they in agree with the quality criteria?”; “what causes the presence of non-conformities, including corrective actions to be recommendedandeliminate the presence of non-conformities in the HCT images?”.The data obtained in the bibliography on the Quality Control in radiological imaging is scarce, since the predominancestudies areabout equipment quality. However, it is possible to find studies related to the Quality Control of radiological image in the valences of general radiology and computed tomography[1,2,3,4,5].
2. Methods
- HCTstudies are the imaging exams with a higher incidence inRadiology Department, and the majority of patients come from the emergency. We performed a case study that employed quantitative methods, containing a sample of 360 HCT studies performed between February to December 2012 and randomly selected in order to determine if the diagnostic image, acquired by CT scan, meets the quality criteria previously established for head CT exams, without knowledge of the radiology staff.This sample was organized into 12 subsamples, with 30 HCTscans each. Patients and Radiographers were not informed about the purpose of the study in order to eliminate bias and permission to collect data was acquired from the ethics board.For data collection,quality criteria were created, guidelines for performing and interpreting diagnostic computed tomography, organized into four criteria groups, consisting of multiple items that must appearin the images studies[6,7]. We considered conform when they are present in the study, in other words, requirements were obtained (quality criteria), previously established, as listed below:• Preparation of a correct and complete exam:ο Presence of the name of the Radiographer;ο Presenceof the name of the Radiologist;ο Presence of the Patient's name and identification number.• Correct positioning;• Absence of artefacts in the image:ο Motion (patient motion);ο Metals (dental prostheses, and other foreign objects);ο System (artefact problems associated with the operation of the equipment); ο Image noise;• Criteria for successful execution:ο FOV (field of view) suited to study the structure;ο Reference dose levels appropriate to the study;ο Examination appropriate to the aims of the study.In the absence of at least one of these quality criteria we consider the presence of non-conformities, making the study non-conform.The data collection took place in March 2013, using a checklist, in which there was the time, day, month and year in which the HCT studies were performed as well as the type of non-conformities identified. Furthermore, this consisted of the total ofnon-conformand conformstudies in each sample, organized by work shift (morning, afternoon and night).In accordance to institutional guidelines, the approval of this study was obtained from the review board and the data of the patients selected were kept confidential. For data analysis, we used the Statistical Package for the Social Sciences (SPSS) V.20 and a control chart with the type attributes p, np and c with Microsoft Office Excel 2007.These charts classify a product as Conform or Non-conform and assess the overall image quality. A Type p Control Chart was made based on the proportion of Non-conformity exams of the samples. A Type np Control Chart was made based on the total number of non-conformity exams of each sample. A Type c Control Chart was made based on the total number of Non-conformities of each sample.
3. Results
3.1. Quality Control Charts
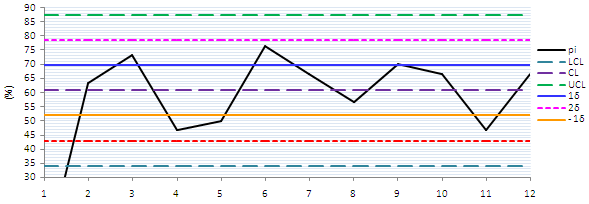 | Chart 1. p-type, with the limits and warning control, compared to CL |
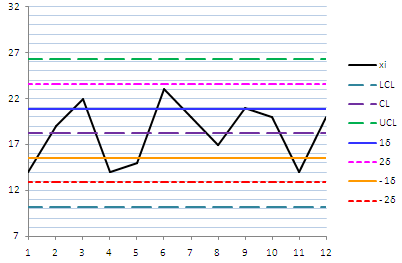 | Chart 2. Type np, with limits and warning control, compared to CL |
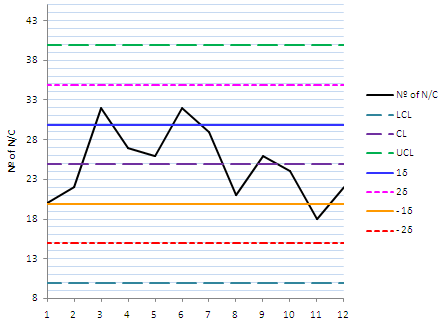 | Chart 3. Ttype c, with the Limit and Warning Control, compared to CL |
3.2. Quality Criteria
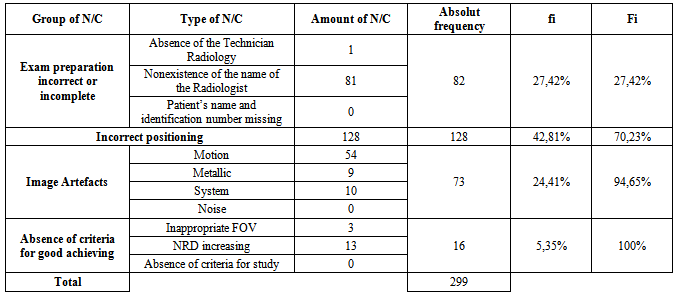
- In the total sample observed, 219 HCT studies were not conform, since they didn’tsatisfied at least one of the quality criteria item, previously defined. Thus, 60.83% of the sample non-conform. The main explanation for the high percentage of non-conform studiesis the large number of non-conformities detected during the data collection. Table 1 illustrates, through the relative (fi) and absolute (Fi) frequency which groups of non-conformities that contributed to the presence of not conform studies.
|
|
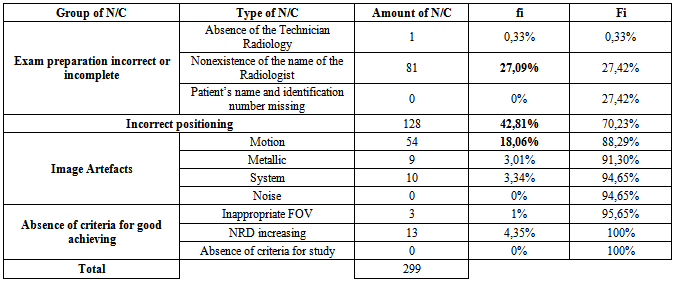
- On the other hand, the types of non-conformities, which arise more often, consist of "incorrect positioning" (42.81%), in the "absence of the name of Radiologist" (27.09%) and "motionartefacts" (18.06%) (Table 2).In addition, we evaluated the number of HCT studies non-conform per shift, in the morning it were observed 100 examinations, in the afternoon173and 87 in the night.It was also found that in the afternoon shift the percentage of non-conformwas higher than in the other two shifts, yielding a value of 28.06%, followed by the night shift (17.22%) and the morning shift (15.56%).
4. Discussion
4.1. Interpretation of Control Charts
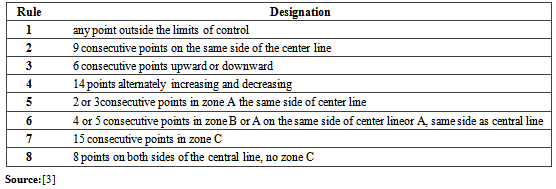
- The quality control charts more suited to the study of data collected, are the attributes of type p, np and c, because they allow tostudy the percentage of non-conformstudies, the number of non-conformities exams and non-conformities in each sample, respectively.For the charts type p and np planning, it was essential to calculate the percentage of non-conform studies per sample, while for charts typec, we calculated the proportion ofnon-conformities per sample. Subsequently, we determined the values of CL and UCL and LCL for each chart.For the p-type control chart, the values obtained for the central limit, limit control top and bottom, corresponded, respectively, to 60.83%, 87.57% and 34.09%.It was found, with the preparation of Chart 1 that the samples were within normal limits, it is not necessary to remove outliers and identify non-conformities that were out of statistical control, which is the benchmark for the control chart type p in accordance with ISO 8258:19916.Taking into account the values obtained for the control limits of this chart, it is expected that, in each observed sample, approximately, 61% of the thirty elements arise on average as non-conform. On the other hand, the p-type control chart imposes limits on the percentage ofnon-conformexams that may arise. In this way, we have a maximum of 87.57% and a minimum of 34.09%.The values mentioned above, are high, but it can be explained by the high number of non-conformities recorded (Tables 1 and 2). Another justification for the large gap between the UCL and ICLcould be the small number of elements containing in the twelve samples, ie, a small n, conditioning so that the process is always under statistical control, essentially in the control charts typep, but, if the range is reduced (samples with large n), implying that the process get out of statistical control.The control charter of nptype, which study the number of non-conformexams in the sample, had as reference for the limits of control, the following values: LC (18.25%); LCS (26.27%) and LCI (10.23%). Not needing adjustments, like the charter of the p-type control, it was added to the warning top and bottom limits (Chart 2), which, according to ISO 8258:1991[8], considers the model obtained as a reference standard for control chart type np.Interpreting this chart, one comes to the conclusion that in this study, a sample of 30 elements, there may be an average of 18 exams which did not conform, but for the same sample the maximum HCT studies non-conform is 26 and the minimum 10. However, these values are strongly influenced by the number of non-conformities identified in each of the thirty elements of the sample.To study the number of non-conformities that arise in each sample, it was constructed the control charter type c, which have as values for CL, UCL and LCL, the ones shown in Chart 3, such as the warning limits used to study the trend of non-conformities identified in 12 samples evaluated, taking into account the ISO 8258:1991.In each sample, it can be registered, on average, about 25 non-conformities, the maximum being 39.89 percent non-conformities to be identified and the minimum 9.94. If in a given sample, these values are exceeded, it will consider the process out of statistical control.
|
4.2. Study of Non-conform Exams
- Given the fact that the total sample of observed HCT studies, we proceeded to calculate the relative frequency to determine the percentage of non-conform HCT studies and found that approximately three fifths of the studiedpopulation are non-conform testing, and only two-fifths are conform. In other words, more than half of the elements of the total sample (n = 360) have non-conformities, which may be, in the short and medium term, fixed through corrective and appropriate actions targeted for each identified problem, increasing the level of quality fromthe radiological studies performed in the Imagiology Department.Furthermore, we proceeded to the evaluation of HCT studies non-conform per shift (morning, afternoon and night). It is important to note that the number of elements in each round is not uniform, despite the fact that, it was found that the number of non-conform studies prevails mainly during the afternoon shift followed by morning and night shift.The high proportion of non-conform HTC studies is justified by the number of non-conformities detected during data collection.
4.3. Data Analysis for Non-conformities
- Within the four groups previously defined for the study of non-conform, incorrect positioning of the group, was responsible for almost half of all non-conform obtained, followed by the group of Preparation of an incomplete or incorrect, Artefacts in the image and Absence of good criteria achievement (Table 1).The most common type ofnon-conformities werethe group of exam preparation incomplete or incorrect, consisted in "Absence Name Radiologist". However, in addition to the high percentage of artefacts in the image, there is a predominance of "motionartefacts" beyond, the “systemartefacts” and the "metallic" ones (Table 2). On the other hand, a small quantity of non-conformities identified corresponds to the "increase of the diagnostic reference levels" belonging to the group of the “lack of proper performance criteria”.This total non-conformities explains the high number of HCT studies not conform, noting that the main existingnon - conformitiesboils down to "incorrect positioning", "motionartefacts" and "nonexistence of the name of the Radiologist". The first two affect image quality, both interpretation and diagnosis, as established in quality criteria, it is essential, from this analysis, to create Fishbone diagram (cause-effect) (Figure 1), to realize the source of non-conformities to create corrective, objective and appropriate actions, so that they can be applied in order to reduce those undesirable effects aiming to obtain quality images[9].Briefly, it can be noted that the main causes for these three major non-conformities are: unstable or uncooperative patient, elderly, overwork, fatigue, incorrect positioning and wrong immobilization technique, among others.
5. Conclusions
- Through the literature search performed, we can see that the quality control of aradiological imageto perform diagnosis is recent and taking the first steps. The term quality is closely linked to the equipment’s ability to produce ananatomical image of the patient, regardless the subsequent diagnosis.So, it is equally important to assess the quality of the radiological technique, since the radiological image is the product obtained in the radiology department and, this, like any other product that may be acquired in any other type of industry, must contain certain requirements. Thus, it is fundamental to perform a control process of image acquisition, with the aid of an appropriate quality criteria targeted to the intended study and to use control charts to see if the process is within statistical control.The ISO 9001:2008 regulates the radiology department, and defines the work instructions for the conduct of all examinations performed[10]. Nevertheless, there isn’t a program of quality control that focuses in all radiological examinations carried out,whichmay proceed to the construction of cause and effect diagrams. Finding the causes of the problems is the only way to suggest corrective actions that may be applied, also providing training and rewards for good results.A program of quality control, mainly in Radiology Department, provides a uniform final product and encourages Radiology Technicians to be aware, confident, critical, innovative, demanding and discerning in their work.Having regard to the objectives set for this study, we verified the existence of a large number of non-conform HCT studies, in which the major non-conformities detected were "incorrect positioning", the "nonexistence of the name of the Radiographer" and "motionartefacts." These can be corrected if a service organization develops quality control programs directed to the same goals and to the institution, as well as for the implementation of suggestions given in this work.
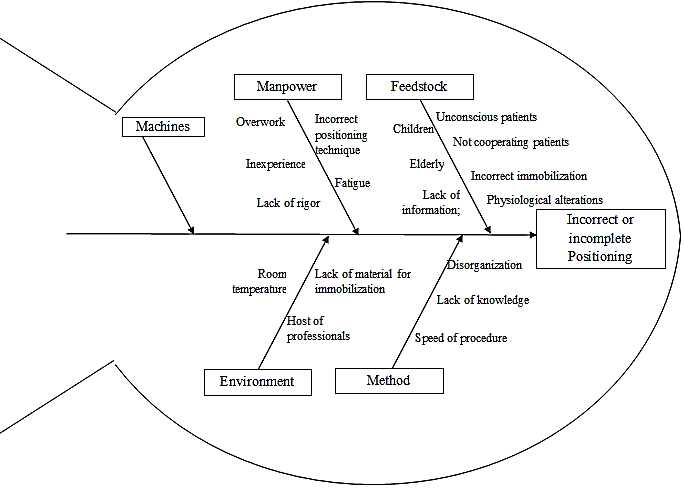 | Figure 1. Diagram of cause and effect for non-conformities "incorrect or incomplete positioning” |