-
Paper Information
- Next Paper
- Previous Paper
- Paper Submission
-
Journal Information
- About This Journal
- Editorial Board
- Current Issue
- Archive
- Author Guidelines
- Contact Us
Advances in Analytical Chemistry
p-ISSN: 2163-2839 e-ISSN: 2163-2847
2015; 5(3A): 9-18
doi:10.5923/s.aac.201501.02
Electrooxidation of Urea on the Nickel Oxide Nanoparticles and Multi-walled Carbon Nanotubes Modified Screen Printed Electrode
 Abstract
 Reference
 Full-Text PDF
 Full-text HTML
Elaheh Lohrasbi, Mehdi Asgari
NFCRS, NSTRI, Tehran, Iran
Correspondence to: Mehdi Asgari, NFCRS, NSTRI, Tehran, Iran.
| Email: |  |
Copyright © 2015 Scientific & Academic Publishing. All Rights Reserved.
The multi-walled carbon nanotubes-NiO nanoparticles composite (MWCNT-NiO) prepare and the composite use for modification of screen printed electrode (SPE) for urea electrooxidation and impedimetric detection in alkaline medium (0.1 M NaOH). The nature and morphology of the MWCNT-NiO characterize by X-Ray Diffraction (XRD) and Transmission Electron Microscopy (TEM), respectively. The electrochemical behaviour of MWCNTs-NiO nanoparticles composite in an alkaline medium of urea study using cyclic voltammetry, chronoamperometry and Electrochemical Impedance Spectroscopy (EIS). The peak on the voltammogram for MWCNT-NiO composite modified electrode in alkaline medium of urea observes which is ascribed to the urea oxidation in alkaline medium. The obtained results discuss from the point of view of employment of the MWCNT–NiO composites for the catalytic electrodes of urea for hydrogen production.
Keywords: Electrocatalysis, Nickel oxide, Nanoparticle, Carbon nanotube, Screen printed electrode, Urea, Electrooxidation
Cite this paper: Elaheh Lohrasbi, Mehdi Asgari, Electrooxidation of Urea on the Nickel Oxide Nanoparticles and Multi-walled Carbon Nanotubes Modified Screen Printed Electrode, Advances in Analytical Chemistry, Vol. 5 No. 3A, 2015, pp. 9-18. doi: 10.5923/s.aac.201501.02.
Article Outline
1. Introduction
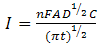
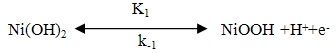
- The utilization of wastewater for useful fuel has been gathering recent attention due to society’s need for alternative energy sources. The electrooxidation of urea found at high concentrations in wastewater simultaneously accomplishes fuel production and remediation of harmful nitrogen compounds that currently make their way into the atmosphere and groundwater [1]. Pure hydrogen was collected in the cathode compartment at 1.4 V cell potential, where water electrolysisdoes not occur appreciably. It was determined that aninexpensive nickel catalyst is the most active and stable for the process. The electrochemical treatment for urea-rich wastewater has recently become the focus of attention due to its potential applications, including wastewater remediation, hydrogen production, electrochemical sensors [2], and fuel cells [4, 5]. Various noble metal catalysts have been used for urea electro-oxidation [6-8].Botte et al. [3] had successfully demonstrated the electrolysis of urea to produce hydrogen using Ni electrodes in alkaline medium. Some studies have been done in the past to identify the mechanism of urea hydrolysis in the presence of urease (with Ni active sites), both experimentally and theoretically [9, 10], according to the following reactions:
 | (1) |
 | (2) |
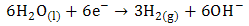 | (3) |
 | (4) |
2. Experimental
2.1. Reagents and Apparatus
- NiSO4.7H2O, boric acid, sodium hydroxide and urea of analytical reagent grade were prepared from Merck and were used without further purification.The electrochemical experiments were carried out utilizing an Ivium Compactstate electrochemical analyzer equipped with a personal computer which was used for data storage and processing. A screen-printed carbon electrode (SPE) (3 mm in diameter) from Dropsens (Spain) was used as a planar three electrode based on a graphite working electrode, a carbon counter electrode and a silver reference electrode. The electrode was rinsed in deionized water and preconditioned in 0.1 M HCl solution by potential scanning in –400 to +1000mV at a scan rate of 100 mVs-1.For all experiments, 50µL of electrolyte was dropped on the SPE which all electrodes covered by electrolyte.EIS experiments carried out with a dc-offset potential of 750 mV and in the frequency range of 100000 to 0.01 Hz. Transmission electron microscopy (TEM) image was determined with a Philips CM10 TEM. A personal computer was used for data storage and processing.
2.2. Modified Electrode Preparation
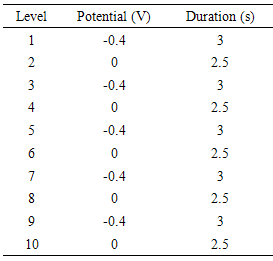
- Multi-walled carbon nanotubes (MWCNTs) were refluxed in the mixture of concentrated H2SO4:HNO3 (3:1) for 6 h to obtain the carboxylated multi-walled carbon nanotubes. The MWCNTs were washed with doubly distilled water and dried in vacuum at 80°C. MWCNTs (16 mg) and 5 µL of 5.0% nafion solution were dispersed in 5 mL water with ultrasonication for 1 h to get a homogenous suspension. 10 µL of the suspension was casted onto the surface of screen printed electrode and dried at room temperature. The deposition baths were prepared using NiSO4.7H2O with a total concentration of 40.0mM for all solutions. The pH of the bath was adjusted in 2 by adding boric acid. The pulse potential for producing NiO nanoparticles on the electrode was applied according toTable 1. The sizes of particles were controlled by changing the number of pulsesgone through in the depositions. It is clear that the increasing of the pulses caused the formation of a larger particle of modifier on the surface of SPE/MWCNT modified electrode. The prepared modified electrode was conditioned in 0.10 M NaOH solution by potential cycling between zero to 850 mV for about 30 cycles of potential scans with a scan rate of 100 mVs-1. These parameters were obtained experimentally as optimum values for complete transformation of Ni (ΙΙ) to Ni (ΙΙΙ) and maximum activation of electrode surface in electrocatalytic oxidation of urea. All electrochemical investigations were performed at the room temperature.
|
3. Result and Discussions
3.1. Nanostructure of the Nanocrystalline NiO-MWCNT Composite
- In the TEM image of the nanocrystalline MWCNT-NiO composite shown in Fig.1a, it can be seen that the Nickel nanoparticles are distributed on the MWCNTs surface in the form of single stick. The Nickel oxide nanoparticles can therefore grow by repeated electrodeposition on the MWCNT matrix under a homogeneous distribution (Fig.1a). It can be deduced from these images that aggregation of the NiO nanoparticles is not obvious for all particles, and the nanoparticles are widely dispersed on the MWCNTs. Almost NiO particles are coated on MWCNT surface, and the particle sizes for all MWCNT samples are found to be constant 30–50 nm. The deposition of uniformly dispersed nanoparticles on MWCNTs is believed to be the result of uniform surface functional sites on all nanotubes that can be created in the chemical-wet oxidation of nitric acid. During the surface modification process, the surface oxides may act as active sites in adsorbing with Ni ions, thus forming an intermediate complex in the aqueous phase. Consequently, the surface coverage accessible to Ni (II) adsorption depends on the ionic concentration. Within the fixed period, the particles can grow in an equivalent size, in different particle densities over the surface of MWCNTs. It is well known that oxygen functional groups donate a surface polarity, i.e. surface electrostatic field, to carbon surfaces [13, 14]. The interaction of the electrostatic field on the surface with the dipole moment of water molecules plays a crucial role in determining the saturation of carbons in aqueous solutions.
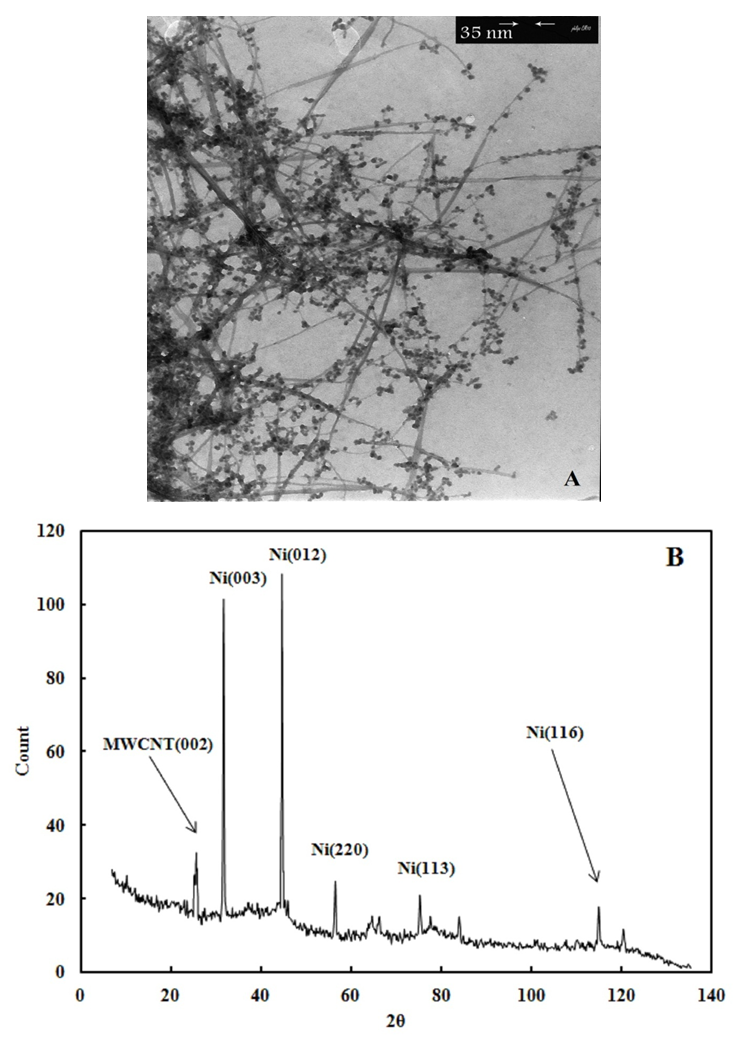 | Figure 1. TEM image (A) and XRD pattern (B) of MWCNT/NiO composite |
3.2. Electrocatalytic Oxidation of Urea on the SPE/MWCNT-NiO Modified Electrode
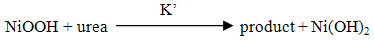
- Fig. 2A represents the cyclic voltammograms of the SPE/MWCNTs-NiO modified electrode in 0.10 M NaOH solution recorded at different potential scan rates in a wide range of 5-500mVs-1. A pair of well defined peaks with peak potentials of 478mV and 385mV appears in the voltammograms for anodic and cathodic reactions, respectively, and the peak-to-peak potential separation (at the potential scan rate of 10mVs-1) is 93mV. The voltammograms shown are similar to those previously reported [14, 16, 18], and the redox transition involved is attributed to the presence of Ni (II)/Ni (III) species. The peak-to-peak potential separation deviates from the theoretical value of zero and increases at higher potential scan rates. This result indicates a limitation in the charge-transfer kinetics, which is due to: (a) the chemical interactions between the electrolyte ions and the modifier film, (b) the dominance of electrostatic factors, (c) the lateral interactions of the redox couples present on the surface and/or (d) the non-equivalent sites present in the film.The voltammograms shown in Fig. 2A also indicate that the anodic and cathodic peak currents are proportional to the potential scan rate at low values of 5-100mVs−1 (Fig. 2B). This result is attributable to the electrochemical activity of an immobilized redox couple on the surface. From the slope of this line and using [28]:
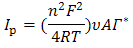 where Ip is the peak current, A is the electrode surface area and Γ* is the surface coverage of the redox species and taking the average of both cathodic and anodic currents, a total surface coverage of the electrode with the modifier film of about 7.7×10⁻⁹mol cm-2 is achieved. In the broad range of potential scan rates of 150-500mVs-1 (Fig. 2C), this dependency is of square root form, signifying the dominance of a diffusion process as the rate-limiting step in the total redox transition of the modifier film. This limiting-diffusion process, which is also reported for other Ni-based modified electrodes [19-21], may take place for the charge neutralization of the film during the oxidation/reduction reaction.
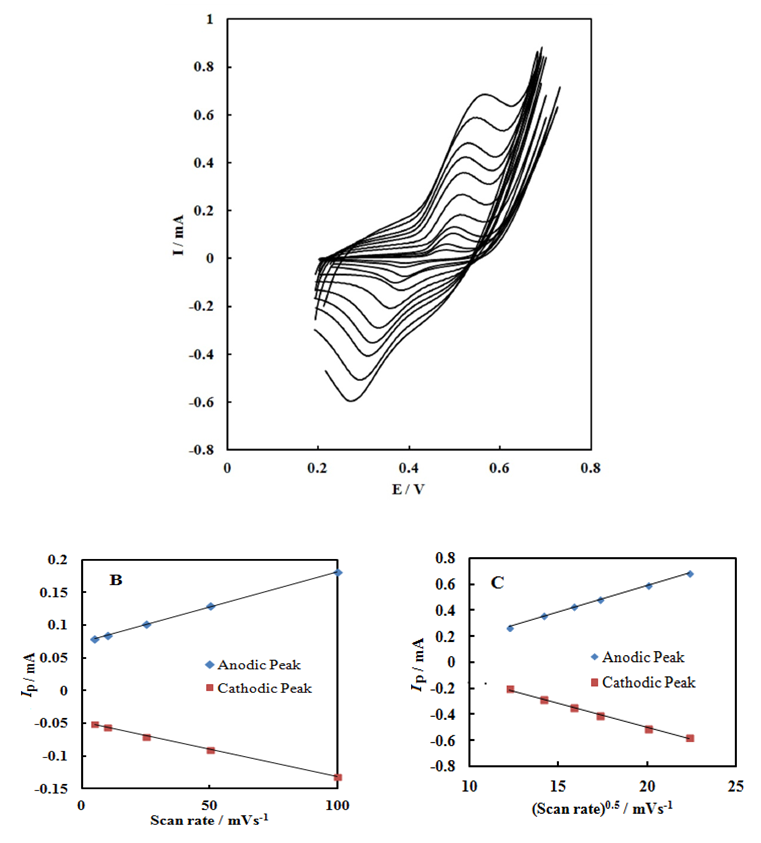 | Figure 2. (A) cyclic voltammograms of the SPE/MWCNTs/NiO modified electrode in 0.10 M NaOH solution recorded at different potential scan rates in a wide range of 5-500  . (B)Variation of the anodic and cathodic peak currents versusthe potential scan rate values of 5-100 . (B)Variation of the anodic and cathodic peak currents versusthe potential scan rate values of 5-100 . (C) Variation of the anodic and cathodic peak currents versusthe square root of potential scan rate values of 150-500 . (C) Variation of the anodic and cathodic peak currents versusthe square root of potential scan rate values of 150-500 |
 | (1) |
 | (2) |
 | (3) |
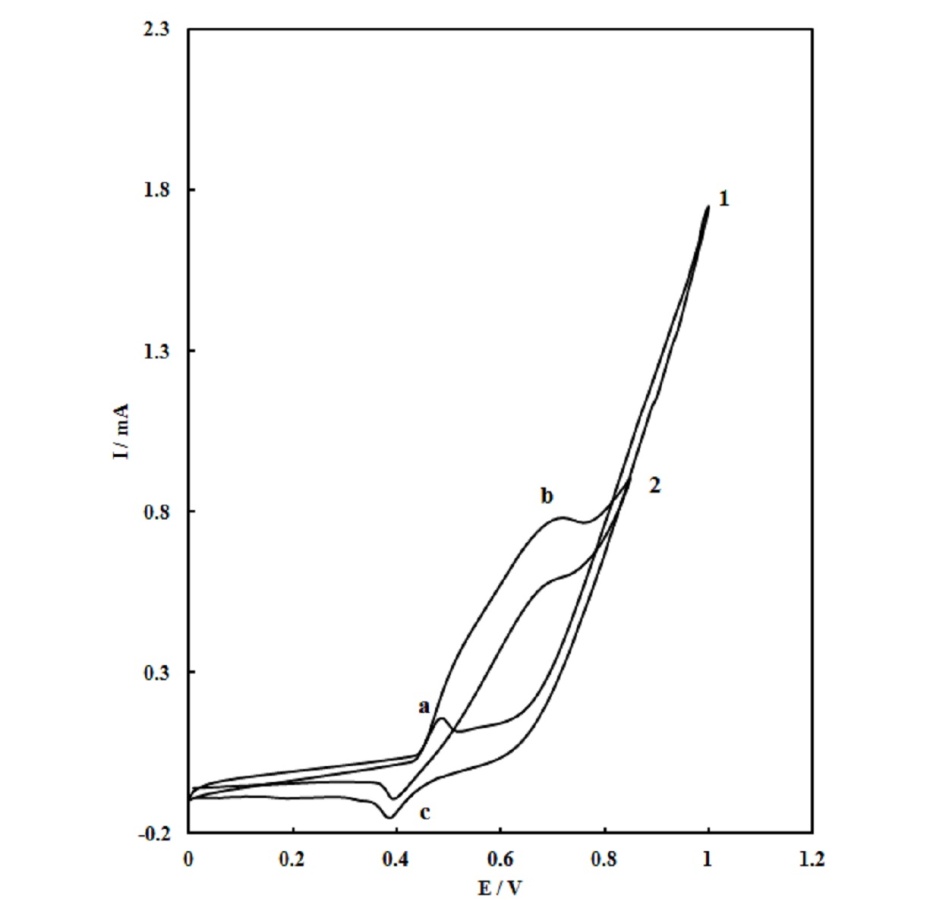 | Figure 3. Voltammograms recorded for SPE/MWCNTs/NiO modified electrode in the absence (1) and in the presence of 0.10 M urea (2) with scan rate of 25  |
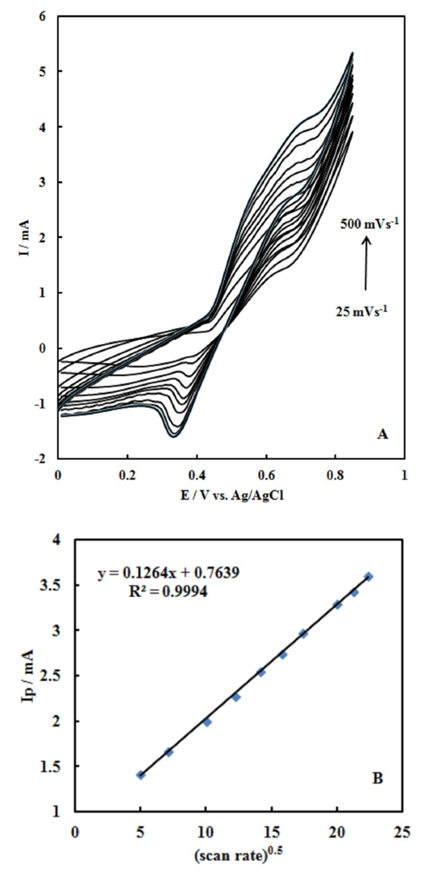 | Figure 4. (A) The effect of scan rate on the peak current ratio at SPE/MWCNTs/NiO modified electrode in 0.10M NaOH + 0.10M urea. (B) Variation of the anodic peak currents versusthe square root of potential scan rate |
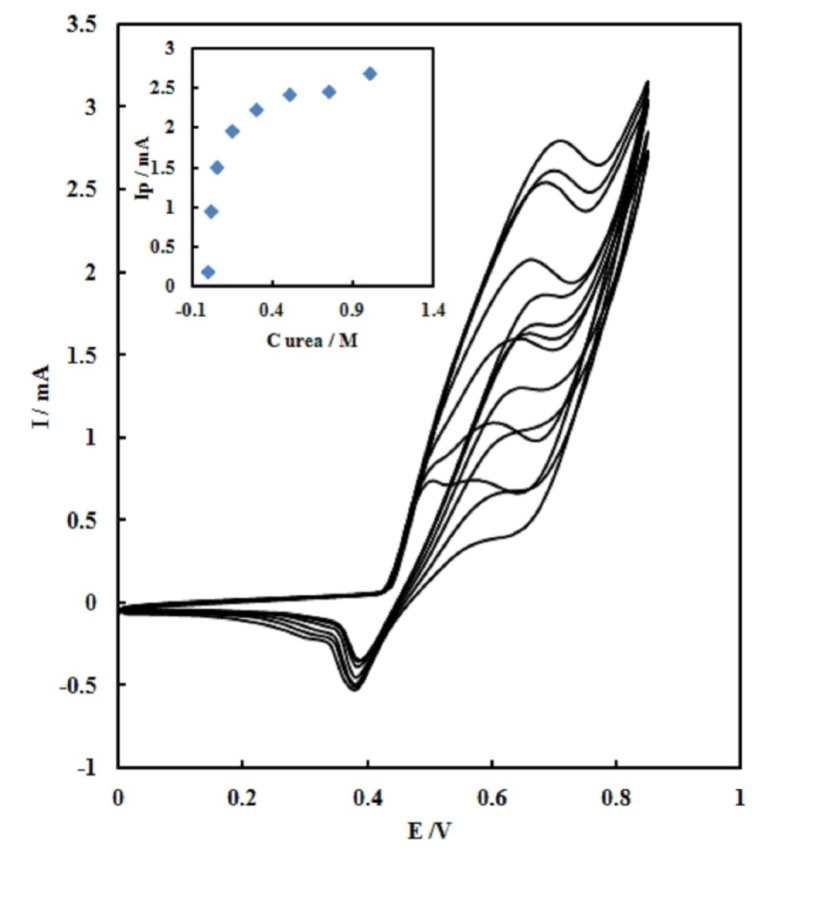 | Figure 5. Cyclic voltammograms of the SPE/MWCNTs/NiO modified electrode in 0.10M NaOH containing different concentration of urea. Inset: Variation of the anodic peak currents versusthe urea concentration in the range of 0.003 to 1.0 M with scan rate of 25  |
3.3. Chronoamperometric Study
- The electrocatalytic oxidation of urea on the SPE/MWCNTs-NiO modified electrode was studied using chronoamperometry. Double-step chronoamperograms were recorded by setting the working electrode potentials to the desired values used to measure the catalytic rate constant on the modified surfaces. Fig. 6 shows the double-step chronoamperograms for the SPE/MWCNTs-NiO modified electrode in the absence and presence of different concentrations of urea. The applied potential steps were 750 and -200 mV. The current was negligible when the potential decreased to -200 mV, indicating that the electrocatalytic oxidation processes were irreversible.
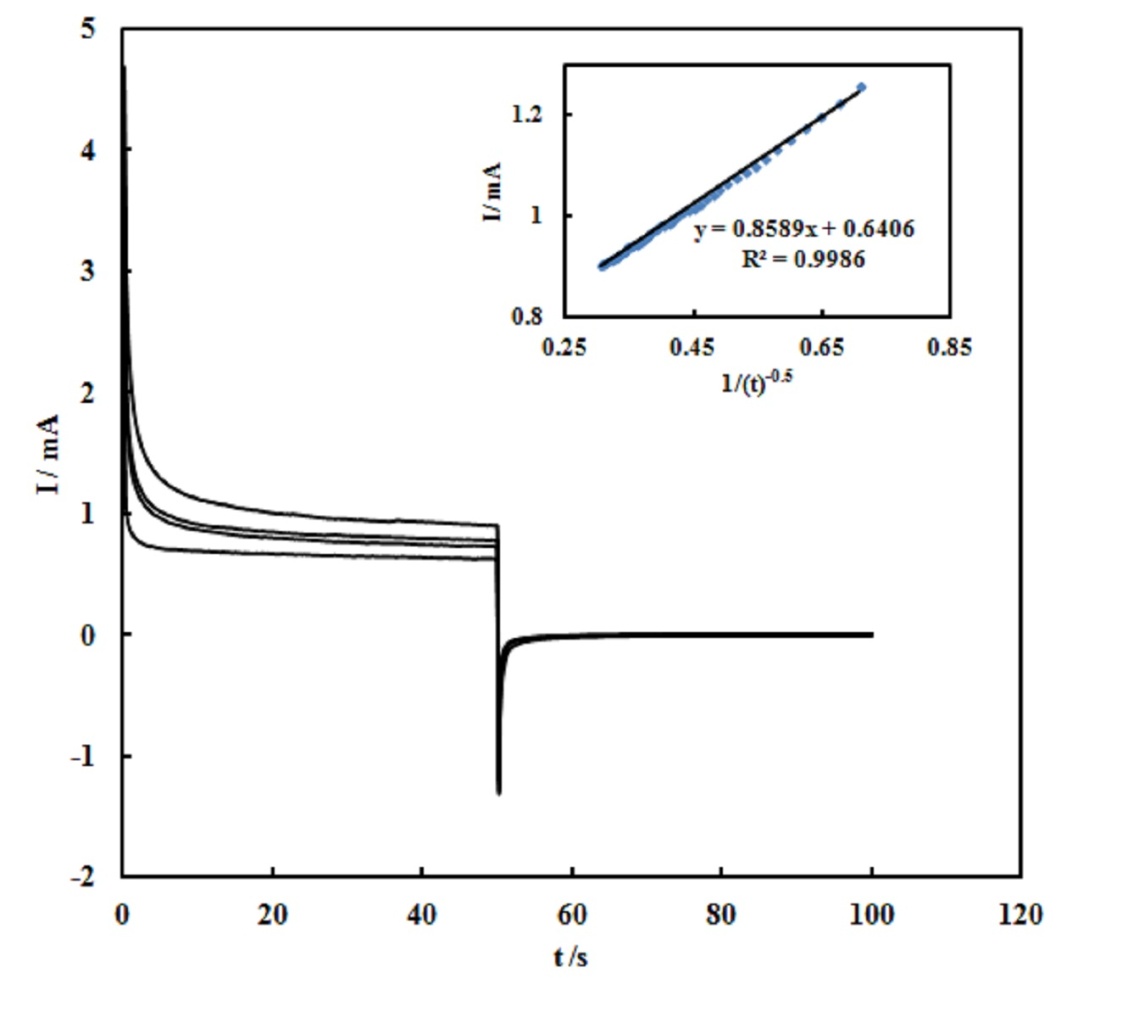 | Figure 6. The double-step chronoamperograms for the SPE/MWCNTs/NiO modified electrode in the absence and presence of different concentrations of urea. The applied potential steps were 750 and -200 mV. Inset: plotting the net currents versus the minus square roots of time |
 | (4) |
 | (5) |
 | (6) |
 | (7) |
 | (8) |
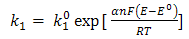
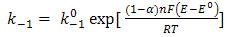
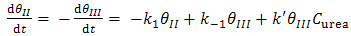
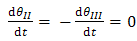
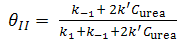
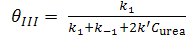
 and
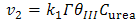
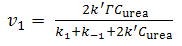
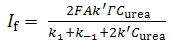
and  are the chemical rate constants measured at (E-E0)=0 and α is the charge transfer coefficient. The rate laws for reactions 7 and 8 have the following forms:
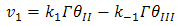 | (9) |
 | (10) |
 | (11) |
 | (12) |
 | (13) |
 | (14) |
 | (15) |
 | (16) |
 | (17) |
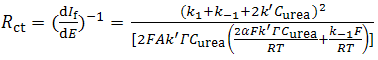
3.4. Electrochemical Impedance Spectroscopy Study
- Electrochemical impedance spectroscopy provides an effective method to probe the electron transfer resistance features of surface-modified electrodes. A typical shape of impedance spectrum (presented in the form of Nyquist plot) includes a semicircle region lying on the real part of complex impedance axis followed by a straight line. The semicircle part, observed at higher frequencies corresponds to the limited charge-transfer process, whereas the linear part of the spectrum is characteristic of the lower frequency range, and represents the diffusion-limited process. The semicircle diameter in the impedance spectrum equals to the charge-transfer resistance, Rct. the experimental impedance spectra were fitted with computer-simulated spectra using an electronic circuit based on the Randles and Ershler theoretical model [30].Fig. 7A shows the Nyquist diagrams of the SPE/MWCNTs-NiO modified electrode which were recorded at DC offset in 750 mV in both the absence and the presence of urea in 0.10M NaOH solution. In the absence of urea, a slightly depressed semicircle is observed, whereas in the presence of urea, a steady decrease in the diameter of the semicircle is noticed. The equivalent circuit compatible with these results is drawn in scheme 1.
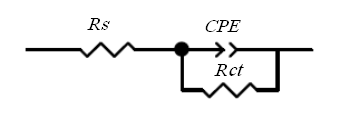 | Scheme 1. |
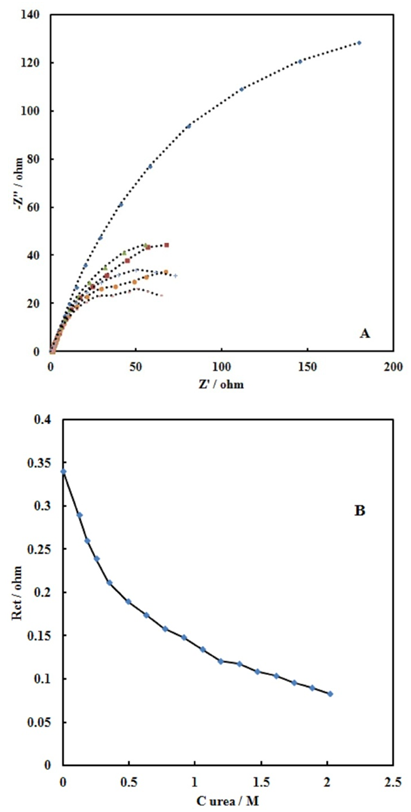 | Figure 7. (A)Nyquist diagrams of a SPE/MWCNTs/NiO electrode recorded at 750 mV as the dc-offset for without and 0.001 to 0.6 M of urea. (B) Dependency of Rct with urea concentration |
 and
and  mol-1s-1. The value of the obtained catalytic rate constant was
  mol-1s-1.
4. Conclusions
- SPE/MWCNT-NiO modified electrode was checked for electro-oxidation of urea in alkaline medium. The electrode showed electrocatalytic oxidation for urea. Chronoamperometric works showed a powerful anodic current at the oxidation potential of low-valence nickel hydroxide in further support of the mediated electro-oxidation. A kinetic model was developed and the kinetic parameters were calculated using the urea concentration dependency of charge transfer resistance derived from the impedance studies. Using cyclic voltammetry and chronoamperometry techniques, the kinetic parameters of urea, such as charge-transfer coefficient and diffusion coefficient for oxidation, were determined.
ACKNOWLEDGEMENTS
- The support of this work by research grants from the NSTRI Research Council is gratefully acknowledged.