-
Paper Information
- Previous Paper
- Paper Submission
-
Journal Information
- About This Journal
- Editorial Board
- Current Issue
- Archive
- Author Guidelines
- Contact Us
Advances in Analytical Chemistry
p-ISSN: 2163-2839 e-ISSN: 2163-2847
2013; 3(A): 28-33
doi:10.5923/s.aac.201307.05
Underpotential Deposition of Lead at Silver Electrodes Manufactured from Compact Discs and its Determination in Environmental Water Samples
 Abstract
 Reference
 Full-Text PDF
 Full-text HTML
Kevin C. Honeychurch
Centre for Research in Biosciences, Faculty of Applied Sciences, University of the West of England, Bristol, BS16 1QY, UK
Correspondence to: Kevin C. Honeychurch, Centre for Research in Biosciences, Faculty of Applied Sciences, University of the West of England, Bristol, BS16 1QY, UK.
| Email: |  |
Copyright © 2012 Scientific & Academic Publishing. All Rights Reserved.
The present paper describes the facile manufacture of silver electrodes from compact discs for the anodic stripping voltammetric determination of lead. The voltammetric behaviour of Pb in 0.1 M HCl was examined by cyclic voltammetry. Using a starting potential of 0.0 V and switching potential of 0.60 V a distinct underpotential deposition (UPD) process was recognizable resulting in a reduction process at 0.43 V, with a corresponding stripping peak at 0.37 V on the return positive going scan. If a more negative switching potential of 0.90 V was used a further stripping peak is seen with an Ep of 0.49 V, indicative of the stripping of a bulk deposited Pb layer. The possibility of using this UPD behaviour for the determination of trace levels using this medium was examined by anodic stripping voltammetry using the differential pulse waveform in the measurement step. The developed method was evaluated by carrying out Pb determinations on spiked and unspiked roof drainage water. The unfortified sample was found to contain 99.6 ng /mL. The percentage recovery gained for the same sample fortified with 100 ng/mL was calculated to be 95 % with an associated coefficient of variation of 2.7 %.
Keywords: Anodic Stripping Voltammetry, Silver Electrode, Compact Disc, Water, Underpotential Deposition
Cite this paper: Kevin C. Honeychurch, Underpotential Deposition of Lead at Silver Electrodes Manufactured from Compact Discs and its Determination in Environmental Water Samples, Advances in Analytical Chemistry, Vol. 3 No. A, 2013, pp. 28-33. doi: 10.5923/s.aac.201307.05.
Article Outline
1. Introduction
- In some countries collecting rainwater from roof runoff is common method of obtaining water. However, this can result in elevated Pb levels due to contamination from commonly used roofing materials[1]. Clark et al[2] have reported levels of Pb between approximately 5 ng/mL and 500 ng/mL Pb in roof runoff and a recent report has recorded levels in µg/mL range[3] in some instances. The toxicity of Pb has been known for some time and as knowledge regarding its toxicology has developed it is increasingly regarded to be unsafe at any level[4]. Poisoning in infancy is reported to impair the development of the anterior cingulate cortex and prefrontal cortex; parts of the brain which regulate behaviour and mood[5]. The toxic effects of Pb can be connected with a number of behavioural conditions, such as; attention deficit disorder [6,7], impulsiveness, aggression and psychopathic behaviour[8]. Associations with reduced intelligence quotient (IQ) and elevated blood concentrations have been documented for some time[9]. In adults Pb intake can lead to high blood pressure, kidney, reproductive and nervous system problems. Consequently, there is a demand for methods which are both sensitive and economic for the determination of Pb in environmental and potable water systems.This paper is focused on the voltammetric behaviour of Pb at a silver electrode manufactured from a recordable compact disc (ACD). In particular attention has been focused on the underpotential deposition (UPD) process; where up to a monolayer of metal is electrochemically deposited on a foreign electrode substrate at potentials substantially more positive than the potential required for the deposition of the bulk over potential deposition (OPD) of the metal[10-15]. Cyclic voltammetric investigations show such processes to be generally characterised by two oxidation stripping peaks on the reverse positive going scan[14,15]. The most negative of these resulting from the more easily oxidised bulk deposited layers and the second more positive peak resulting from the more strongly adsorbed monolayer of metal deposited directly at the electrode surface[13].The UPD of metal ions has been reported to offer several analytical advantages compared to OPD[15]. At low analyte concentrations the metallic deposit covers a small percentage of the electrode surface. As a result the electrode surface structure remains mainly unchanged hence improving the precession of the analytical response. This effect also diminishes the need to clean and reactivate the electrode surface after each measurement. The low number of atoms on the electrode surface required (less than a monolayer) means that plating times must be kept short leading to short analysis times. Reports have also shown the possibility of working in the presence of dissolved oxygen[16], alleviating the need for degassing the sample.As far as it is known, this is the first report on the UPD behaviour and determination of Pb(II) at a Ag electrode manufactured from a compact disc (CD). Previous studies have explored the possibility of determining a number of analytes at electrodes made from CDs, however, these have been predominantly Au based[17-23].
2. Experimental
2.1. Chemical and Reagents
- All chemicals were of Primar grade and supplied from Fisher (Loughborough, UK), unless stated otherwise. Lead stock solutions were prepared by dissolving the appropriate mass of Pb(NO3)2 in deionised water. Working standards, for optimisation studies, were prepared by dilution of the primary stock solution with deionised water. Deionised water was obtained from a Purite RO200–Stillplus HP System, (Purite Oxon, UK). Electrolyte solutions for cyclic voltammetric studies were prepared by dilution of concentrated HCl with the appropriate volume of water to give 0.1 M. Rainwater roof runoff samples were collected from a domestic house gutter down pipe. Aliquots (9 mL) were adjusted to be 0.1 M HCl with 1 M HCl before DPASV analysis.
2.2. Apparatus
- Cyclic voltammetry and differential pulse anodic stripping voltammetry (DPASV) were performed with a Autolab potentiostat interfaced to a PC for data acquisition via the General Purpose Electrochemical System Software Package (GPES) version 3.4 (Autolab, Windsor Scientific Limited, Slough Berkshire UK). The voltammetric cell contained a graphite rod counter electrode, a saturated calomel electrode (SCE) (Russell, Fife, UK) and a ACD, as the working electrode. The electrode was then connected to the potentiostat using a crocodile clip attached to coaxial cable inserted into the appropriate sockets. The cell used for the voltammetric measurements was obtained from Metrohm (Switzerland); a small circular magnetic stirrer disk was placed in the bottom of the cell, for stirring in the pre-concentration step of DPASV. This was rotated at a fixed constant rate by a rotary stirrer (Mini MR stirrer, Whatman, Maidstone, Kent, UK). Scanning electron microscopy was undertaken using a Philips XL30 ESEM. Energy dispersive x-ray microanalysis (EDX) was undertaken using an Oxford Instruments Link ISIS 3.2 EDX system.
2.3. Voltammetric Procedures
- Cyclic voltammograms were initially recorded in plain solutions 0.1 M of HCl, and then in the same solution containing 0.1 mM of Pb. The voltammetric conditions were as follows: initial potential, 0.0 V; scan rate 100 mV/s and switching potential, 0.6 V or 0.9 V. Anodic stripping voltammetry (ASV) was carried out using a differential pulse waveform. Deposition was carried out for 100 s at -0.5 V (vs. SCE) while stirring the solution via a magnetic stirrer bar. Following deposition, the solution was left in quiescence for 15 s. The stripping voltammogram was recorded from -0.5 V using a step height of 2.4 mV, step width of 0.2 s, pulse amplitude of 50 mV, and pulse duration of 50 ms.
2.4. Construction of Compact Disc Electrode
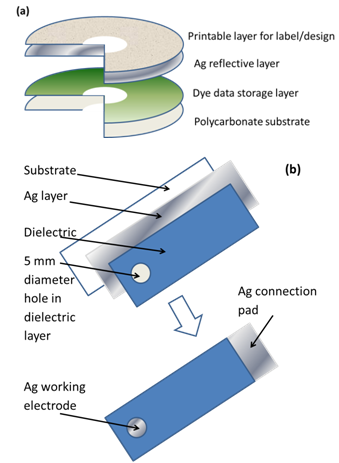 | Figure 1. (a) Schematic of CD and (b) ACD electrode construction |
3. Results and Discussion
3.1. Scanning Electron Microscopy
- Figure 2 shows a representative scanning electron micrograph of the metal layer obtained from the CD. Notably tracks can be seen across the surface for the laser of the CD reader/writer to follow. These would appear to be a series of ca. 1 μm spaced parallel stripes, similar to that seen by Laforge et al[25]. EDX analysis of this layer showed this to be composed of Ag with little evidence of other elements being present.
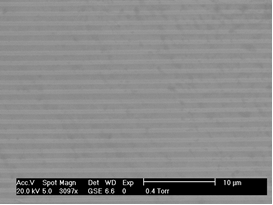 | Figure 2. Scanning electron micrograph of the Ag CD surface. Scale bar = 10 µm |
3.2. Cyclic Voltammetric Behaviour
- A representative cyclic voltammogram for the redox behaviour of 0.1 mM Pb at an ACD in 0.1 M HCl is shown in figure 3. A distinct UPD process is recognizable at 0.43 V, with the formation of a sub-monolayer, with the corresponding stripping peak at 0.37 V. These have very similar Ep values to the shown recently by Campbell and Compton at a conventional silver electrode[26]. If a more negative a switching potential, of 0.90 V is used, then a further stripping peak is seen on the return positive going scan with an Ep of 0.49 V is recorded, indicative of the stripping of a bulk deposited multilayer of Pb.
 | Figure 3. Typical cyclic voltammograms obtained with an ACD in 0.1 M HCl containing 0.1 mM Pb |
3.3. Optimization of ASV Conditions for Trace UPD Pb Measurements by Differential Pulse Anodic Stripping Voltammetry
3.3.1. Effect of Deposition Potential
- Initial studies were performed to investigate the effect of deposition potential on the UPD Pb stripping. Using the differential pulse anodic stripping voltammetric conditions described in section 2.3. The behaviour of Pb at the ACD was investigated over the range 0.35 V to 0.65 V (vs. SCE). Figure 4 shows a plot of the resulting anodic stripping current obtained with a solution containing 0.1 mM of Pb(II) using an accumulation time of 45 s stirring with 15 s in quiescence. As can be readily seen, the anodic stripping peak current increases sharply between 0.40 V and 0.55 V and begins to plateau at potentials more negative than this. However, at deposition potentials more negative than 0.50 V a second more negative stripping peak was observed, resulting from the OPD Pb multilayer. As it was the aim of this investigation to focus on the UPD behaviour of Pb(II) a deposition potential of 0.50 V was used in further investigations.
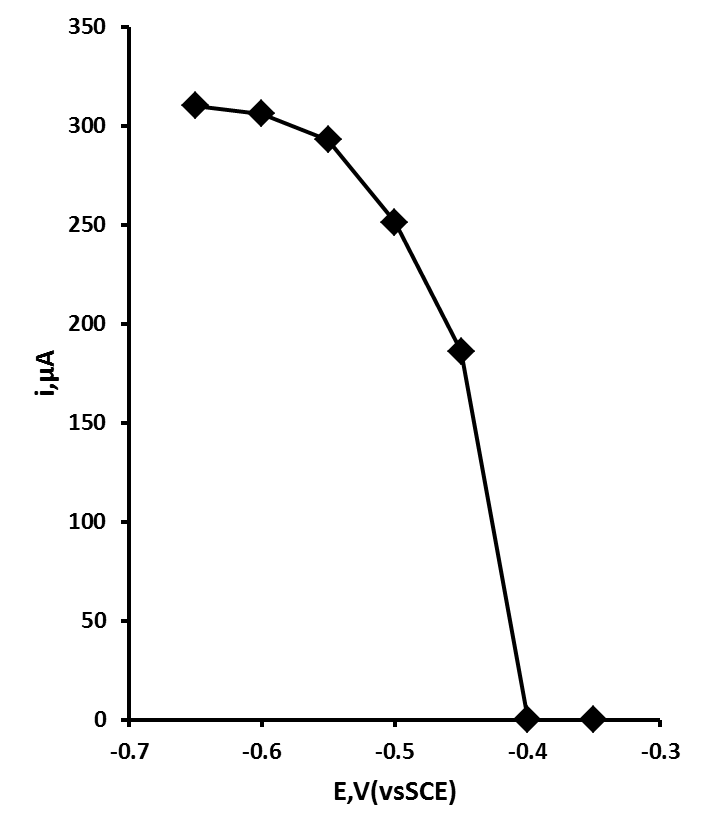 | Figure 4. Effect of deposition potential on the peak current for a 0.1 mM Pb(II) in 0.1 M HCl solution at a ACD. Deposition time 45 s, plus 15 s quiescent |
3.3.2. Effect of Deposition Time
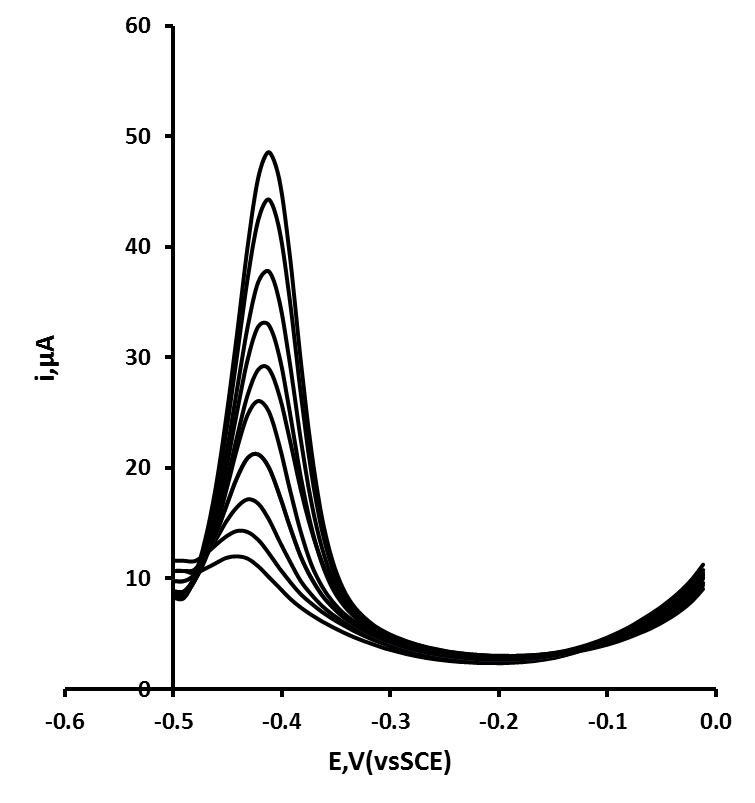 | Figure 5. Effect of deposition time from 10 s to 200 s for a 105 ng/mL Pb solution. Applied potential 0.5 V. Other voltammetric conditions as for figure 4 |
3.3.3. Calibration Plot, Limit of Detection and Precision Studies by DPASV
- A calibration study was performed on standard Pb solutions prepared in 0.1 M HCl using a deposition potential of 0.50 V and deposition time of a 100 s (plus 15 s quiescent); one ACD was used throughout this study. The calibration plot was found to be linear between 20 ng/mL and 350 ng/mL Pb(II) (R2 = 0.998, slope = 90.2 nA/ng/mL). The limit of detection was calculated by making replicate measurements at 0.412 V for a blank solution. Based on a signal-to-noise ratio of 3:1 this was calculated to be 6 ng/mL. The coefficient of variation was determined by preforming five replicate measurements on solutions containing 42 ng/mL Pb(II) and was calculated to be 4.1 %.
3.3.4. Analytical Application
- The ACD was evaluated by carrying out Pb(II) determinations on a roof rainwater sample. The deposition time and potential, as well as DPASV parameters were the same as used previously. The concentration of Pb was determined using the method of multiple standard additions. The sample was found to contain 99.6 ng/mL Pb (%CV = 2.7 %, n = 5). The sample was fortified to be 100 ng/mL Pb and a percentage recovery of 95.1 %, (%CV = 5 %) was obtained. Figure 6 shows the effect of added standard additions to a typical fortified sample.
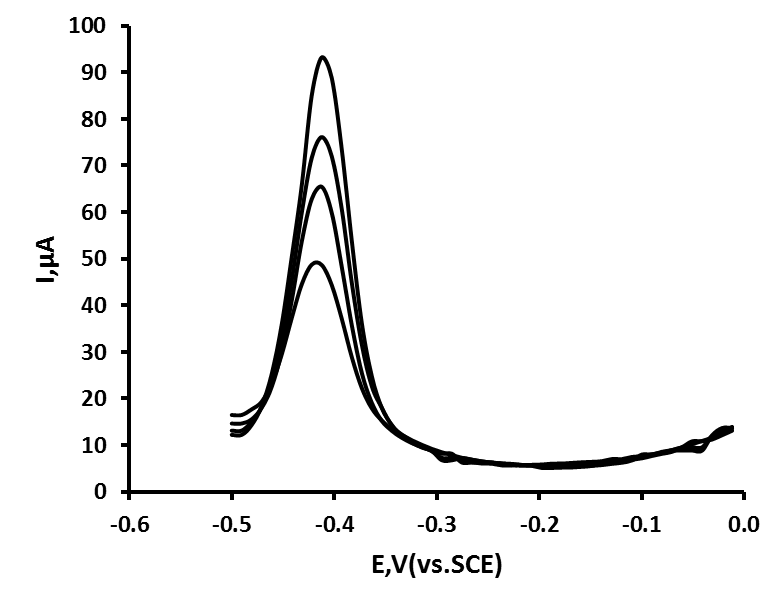 | Figure 6. DPASVs of roof drainage rainwater sample, fortified with 100 ng/mL Pb, with added concentrations of Pb: 0 ng/mL, 22.2 ng/mL, 66.6 ng/mL and 111 ng/mL. Accumulation time: 100 s, deposition potential: 0.5 V (vs. SCE) |
4. Conclusions
- A simple and economic method has been shown for the manufacture of silver electrodes from compact discs. Cyclic voltammetric investigations were undertaken to explore the UPD and OPD behaviour of Pb at these electrodes. By applying a deposition potential of 0.5 V it was possible to utilise the UPD of Pb to determine trace Pb(II) concentrations in environmental water samples by DPASV without the need to degas the sample. The sample was found to contain 99.6 ng/mL Pb, a level which falls in the range of values previously reported in the literature[1-3]. Samples fortified with 100 ng/mL were found to give a mean recovery of 95.1 %. It is envisaged that further work will be performed to develop ACDs for trace detection of other metal pollutants. Investigations will also focus on the possible modification of the electrode surface to increase the selectivity and the sensitivity.
ACKNOWLEDGEMENTS
- Dr. David Patton is thanked for his assistance with the SEM and EDX investigations. I am grateful to the University of the West of England.